
Usage overview
All organizations in Sigma automatically receive a set of Sigma-built Usage dashboards. The Usage dashboards provide measurable insights into how your organization uses Sigma in the form of detailed tables and charts representing your organization’s usage trends, query statistics, document access changes, and much more. You can download this data and the associated charts for later use.
Audit log events are not intended to be compared with usage data. Audit logs are designed for security, compliance, and governance use cases and provide a detailed, immutable record of who did what and when in your Sigma organization. Usage data contains aggregate data about workbook queries performed in your Sigma organization and is not intended for auditing purposes.
User requirements
- You must have an Admin account type or have a custom account type that has the View usage dashboard permission enabled. For more information, see Create and manage account types.
Usage reports
| Report | Description |
|---|---|
| Users | Explore user status, view account and license type breakdowns, track user engagement and activity, and view insights into your organization’s teams. |
| Document activity | Discover your organization’s most commonly used documents and which users are accessing them the most. You can use these insights to audit unused documents and identify documents that drive the most user engagement. |
| Document permissions | Discover who has permission to a document, permission origins, access type, and which users have changed access types for other users. You can use these insights to help monitor access type changes for security purposes. |
| Exports | View data about your organization’s top exporting users and browse a list of your most commonly exported documents, including instances of both on demand and scheduled exports, to gain insight into what is being shared the most externally and by what users or teams. |
| Materializations | Explore materialization statistics, including materialization failure rates and runtimes, and browse a list of each of your documents that use materializations. Keep track of your organization's materializations with a detailed log of all materializations created and used by your organization. |
| Queries | View detailed data and insights about your organization’s queries. Explore statistics about success and timeout rates, runtimes, query types, and much more. Discover users and documents that run the most queries and gain insight into popular times and days for certain queries. Track your organization’s queries with a detailed log of all queries and relevant information. |
| Embedding | View public embedding and application embedding (legacy) usage for your organization. Secure embeds are not tracked. Users are tracked using the external_user_id or, when available, email from the embed URL. |
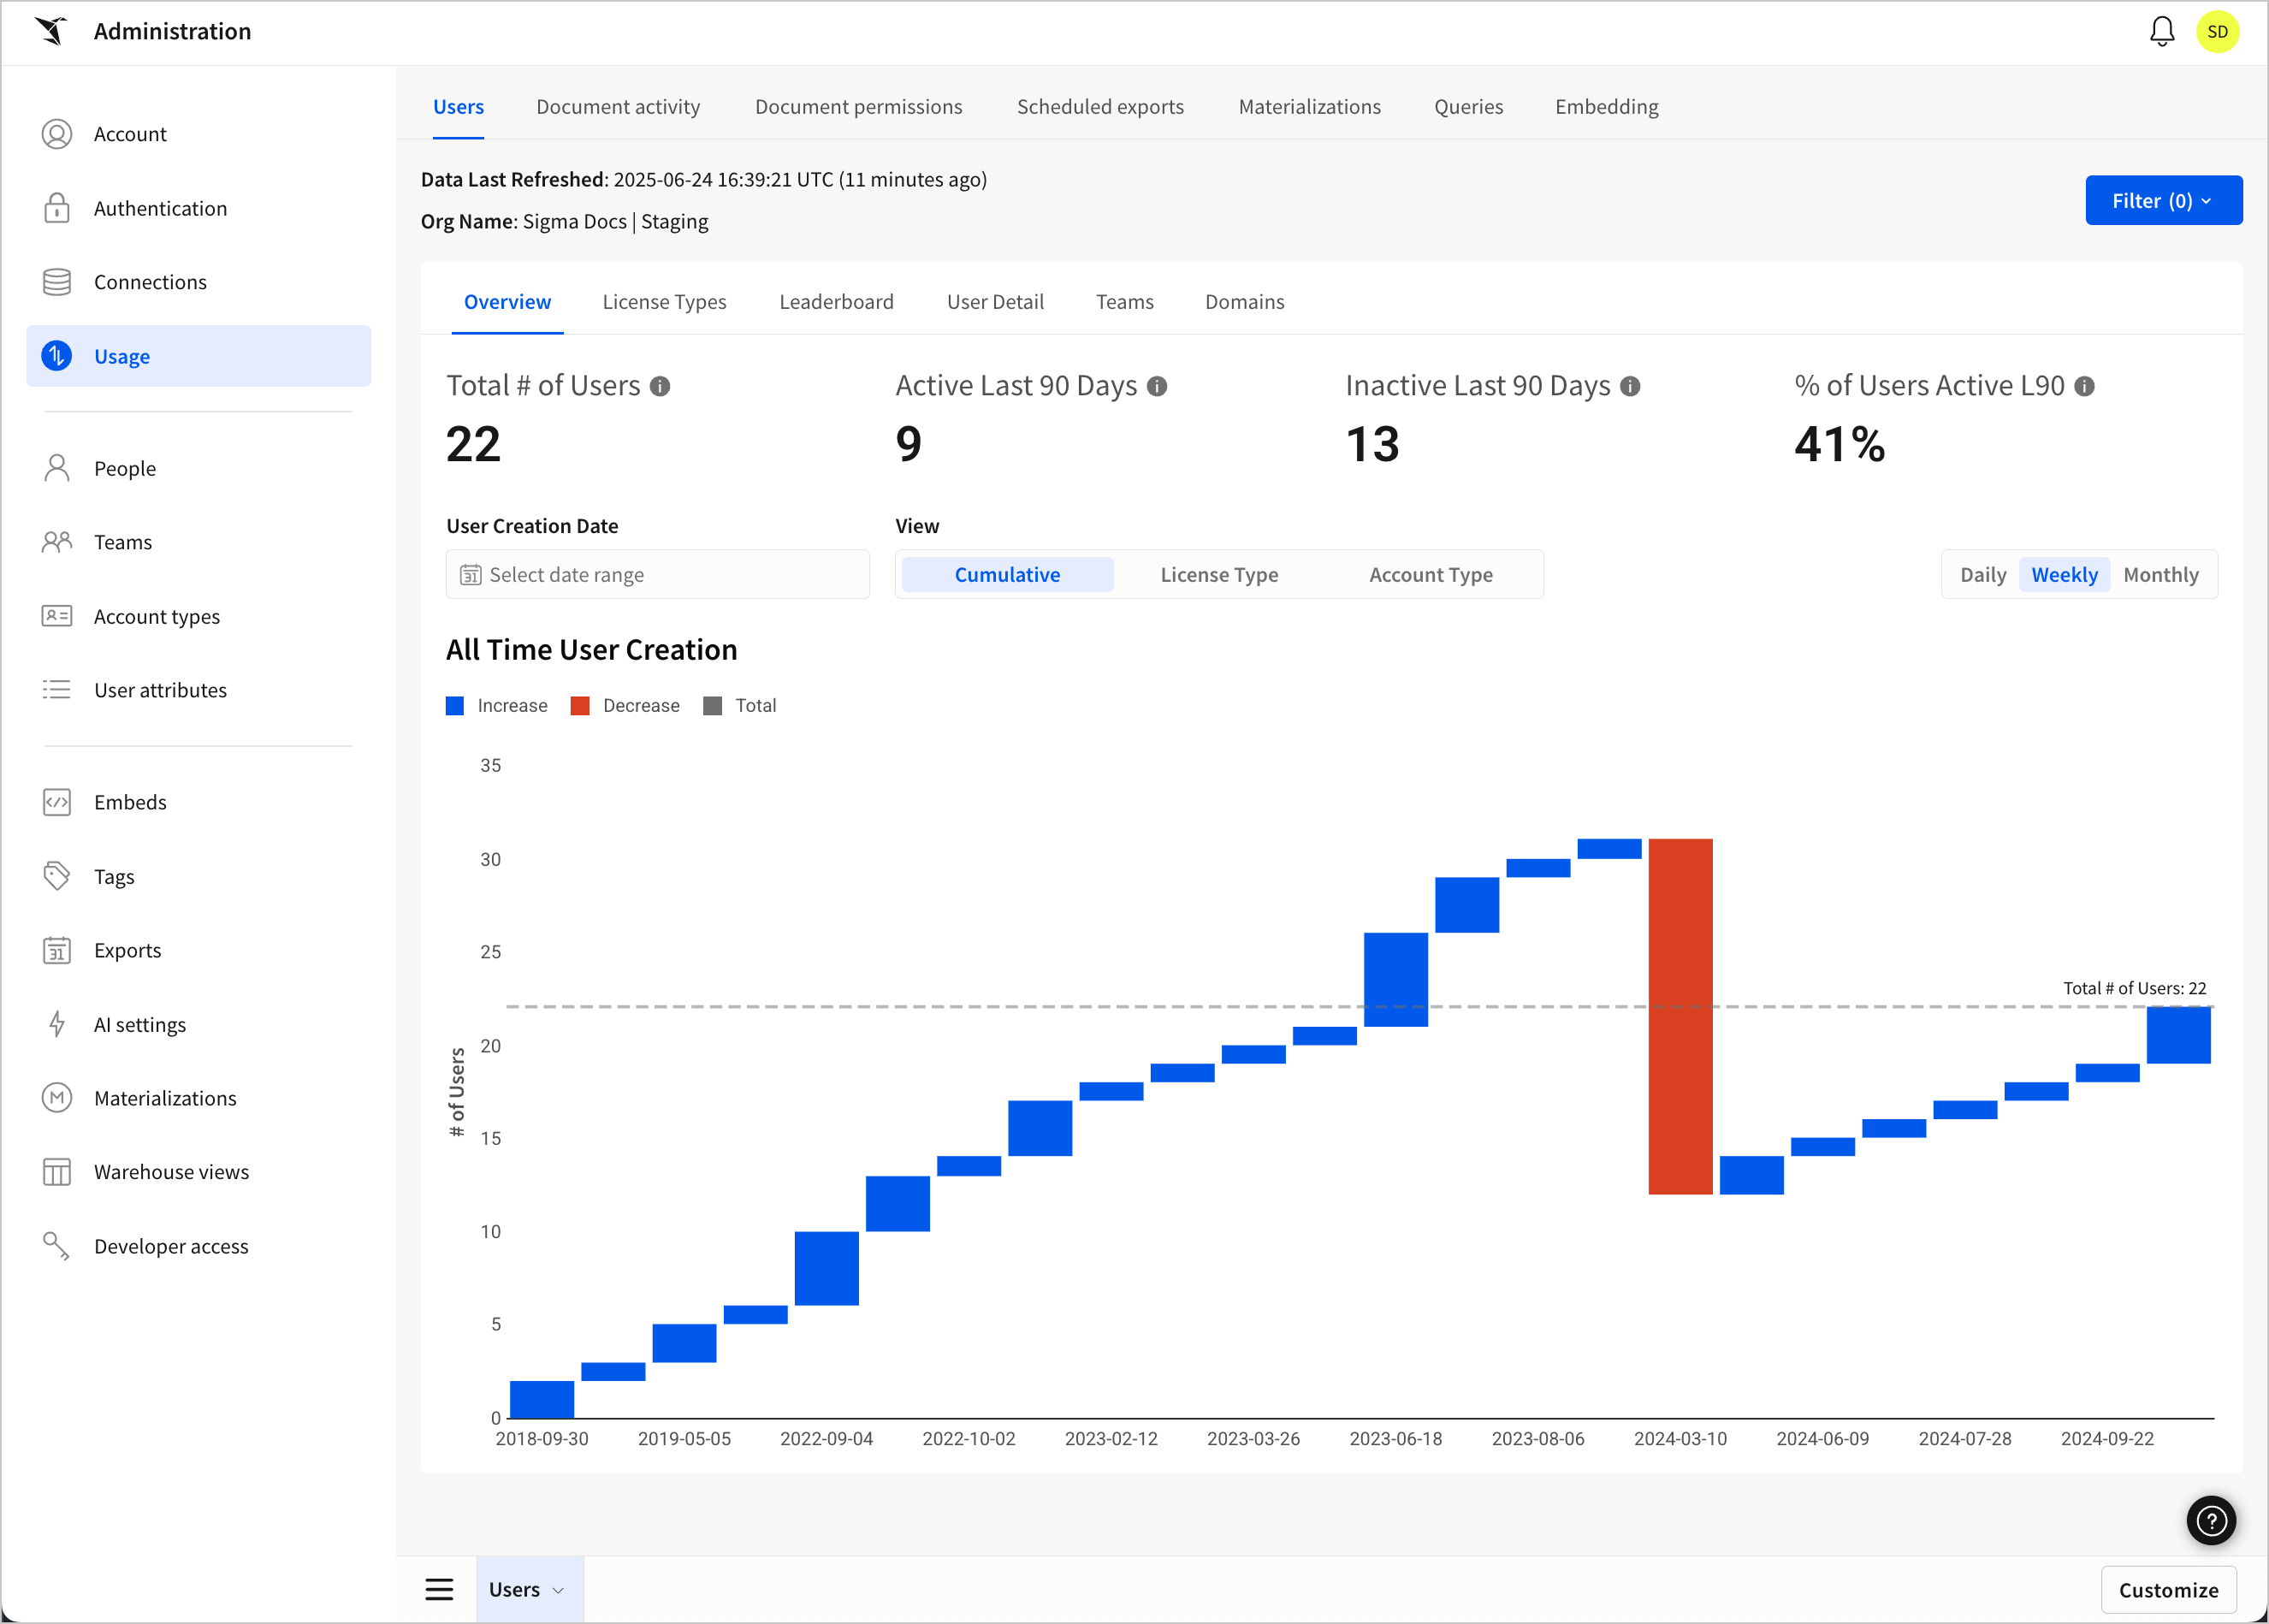
Access your usage information
- Access the Usage tab of the Administration portal:
- In the Sigma header, click your user avatar to open the user menu.
- Select Administration to open the Administration portal.
- In the side panel, select Usage. The Users dashboard opens by default.
- (Optional) To open a different dashboard, click one of the tabs on the top of the page.
Some usage dashboards include at least one control that let you filter data in the dashboard. Explore your data by inputting different values into these controls.
Save a custom view
You can customize your view of a usage dashboard and save it for future use. This allows you to change the colors, truncations, filters, groupings, and more of the existing usage dashboards. Or, you can even create new dashboards and charts using the usage dashboard data and save them in a custom view you can return to at any time.
To create and save a custom view of a usage dashboard:
-
Open the usage dashboard you wish to create a custom view for.
-
Click Customize to open a custom view. The editor panel opens.
-
Customize a data element's formatting, change one of its properties, apply a filter, or add a new element to change the dashboard from its original state.
-
Click Custom view and then select Custom views > Save this custom view...
The Save view modal opens.
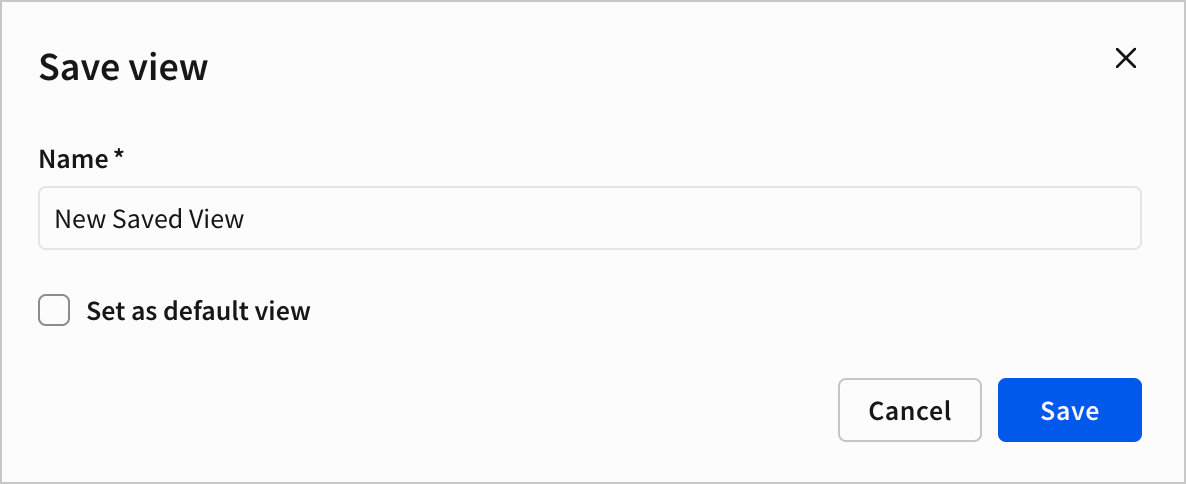
-
In the Save view modal, enter a name for the saved view.
-
(Optional) Check the checkbox for Set as default view to save this view as the default view.
-
Click Save to save the custom view.
You can reopen this saved view at any time from the document menu. See Accessing previously saved views.
Export usage dashboard data
You can export the data and charts of your usage dashboards or schedule an export to occur on a configured schedule. This allows you to create and share regular updates or reports on your organization's usage of Sigma. You can also export and schedule exports for saved custom views created from usage dashboards.
Exports, reports, and downloads are subject to the following notice.
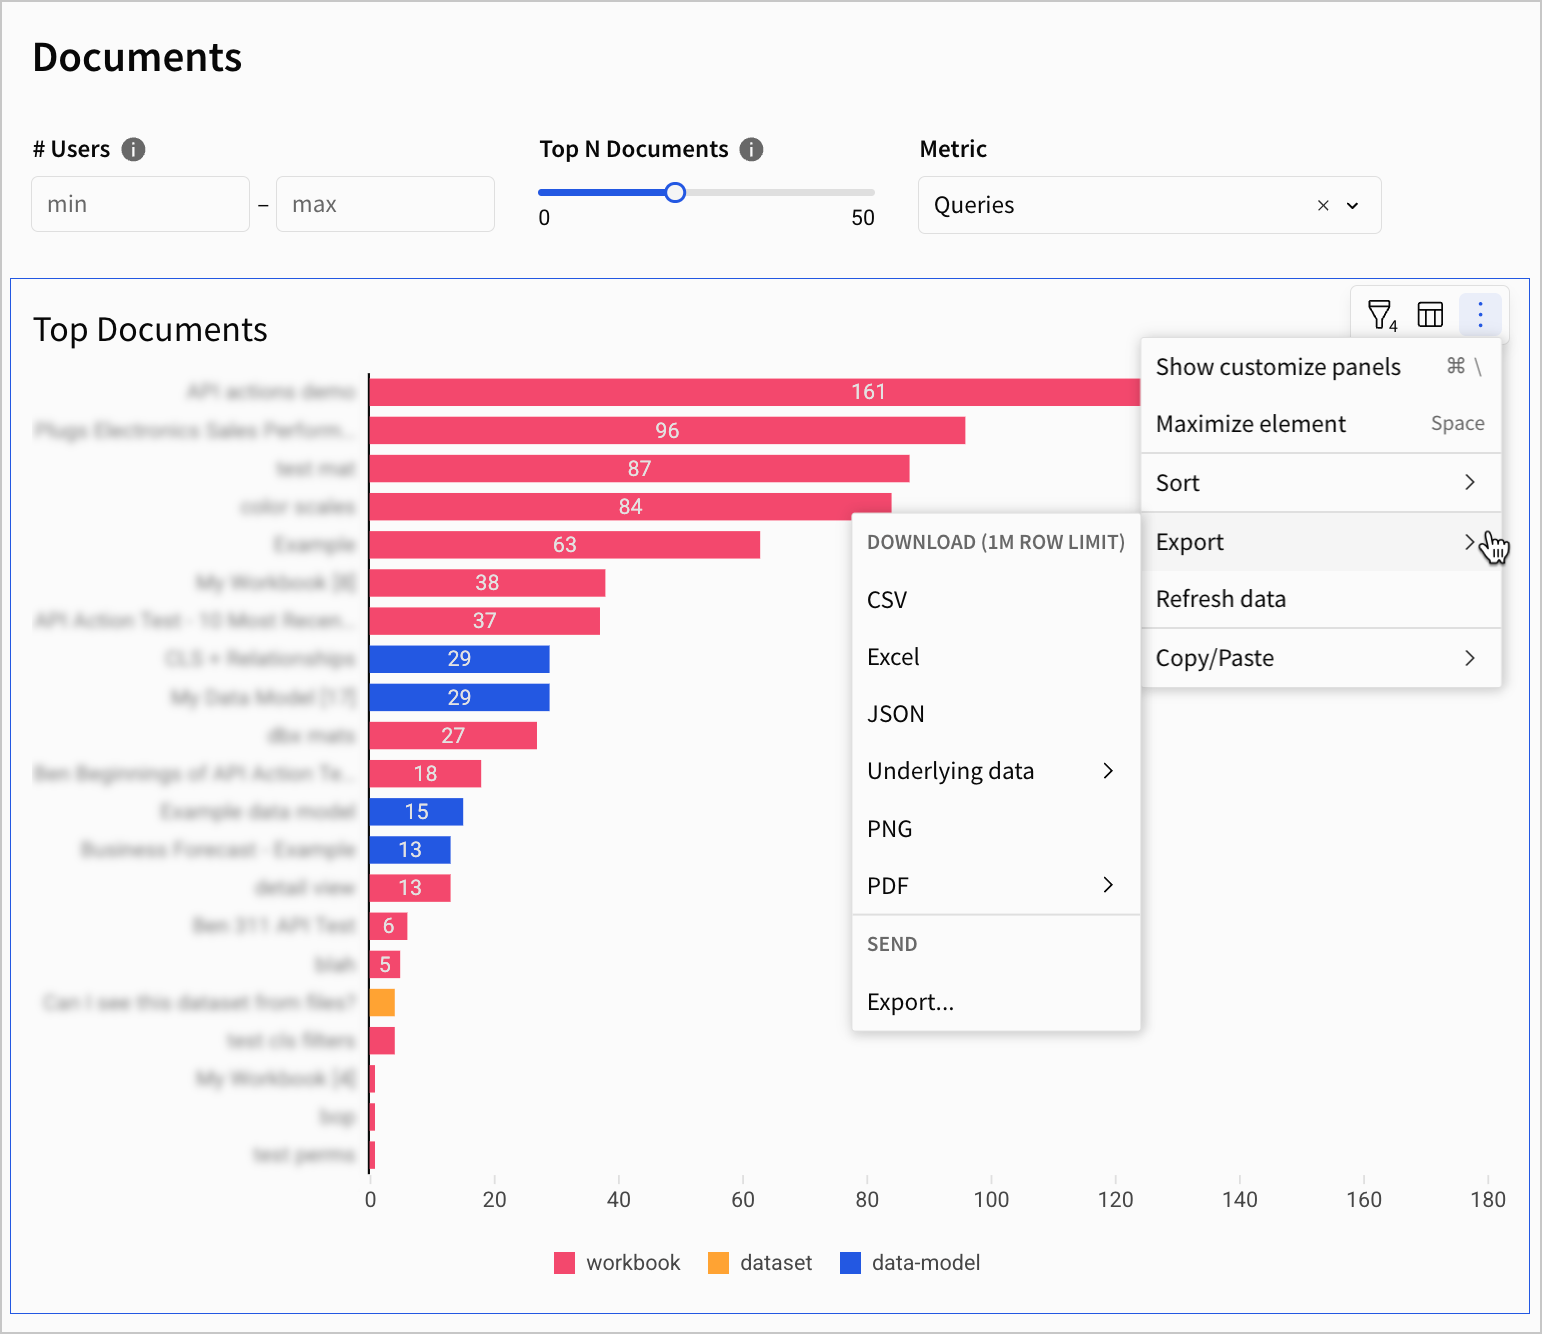
Export an individual table or chart
You can download the charts you see in your usage dashboard for more flexible sharing and use outside of Sigma.
-
Select the chart you want to download.
-
From the element toolbar, click
 More.
More. -
Hover over Export and select an export type.
Download usage dashboard data
Individual usage dashboard pages, data elements, and even the entire usage dashboard as a whole can be exported and downloaded for use outside of Sigma using the same methods you would use to download any workbook in Sigma.
To download usage dashboard data:
- Open the usage dashboard you want to download.
- Open the dashboard's document menu.
- Select Export... to open the Export modal.
- Configure the settings in the Export modal. For more information, see Download workbook data.
Send or schedule a usage dashboard export
You can also send data exported from usage dashboards as emails or schedule email exports to occur on a configured regular basis.
- Open the usage dashboard you want to download.
- Open the dashboard's document menu.
- Select Export... to create an ad hoc email export or Schedule exports... to create a new schedule.
- Click Email.
- Configure the settings for email exports in the Export or Schedule export modal. For more information, see Send or schedule workbook exports.
Data update intervals
The data for each dashboard is updated according to the following intervals:
| Dashboard | Refresh frequency |
|---|---|
| Document Activity | Hourly |
| Document Permissions | Daily |
| Embedding | Hourly |
| Exports | Hourly |
| Materializations | Hourly |
| Queries | Hourly |
| Users | Hourly |
Updated 4 months ago