Subtotal
The Subtotal function returns the subtotal for an aggregate formula.
Syntax
Subtotal(aggregate, mode, [parameters])
Function arguments:
-
aggregate (required) - The aggregate formula to apply across the specified mode and parameters.
-
mode (required) - The mode to use when calculating the aggregate formula. Mode determines which dimension(s) to use when performing the calculation.
-
General purpose modes
"grand_total"(default for visualizations and pivot tables) - Calculates the subtotal for the aggregate formula.
-
Visualization modes
-
"color"- Calculates the aggregate formula using only the column specified for COLOR. -
"x_axis"- Calculates the aggregate formula using only the column(s) placed on the X-AXIS. -
"trellis_column"/"trellis_row"- Calculates the aggregate subtotal using only the dimension specified for the TRELLIS COLUMN or TRELLIS ROW.
-
-
Pivot table modes
-
"column"/"row"- Calculates aggregate subtotal for the column or row total. -
"column_parent"/"row_parent"- Calculates the aggregate subtotal for the column or row total, relative to the subtotal calculation for the parent dimensions.
-
-
Table modes
"parent_grouping"- Calculates the aggregate formula using the grouping keys from a parent grouping. This is equivalent to creating the aggregate calculation in a parent grouping and referencing it from a column in a lower grouping.
-
-
parameters (optional) - Specifies how many parent dimensions to ignore. Only applicable if mode is one of the following:
"column_parent"/"row_parent""parent_grouping"
Notes
- The Subtotal function is not available for use in datasets.
- The aggregate argument must be a full aggregate formula, including an aggregate function and its required arguments. It cannot be a reference to an existing aggregate.
- The parameters argument counts groupings from the current grouping up. For example, if the mode is set to
"parent_grouping"and the table has one grouping, setting parameters to2uses no grouping as the parent, performing the calculation for the entire table. Setting parameters to1uses use the parent grouping, performing the calculation for each group in the parent grouping.
Examples
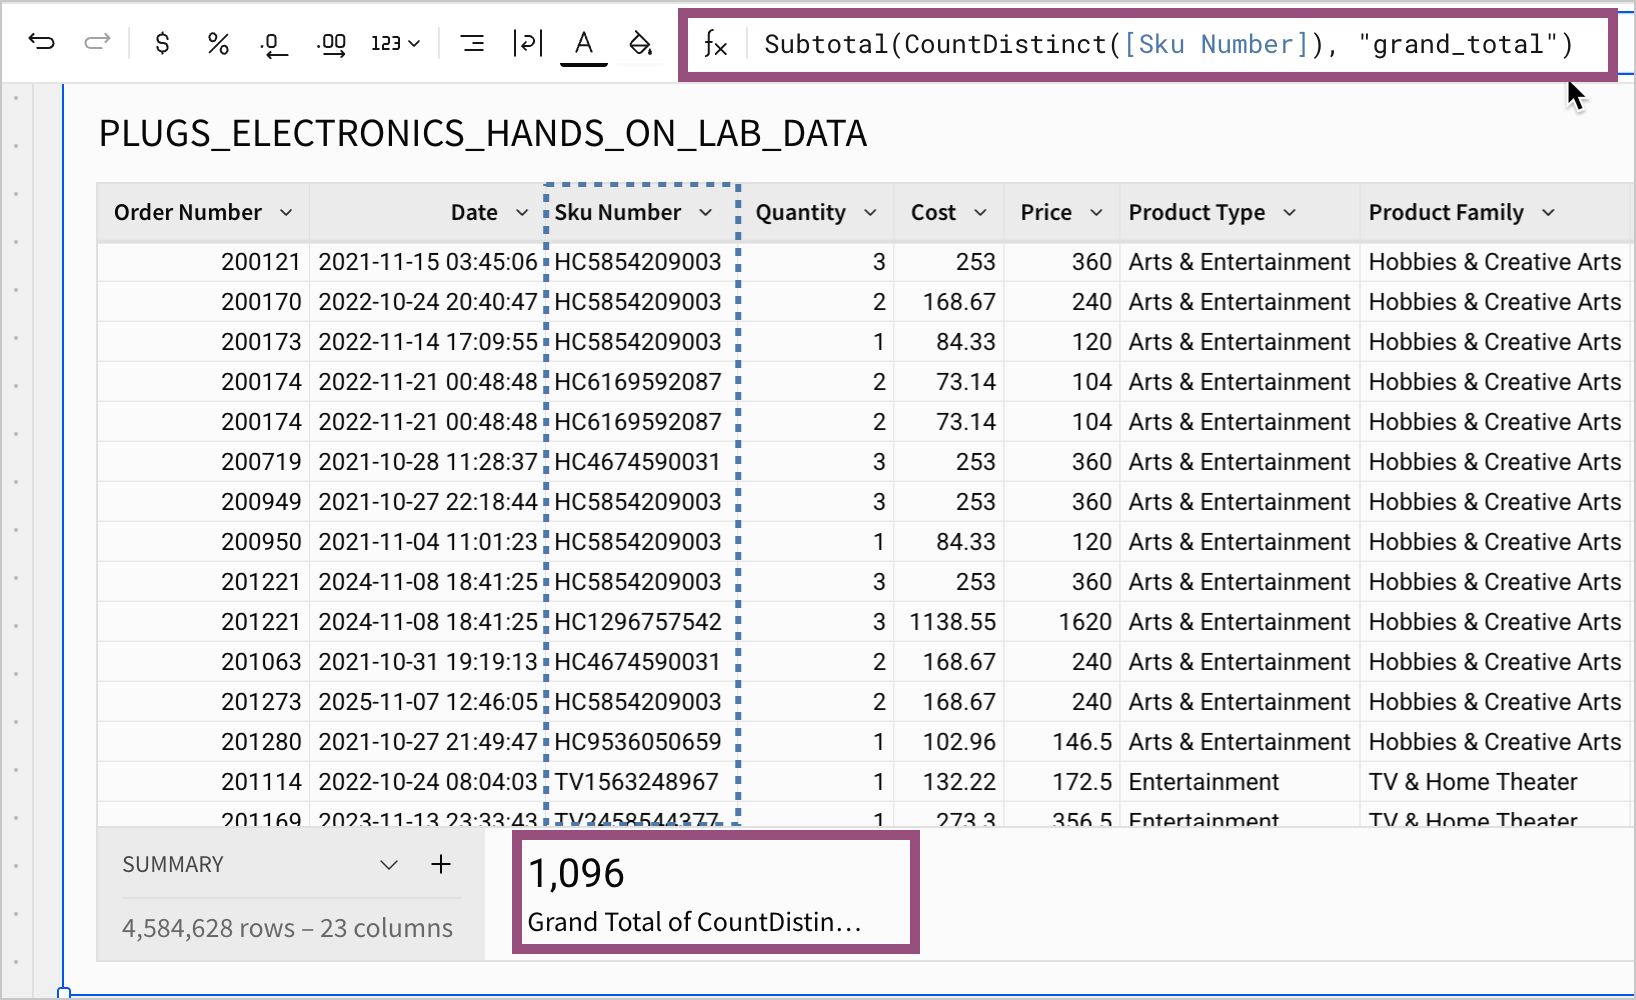
- Returns the total number of unique SKU numbers, across all groupings,
1096. In thePLUGS_ELECTRONICS_HANDS_ON_LAB_DATAdataset, there are 1096 unique SKU numbers. Because this function uses the"grand_total"mode, it is equivalent to the formulaGrandTotal(CountDistinct([Sku Number])).
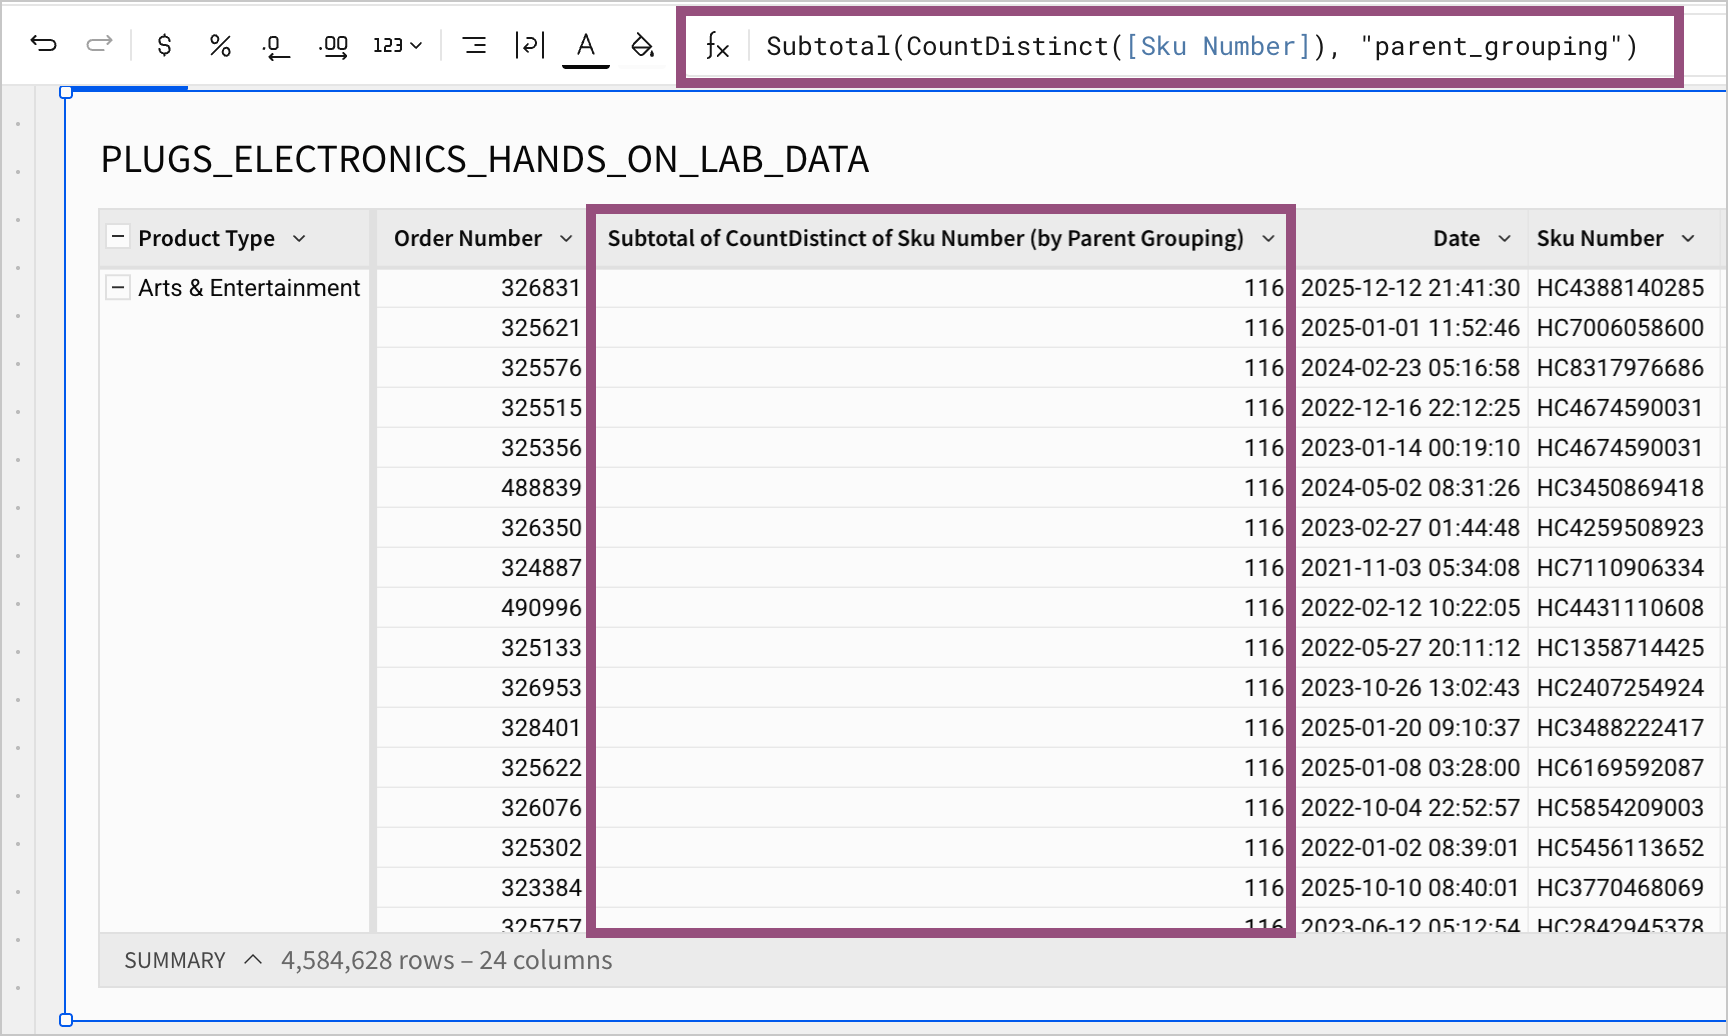
- Returns the total number of unique SKU numbers for each grouping above the current. In the example below, the table is grouped by Product Type. The column Subtotal of CountDistinct of Sku Number (by Parent Grouping) shows the total number of unique products for each parent grouping.
In the PLUGS_ELECTRONICS_HANDS_ON_LAB_DATA dataset, the Art & Entertainment product type has 116 unique products, and so the function returns 116 for each row in that grouping. For rows that are part of a different parent grouping, the value in each row is the number of unique products for that parent grouping.
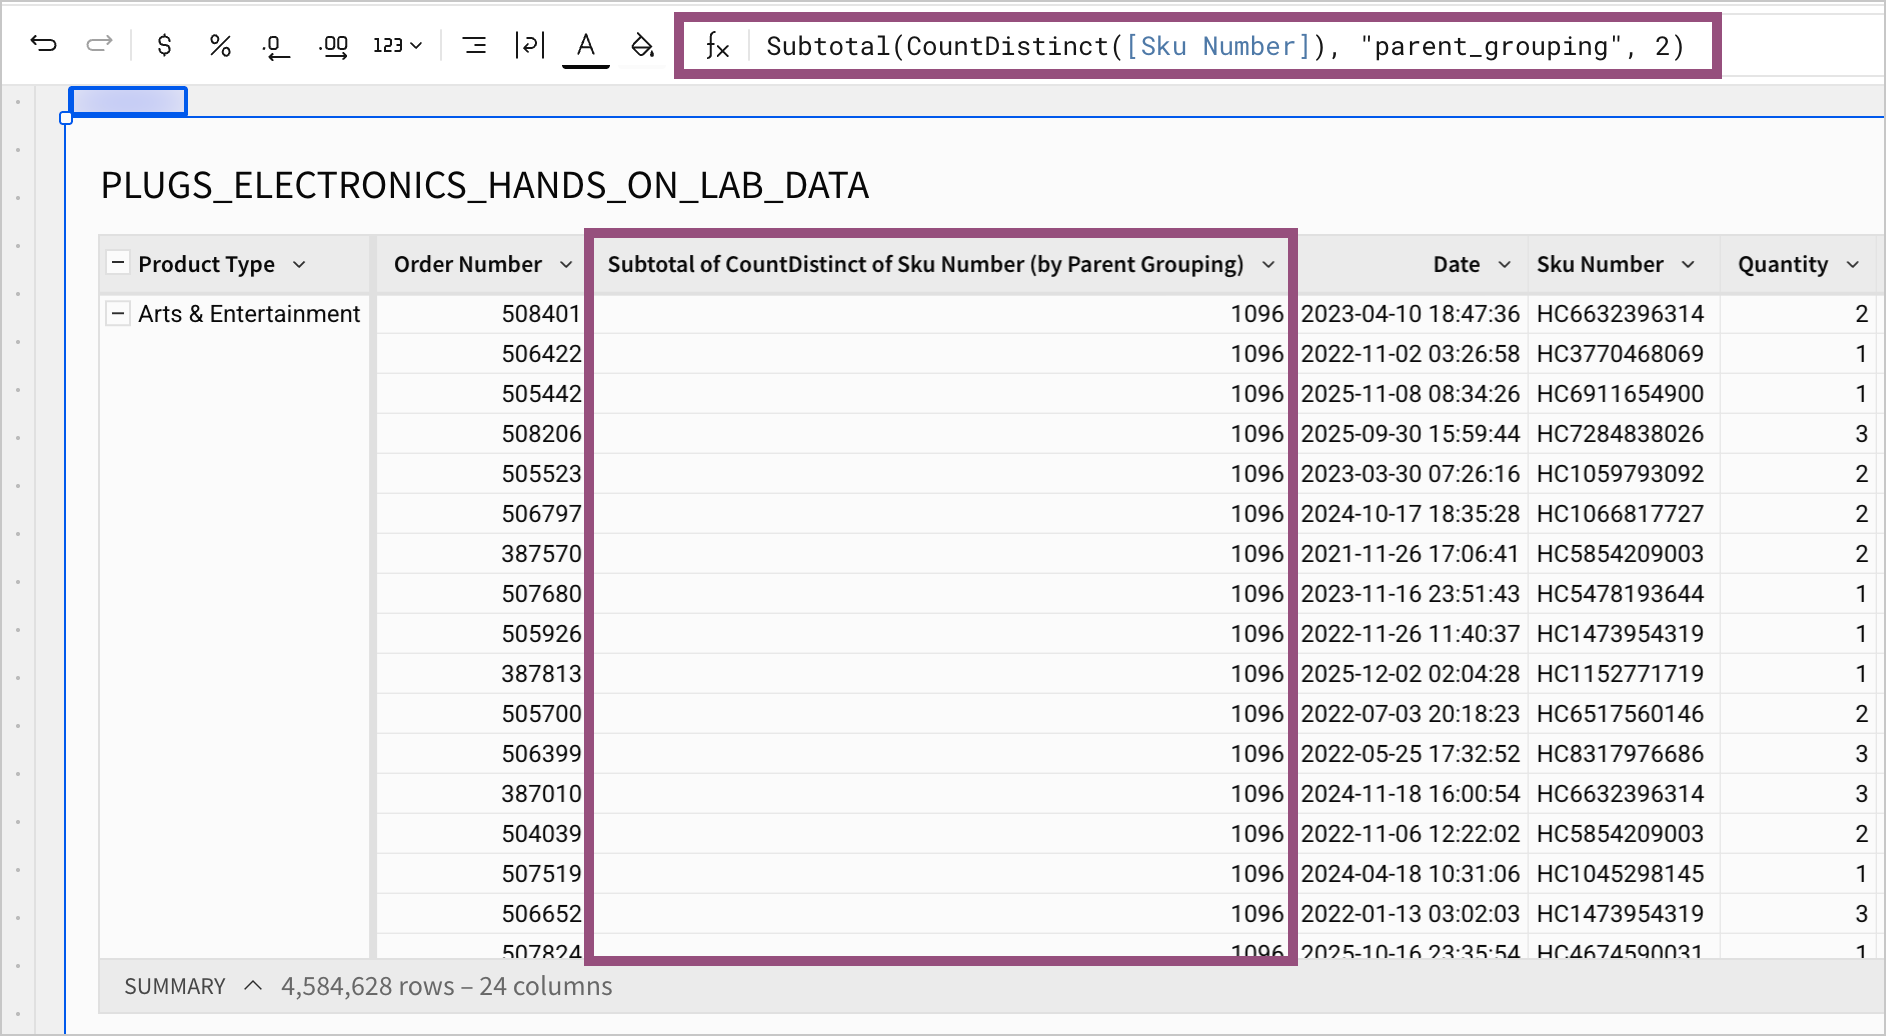
- Calculates the total number of unique SKU numbers for each grouping two levels above the current grouping, and returns
1096for each row. In the example below, the table is grouped by Product Type. The column Subtotal of CountDistinct of Sku Number (by Parent Grouping, 2) shows the total number of unique products for the entire table.
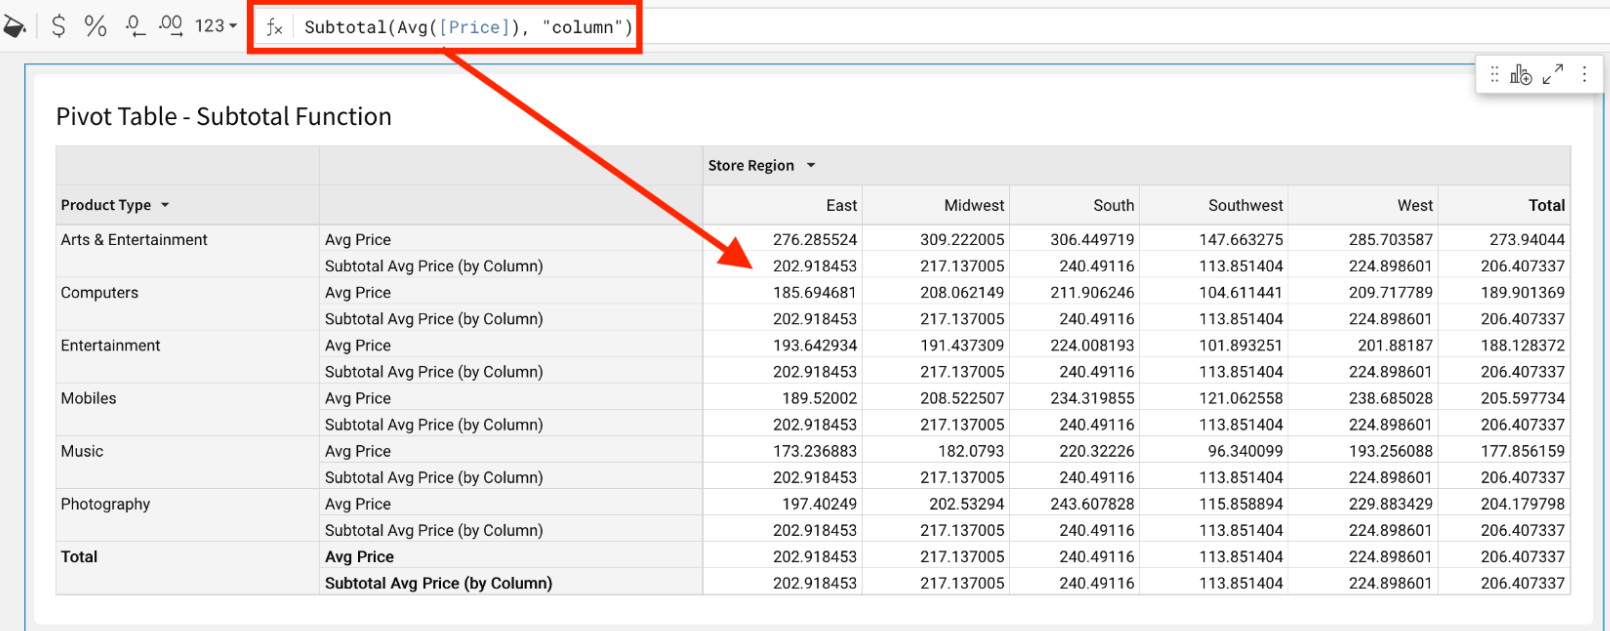
- Calculates the average price for each pivot table column.
In this example, pivot table columns are grouped by the Store Region column, so the Subtotal Avg Price (by Column) shows the average price for each store region. For example, in the column for the East store region, the average price is 202.918453, and so the function returns that value for each row in that column of the pivot table.
- Calculates the number of unique orders for the dimension used to
"color"the chart.
In this example, the chart’s x-axis groups orders by the Store Region column, and the chart is colored by the Product Type column. The Distinct Orders (by Product Type) line in the tooltip shows the number of unique orders for that Product Type, regardless of Store Region. For example, the Photography Product Type has 110509 unique orders in the Midwest, but 485916 unique orders across every Store Region.
