

Top N filter
It’s very common to filter columns by Top N, the top number (N) of rows, based on the filter criteria. This is useful when you want to see the top values in a sorted list, instead of the whole list.
Because of the way Sigma automatically handles aggregations and groupings, the Top N filter may behave slightly differently than what you may have experienced with other products. See the examples and tips below for details.
Examples of Top N
How Applying Top N Changes a Bar Chart
For example, you may be interested in the top 5 stores that move the most merchandise, sorted by state. Before applying the Top N filter, a bar chart may look like this:
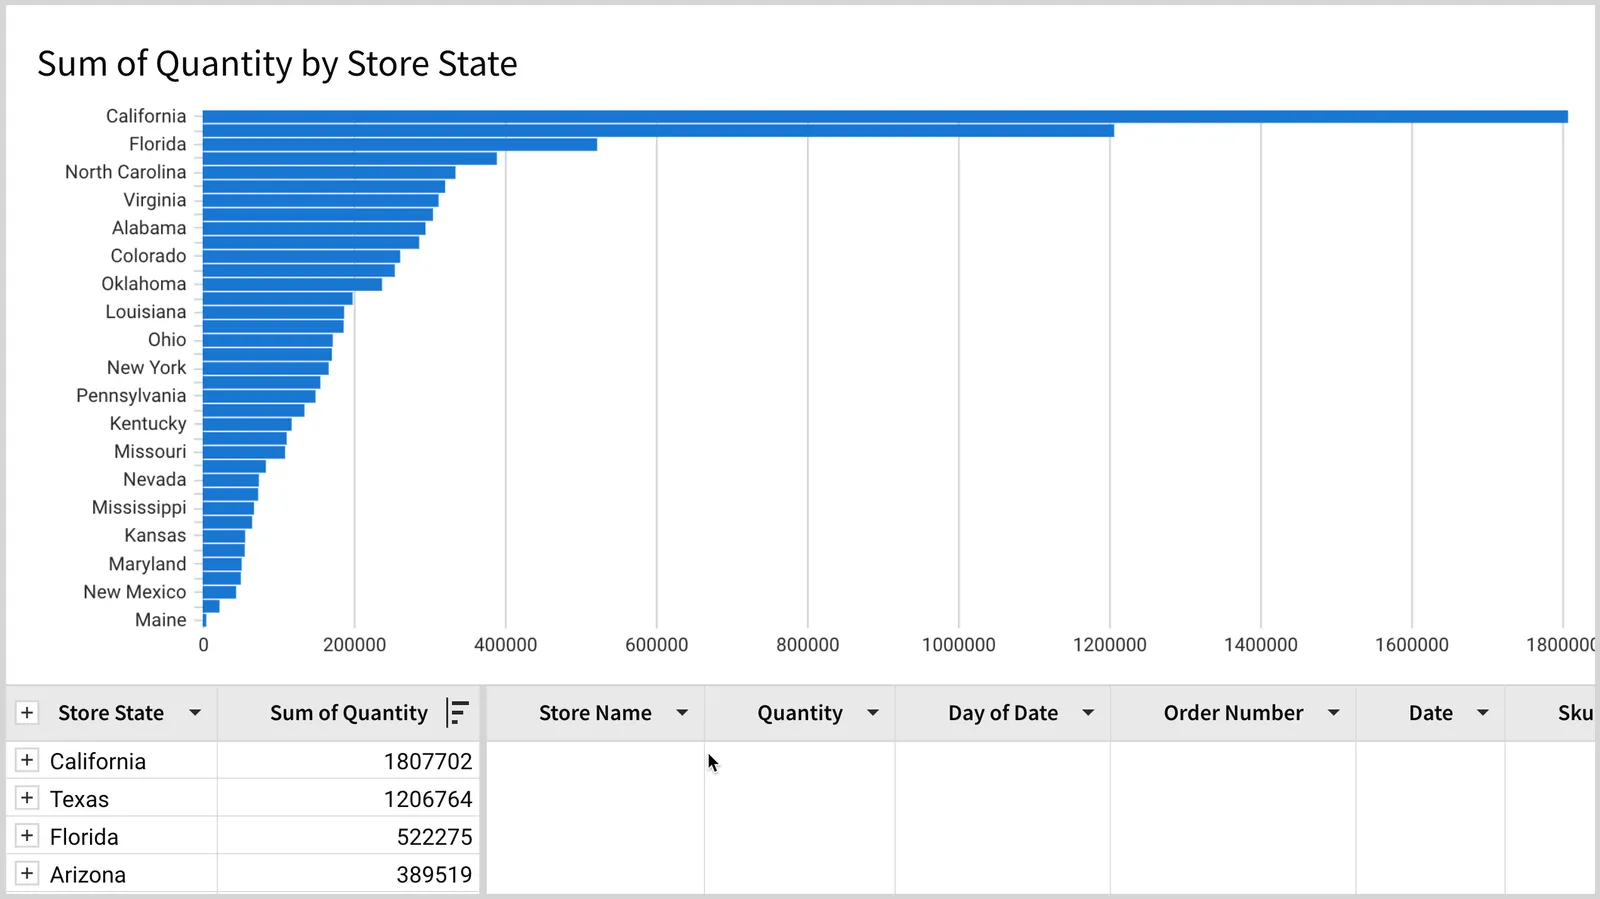
Maximize the chart to see its data table underneath. Sometimes it is helpful when applying filters to see how the filters change the table.
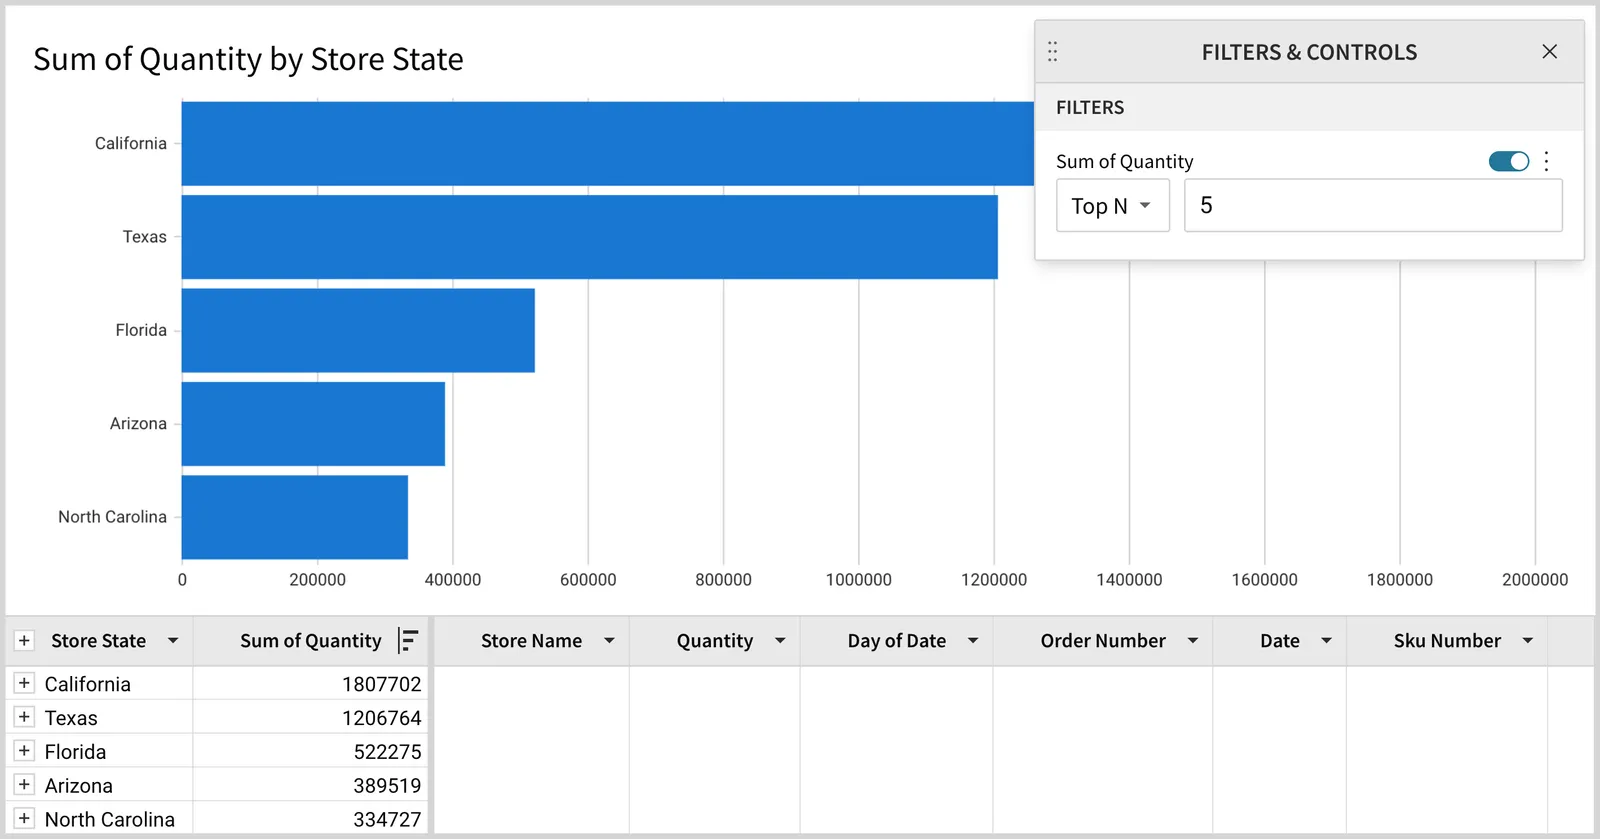
After applying Top N to the Sum of Quantity column, the chart looks like this:
Relationship of Top N Bar Chart to its Table
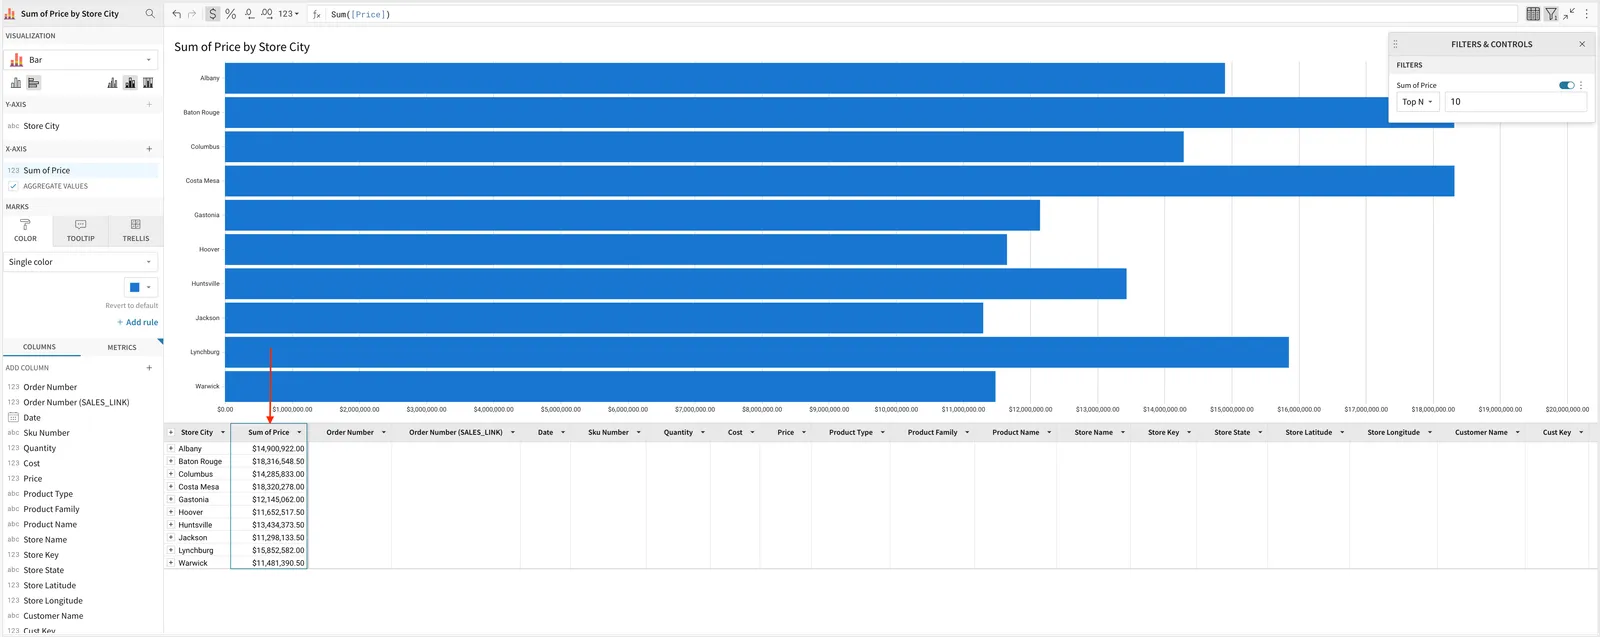
This example shows a maximized view of a chart, which includes its data table. The Top N filter is on the Sum of Price column. (If you put the filter on the Store City column, Sigma would filter the cities alphabetically.) This results in the list of 10 cities whose stores have the highest total prices of all things sold.
Top N on a Pivot Table with Multiple Groupings
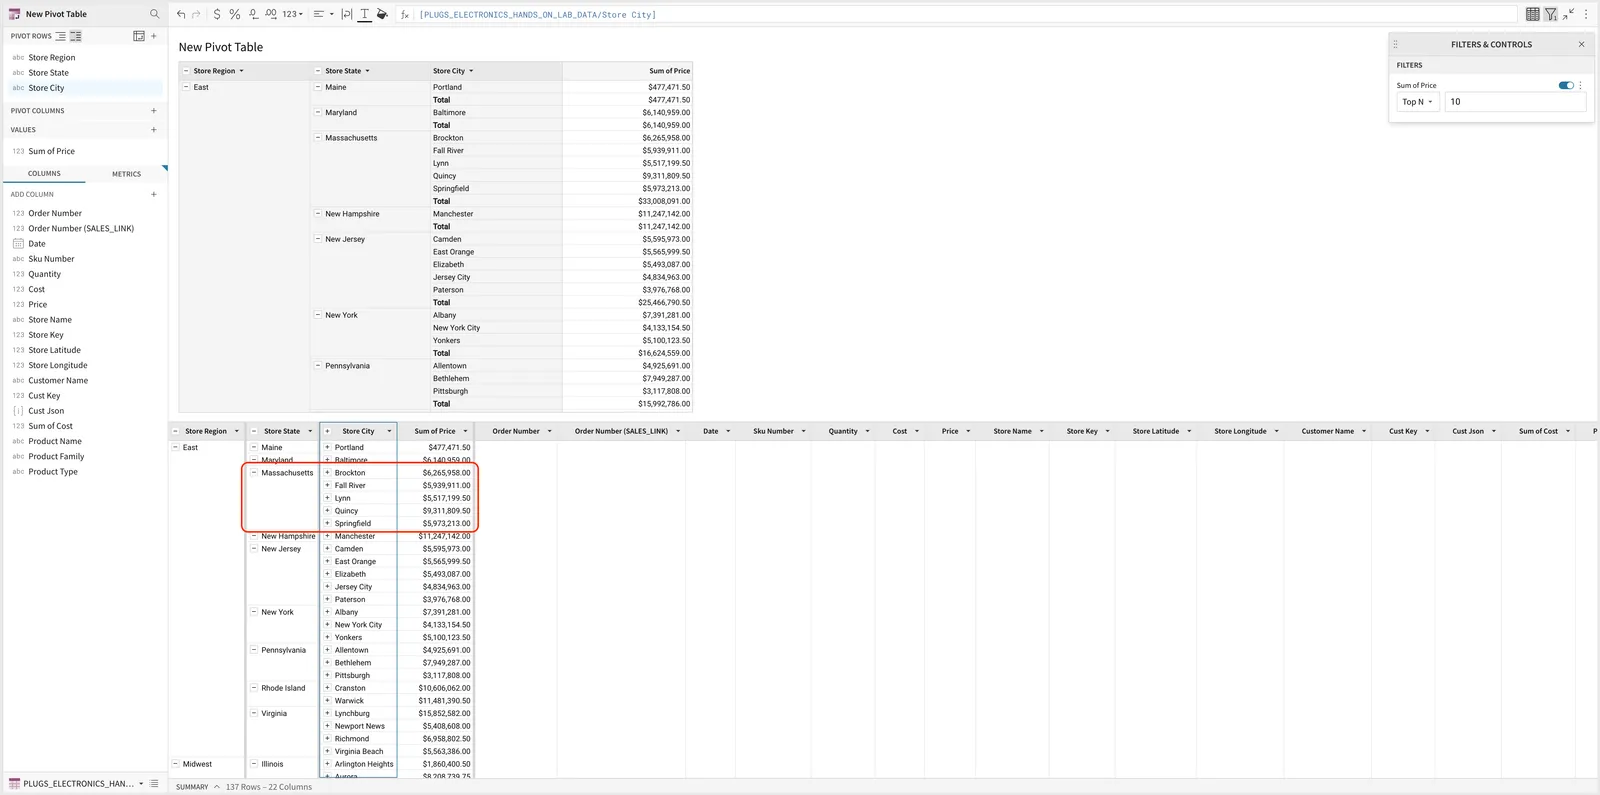
When there are multiple grouping levels, the Top N filter does not filter the overall top 10 items; instead it filters within a bin defined by the 2nd lowest grouping level. In this example, Top N will apply to the Top 10 Store City rather than the Top 10 Store Region or Store State.
Additional Examples
For more in-depth examples see the Community article How to Use a Top N Filter Parameter for Visualizations.
Also see the video from phData, Understanding Top N Filters in Sigma.
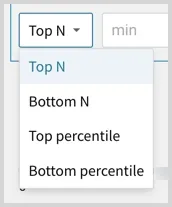
Related Filters: Bottom N, Top Percentile, Bottom Percentile
You can use the same process as described above to use the other filters in the same dropdown.
How to Filter Using Top N
-
Set up the columns on a bar chart.
-
Select a new visualization using + ADD ELEMENT > DATA ELEMENTS > VIZ.
-
Add a column to the Y axis.
-
Add a column to the X axis. Keep the default aggregation.
Sigma requires an aggregated column when using Top N.
-
-
If needed, set the sort criteria.
-
For the column you want to filter, select its menu > Filter.
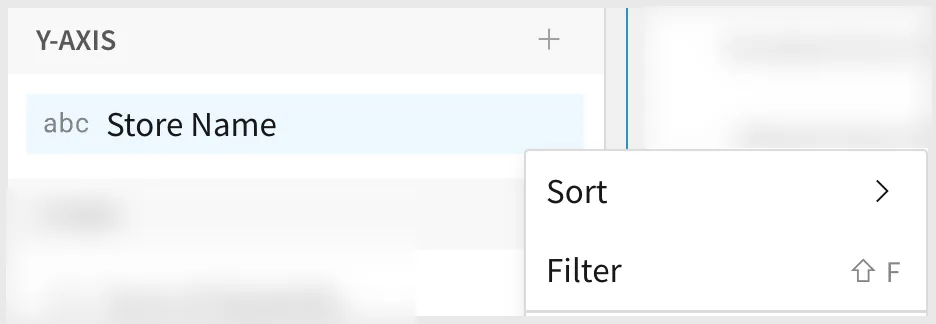
Set the Top N filter on the column you want to be ranked. This can be counter-intuitive. In the example above, you want to show the top 10 Stores, so you would rank on Store Name, not on Sum of Quantity.
-
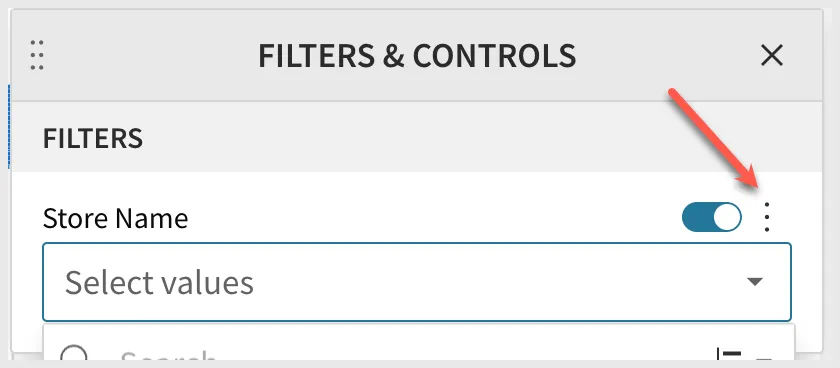
In the Filter panel, click the 3 dots to see the options.
-
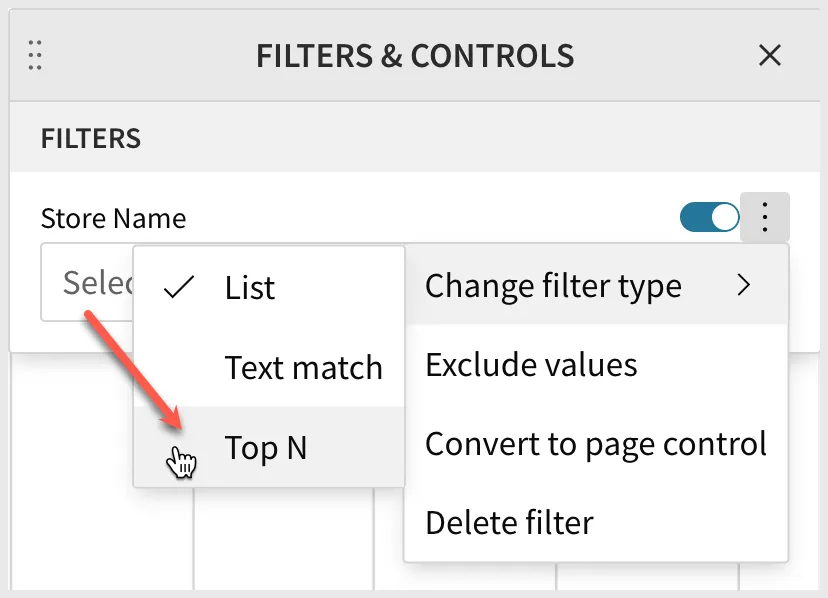
Select Top N.
-
Enter the number of results to display.
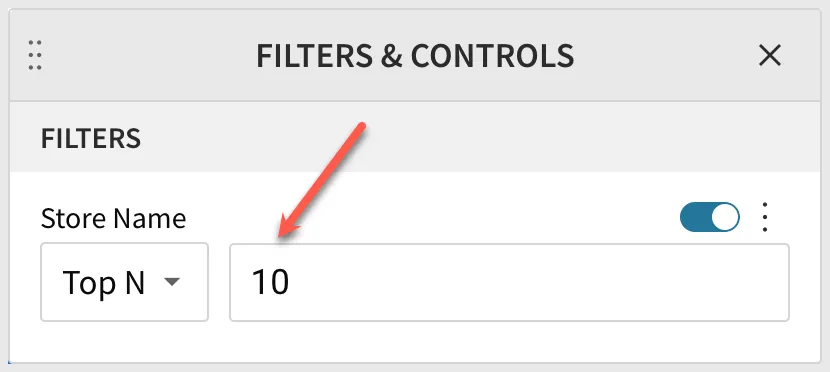
-
Change the default chart header to best describe the filtered chart. For example, change Sum of Quantity by Store Name, which is an internally-produced name, to Top 10 Stores by Quantity Sold.
Change the Ranking Function
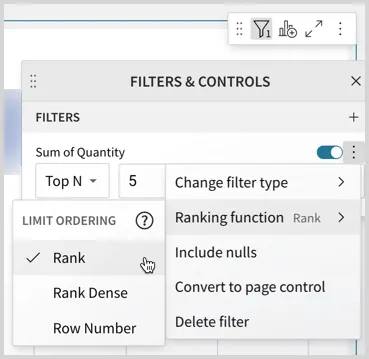
By default the Top N filter uses the Rank function. In some cases you may want to change it to the RankDense or RowNumber functions instead. The options are:
- Rank: Assigns the same rank to duplicate values, and a gap is placed between the ranks. See Rank. Default.
- Rank Dense: Assigns the same rank to duplicate values, and there is no gap between ranks. See RankDense.
- Row Number: Ranks according to the highest row numbers. See RowNumber.
To change the ranking function:
-
From the control’s filter icon at the top right of the control, open the control’s FILTERS & CONTROLS panel.
-
From the filter’s More menu, select Ranking function.
The text next to the menu option shows the currently-used function. By default it is Rank.
-
Select the type of rank you want.
Tips for Top N
-
Maximize the chart so you can see the table fields as you apply filters.
-
Only apply the top N filter to the column that is being ranked.
For example, you want a bar chart showing the top ten product types. You put Product Type on the X-axis and Sum of Revenue on the Y-axis, then put the Top N filter on the Sum of Revenue column. This gives you the top 10 values of Sum of Revenue grouped by Product Type.
Otherwise, if you put Top N on the Product Type column the chart will sort the products alphabetically.
-
Sigma requires an aggregated column for Top N.
-
Top N applies only to columns of type text, number, or date.
-
For a text column, the top N is determined by alphanumeric sorting.