
HubSpot Campaign Analysis template
The HubSpot Campaign Analysis template visualizes HubSpot marketing data. It helps marketing professionals to perform core tasks of their job in the following manner:
- Quickly configure their HubSpot data
- Analyze and compare campaign data
- Build marketing campaigns directly within Sigma
- Download the new campaign and save it as a *.csv file
For an overview of the template, see this video:
System and user requirements
The ability to use the HubSpot Campaign Analysis template requires the following:
- Your organization must be connected to a data source containing relevant HubSpot data if you want to use your actual data. Otherwise, you can utilize the template with Sigma's sample data.
- You must be assigned an account type with the Can create, edit, and publish workbooks permission enabled.
- You must be the template owner or be granted Can use or Can edit template access.
Create a new workbook from the template
-
Open the Sigma Templates gallery page. Access it from one of the following:
- The left-side navigation panel on your Sigma home page
- The Sigma Home menu (
 ) at the top left corner of any workbook page.
-
On the left panel, click Templates.
-
Locate and click the HubSpot Campaign Analysis Template. The template opens as an exploration, along with a dialog that prompts you to swap in your own data.
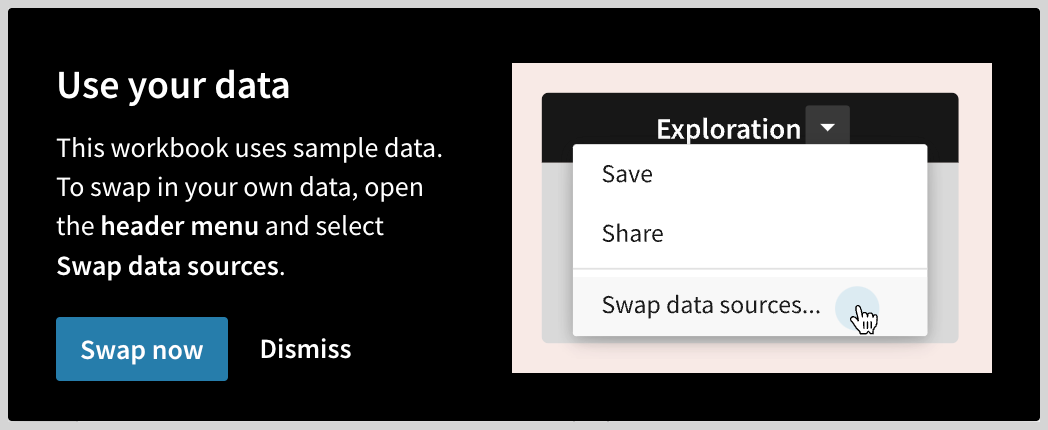
- To browse the workbook with sample data, click Dismiss.
- To replace this sample data with your own data, click Swap Now.
-
When you click Swap Now, Sigma opens the Swap Data Sources page.
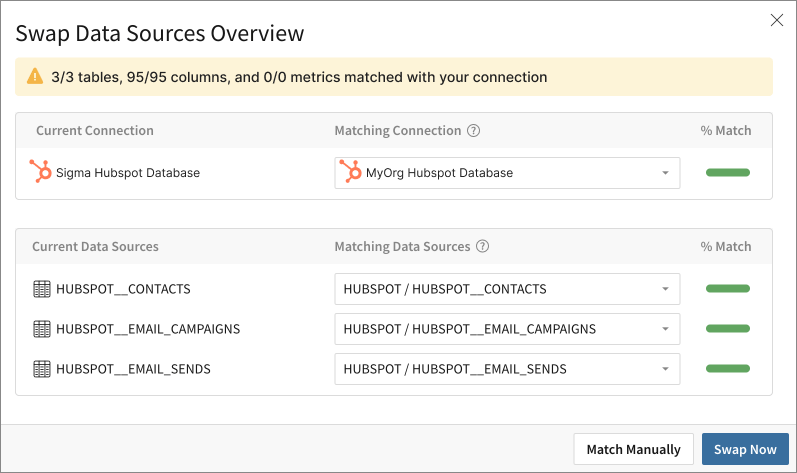
Sigma searches your connections for tables that match the structure of the current sources.
If it doesn't find a match, you can manually locate the correct table.
-
To replace a matched source, click Edit (
 ) next to the source, in the REPLACE WITH section.
You must have valid forms of these three tables:
- HUBSPOT_CONTACTS
- HUBSPOT_EMAIL_CAMPAIGNS
- HUBSPOT_EMAIL_SENDS
-
Select a new table from the modal.
-
After specifying the correct table to swap are specified, click Swap. The page refreshes, and displays your data.
-
Check the workbook to confirm that you have correct data.
-
To create a workbook that you can use, personalize, and publish for your organization, click Save As in the header, and save your new workbook.
About this template
We designed this template to support that workflows and analysis of Email Marketing Campaigns in your organization.
This template has the following pages: Email Campaign Analysis, Campaign Comparison, Build a Campaign, and Config & Docs.
Email Campaign Analysis
- Filters
- Email Send Timestamp: Date-time selector, with options for Between, On, Before, After, Last, Next, Current, and Custom options
- Email Campaign Type: All, Batch Email, Automated Email, Localtime Email, Ab Email, and Automated Ab Email options; has ascending/descending sort
- Email Campaign Sub Type: All, VIP, E-books, Webinars, Promotions, Newsletters, Field Events, Blogs, Conferences, Invitations; has ascending/descending sort
- KPIs
- Report overall numbers for Campaigns, Emails Sent, Contacts, and Unsubscribes
- KPIs with an interactive chart
- Overall Percentage and Percentage change over the Time period (which can be sampled) for Delivery Rate, Open Rate, CTR, and Unsubscribe Rate
- Campaign Insights
Subsection that provides insights on selected values, at the discretion of the user:
- Filters
- Time Bin: Select granularity options as Day, Week, Month, Quarter, or Year
- Line Value: Select from Open Rate, CTR, CTOR, or Unsubscribe Rate
- Set benchmarks
- Action covered in Config
- Combo chart 1
- Line chart of selected Line value over Time
- Bar chart of Total Deliveries, and Total Opens
- Horizontal line for the Benchmark, if set
- Combo chart 2
- A bar chart of Avg % of the selected Line value, by Campaign SubType
- Horizontal line for the Benchmark, if set
- Engagements
A subsection that analyses Engagements by Day of Week, and Hour of day, represented as a pivot table:
- Summary
- A report of the best and worst day for performance of the metric selected as the Pivot Value.
- Pivot Value
- Select the measurement from Delivery Rate, Open Rate, CTR%, CTOR%, or Unsubscribe Rate.
- Pivot table
- Aggregates the selected Pivot Value Weekday columns and Hour rows.
- Campaign Drill down
- A subsections that groups all campaigns by Campaign types, and also enables closer examination at the granularity of the individual campaign.
- This section reports on the measurement of Recipients, Deliveries, Opens, Unique Opens, Open Rate, Unsubscribes, CTR, CTOR, Unsubscribe Rate, Bounce, Rate, Total Clicks, Unique Clicks, Total Bounces, Delivery Rate, and Sent.
Campaign Comparison
You can conduct a robust A/B analysis of past and present campaigns to determine success factors for building better email campaigns in the future.
- Filters
- Email Send Timestamp: Date-time selector, with options for Between, On, Before, After, Last, Next, Current, and Custom options
- Email Campaign Type: All, Batch Email, Automated Email, Localtime Email, Ab Email, and Automated Ab Email options; has ascending/descending sort
- Email Campaign Sub Type: All, VIP, E-books, Webinars, Promotions, Newsletters, Field Events, Blogs, Conferences, Invitations; has ascending/descending sort
- Selection
- A subsection where you choose the campaigns for Group A and campaigns for Group B separately. Note that you can restrict the list of campaigns by using the filters on this page.
- Campaign selector
- Select the campaign to add to a grroup by clicking the checkbox next to the name of the campaign.
- Search the list of possible campaigns.
- Sort the list of possible campaigns in ascending/descending order
- Summary
- A general statement that characterizes the current choice of each campaign group in terms of campaign type and similar factors.
- Averages
- A report of metrics of each campaign grouping, including Average Emails Sent, Average Emails Delivered, Average Unique Emails Opened, Average Unique Email Clicks, Average Recipient Count, Average Delivery Rate, Average Bounce Rate, Average open Rate, Average CTR, Average CTOR, Average Unsubscribe Rate, and Campaign Count.
- Chart
- A bar chart for each Campaign group; provides a side-by side comparison of Sends, Deliveries, Opens, and Clicks across each of Group A Campaigns and Group B Campaigns.
- Comparison metric
- A section that lets you select a metric, and plots it for a quick visual analysis.
- Selector
- Select one of the metrics: Sent, Delivered, Opens, Clicks, Recipients, Delivery Rate, Open Rate, CTRO, or CTOR.
- Bar Chart
- Sorted from largest to smallest, all campaigns in both Group A and Group B. Each campaign group has its own color.
- Comparative analysis
- A section plots the selected X and Y metrics from both campaigns on a Magic Quadrant chart.
- Email Campaign Subtype
- Select from the following Options: All, VIP, E-books, Webinars, Promotions, Newsletters, Field Events, Blogs, Conferences, and Invitations.
- Search function
- Sort in ascending/descending order
- X axis
- Select the metric from these options: Sent, Deliveries, Opens, Unique Opens, Clicks, Unique Clicks, Bounces, Unsubscribes, Delivery Rate, Open Rate, CTR, CTOR, Unsubscribe Rate, and Recipient Count.
- Y axis
- Select the metric from these options: Sent, Deliveries, Opens, Unique Opens, Clicks, Unique Clicks, Bounces, Unsubscribes, Delivery Rate, Open Rate, CTR, CTOR, Unsubscribe Rate, and Recipient Count.
- Ensure that you don't use the same metric as on X, because it makes the chart meaningless.
- Chart
- A Magic Quadrant that plots the distribution of the selected campaigns as bolored bubbles that match the colors for Group A and Group B, and other campaigns as points.
- Campaign comparison data
- A table that combines all data for each selected campaign, grouped as Campaign A and Campaign B.
Build a Campaign
To quickly start you on your new campaign, the Build page offers the following guidance and selectors:
- Import Contacts
- Select email addresses for recipients based on your analysis of Campaign groups in the Campaign Comparison page.
- Choose Group A Campaigns, Group B Campaigns, Both, or Neither.
- To help you decide, the template reproduces the Comparison metric bar chart from the Campaign Comparison page.
- Build
- Section where you add contacts from your contacts data table.
- Companies
- Select from a list of Companies in your contacts table.
- Click the selection box next to the name of the company; note that each company lists the numer of contacts there; null indicates the number of contacts that don't have a current company assignment.
- Search for company name.
- Sort the companies in one of the following orders: Ascending by count of contacts, Descending by count of contacts, Ascending alpha-numeric, or Descending alpha-numeric.
- Top 15 Companies by Recipients is a bar chart that reports the CTR of the best companies, to help you make this selection.
- Job Titles
- Select from a list of Job Titles in your contacts table.
- Click the selection box next to the Job Title; note that each job title lists the numer of contacts with the same title. The null option indicates the number of contacts that don't list have a job title assignment. The All option selects all job titles.
- Search for company name.
- Sort the companies in one of the following orders: Ascending by count of contacts, Descending by count of contacts, Ascending alpha-numeric, or Descending alpha-numeric.
- Top 15 Companies by Recipients is a bar chart that reports the CTR of the job titles, to help you make this selection.
- Curate & Export
- This section helps you refine the list of participants in your new campaign.
These filters are optional:
- Who to include: Narrow the list of recipients in the following manner: Include All Contacts, Never. Opened or Clicked, Opened but Never Clicked, or Opened and Clicked.
- Days as Contacts: Select a day range, from 0 to 2,000.
- Company Annual Revenue: Specify the values for Minimum and Maximum revenue.
Config & Docs
Choose Configuration options; the preceding pages, especially Campaign Comparison, use either unique or all events, and aggregate results.
| Engagement events | Select either Unique or Total engagement events. |
| Total or average metrics | Choose either the Average or Total (sum) option. |
Specify Benchmarks; you can use them on the Email Campaign Analyses page to gage the success of your campaigns.
Each possble Line value has its own benchmark.
| Open Rate Benchmark % | Set the benchmark for this measurement, as a decimal value. For example, for an Open Rate of 35%, enter 0.35. |
| Unsubscribe Rate Benchmark % | Set the benchmark for this measurement, as a decimal value. For example, for an Unsubscribe Rate 0.5%, enter 0.005. |
| CTR Benchmark % | Set the benchmark for this measurement, as a decimal value. For example, for CTR of 1%, enter 0.01. |
| CTOR Benchmark % | Set the benchmark for this measurement, as a decimal value. For example, for CTOR of 5%, enter 0.05. |