PercentOfTotal
The PercentOfTotal function returns the percent of total for an aggregate formula. This function is shorthand for the calculation aggregate / Subtotal(aggregate, mode, parameters).
This function must be used with aggregated data in a grouped table. For a detailed video walkthrough that uses this function, see Building complex formulas with grouped data.
Syntax
Function arguments:
-
aggregate (required) - The aggregate formula to apply across the specified mode and parameters.
-
mode (optional) - The mode to use when calculating the aggregate formula. Mode determines which dimension(s) to use when performing the calculation.
-
General purpose modes
“grand_total”(default for visualizations and pivot tables) - Calculates the percent of grand total for the aggregate formula.
-
Visualization modes
-
“color”- Calculates the aggregate percent of total using only the column specified for COLOR. -
“x_axis”- Calculates the aggregate percent of total using only the column(s) placed on the X-AXIS. -
“trellis_column”/“trellis_row”- Calculates the aggregate percent of total using only the dimension specified for the TRELLIS COLUMN or TRELLIS ROW.
-
-
Pivot table modes
-
“column”/“row”- Calculates aggregate percent of total for the column or row total. -
“column_parent”/“row_parent”- Calculates the aggregate percent of total for the column or row total, relative to the subtotal calculation for the parent dimensions.
-
-
Table modes
“parent_grouping”(default for tables) - Calculates the aggregate formula using the grouping keys from a parent grouping. This is equivalent to creating the aggregate calculation in a parent grouping and referencing it from a column in a lower grouping.
-
-
parameters (optional) - Specifies how many parent dimensions to ignore. Only applicable if mode is one of the following:
"column_parent"/"row_parent""parent_grouping"
Notes
- The aggregate argument must be a full aggregate formula, including an aggregate function and its required arguments. It cannot be a reference to an existing aggregate.
- The parameters argument counts groupings from the current grouping up. For example, if the mode is set to
"parent_grouping"and the table has one grouping, setting parameters to2uses no grouping as the parent, performing the calculation for the entire table. Setting parameters to1uses use the parent grouping, performing the calculation for each group in the parent grouping.
Examples
- Calculates the percent of the total for the sum of Quantity across all groupings.
In this example, the table is grouped by Day of Date and filtered to show results from a single year, 2024. The % of Total for Sum of Quantity column shows the percent that each day represents of the total quantity sold in that year.
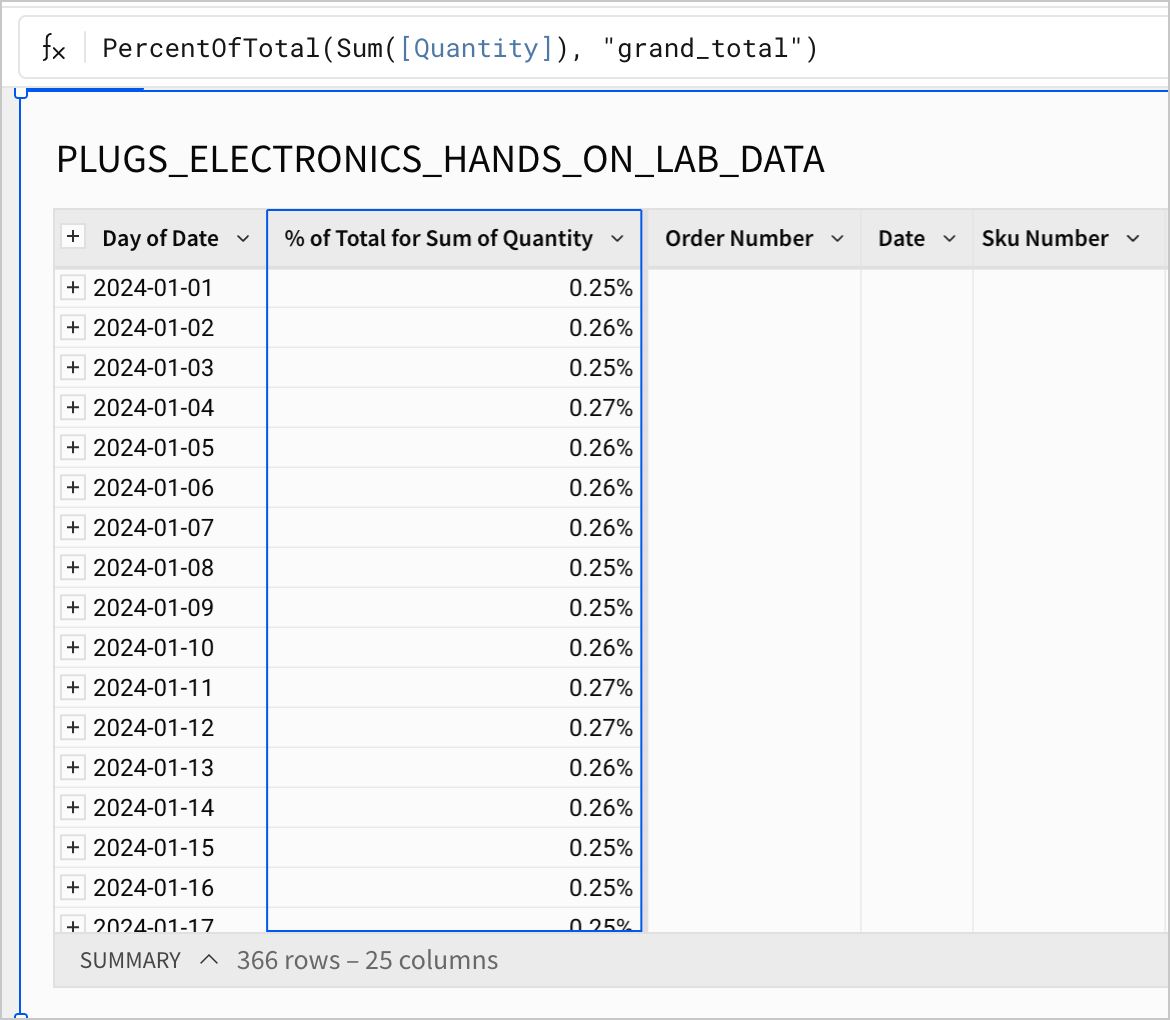
This is equivalent to taking the total quantity sold each day, and dividing it by the total quantity sold in the year, which returns the percent of total for each day.
- For each cell in the pivot table, calculates what percent of the row total that cell represents.
In this example, the pivot table shows Store Region in the columns and Product Type in the rows. The % Row Total column for each Store Region shows the percent of the total revenue for each Product Type that was sold in that Store Region. For example, 19.04% of revenue from Arts & Entertainment came from sales in the East Store Region.
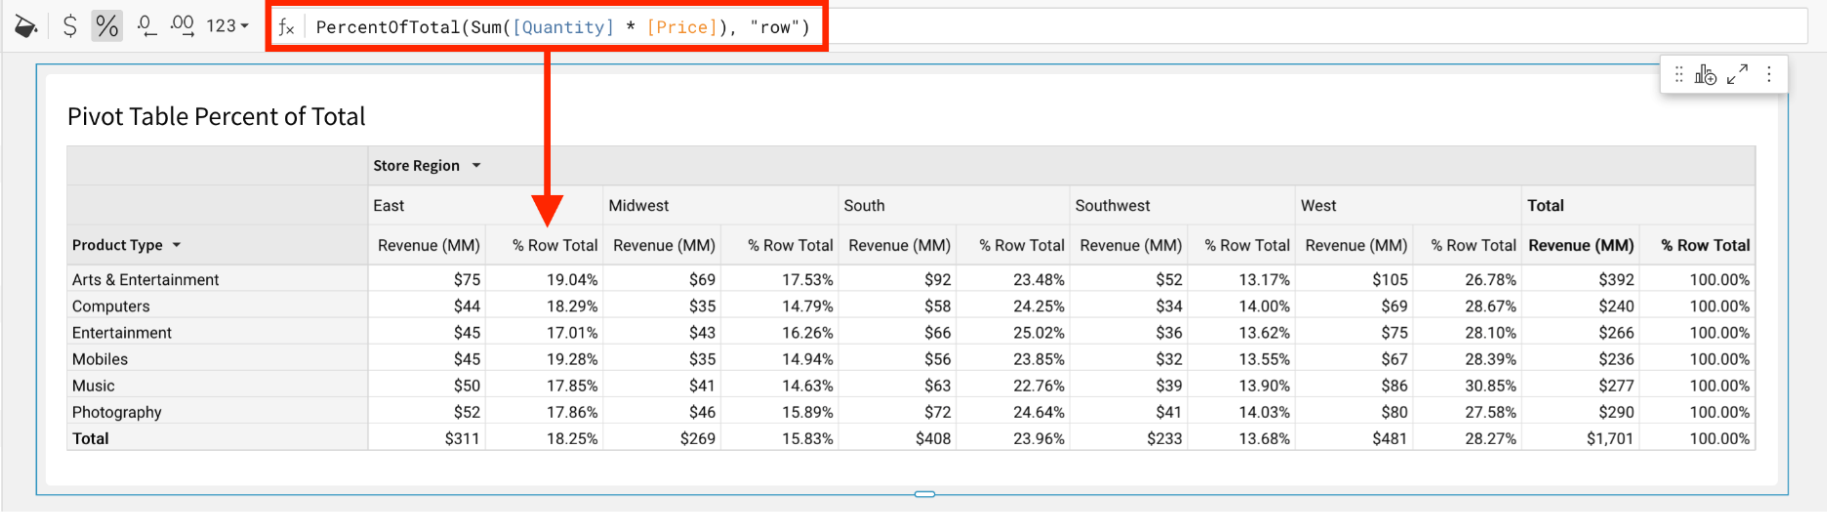
This is equivalent to taking the total revenue for each Product Type in each Store Region, and dividing it by the total revenue for that Product Type, which returns the percent of total revenue for that Product Type sold in that Store Region.
- For each bar in the chart, calculates what percent of the total that bar represents for the dimension on the x-axis.
In this example, the bar chart is broken out by Store Region along the x-axis, with each Product Type represented by a different color bar in each group. The % of Total note in the tooltip shows that 22.60% of Arts & Entertainment revenue came from the South.
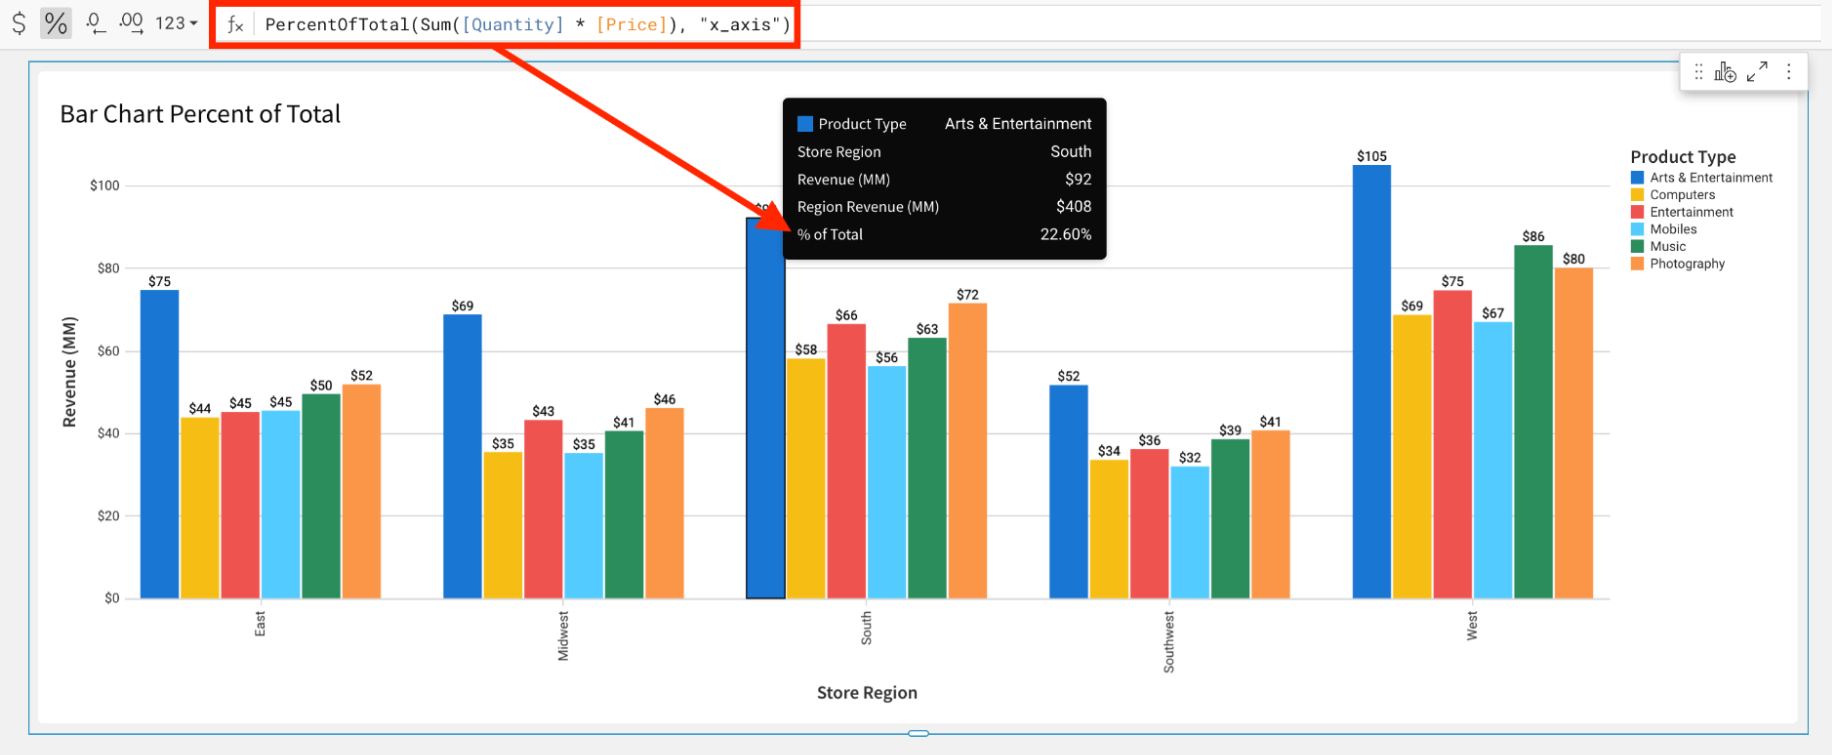
This is equivalent to taking the total revenue for a Product Type in a particular Store Region, and dividing it by the total revenue for that Product Type across all store regions.
- For each row in the table, calculates the percent of total for the sum of Quantity for the parent grouping specified by the parameters argument.
In this example, the columns Parameter 1 and Parameter 2 show the effect of changing the parameters argument. The table is grouped by Day of Date and Product Line.
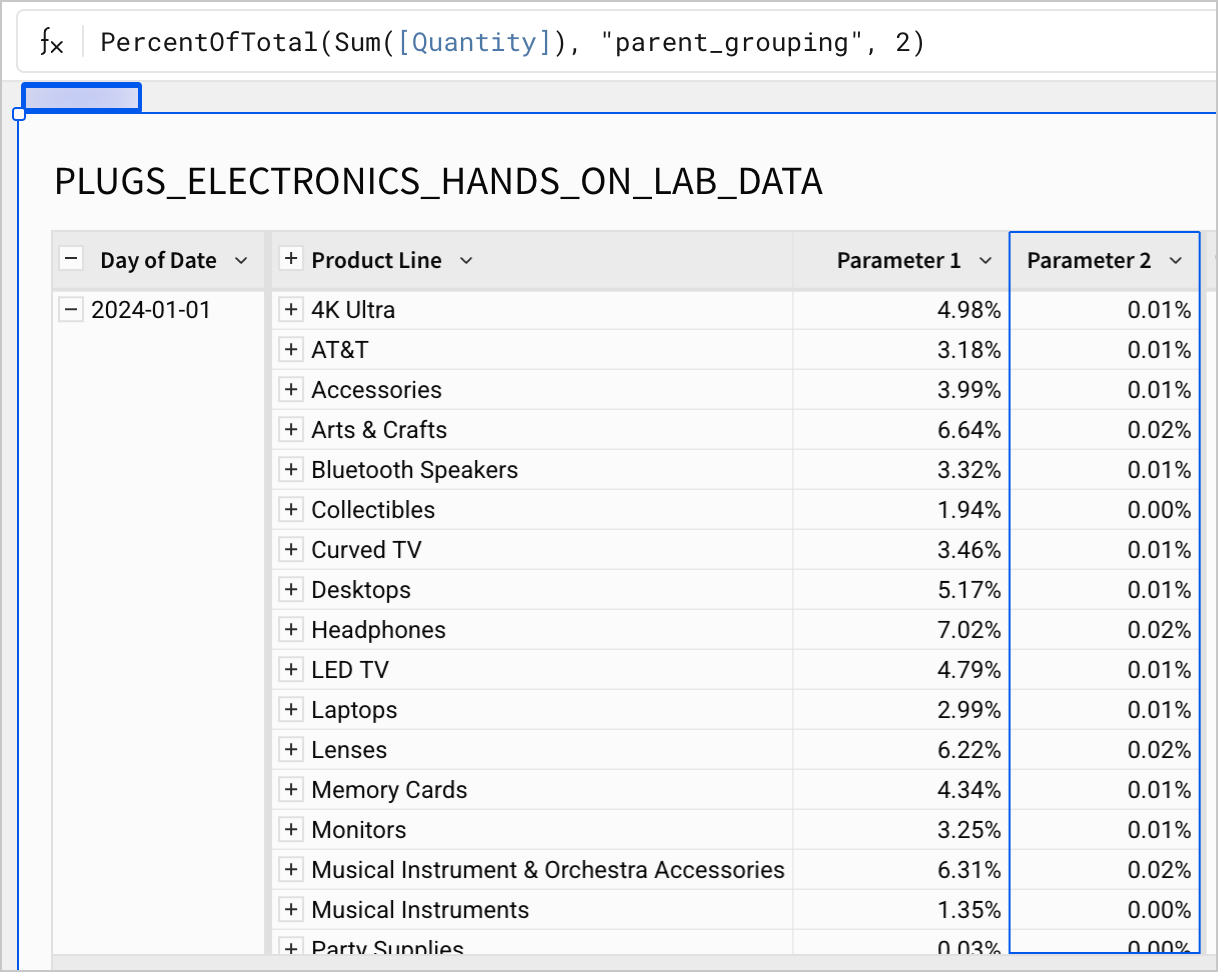
Parameter 1 uses the formula PercentOfTotal(Sum([Quantity]), "parent_grouping", 1) and returns the sales for each Product Line as a percent of the total sales for that day. For example, AT&T represented 3.18% of sales on Jan 1, 2024.
Parameter 2 uses the formula PercentOfTotal(Sum([Quantity]), "parent_grouping", 2) and returns the sales for each Product Line as a percent of the total sales for the entire table. For example, AT&T sales from Jan 1, 2024 represent 0.01% of total sales.