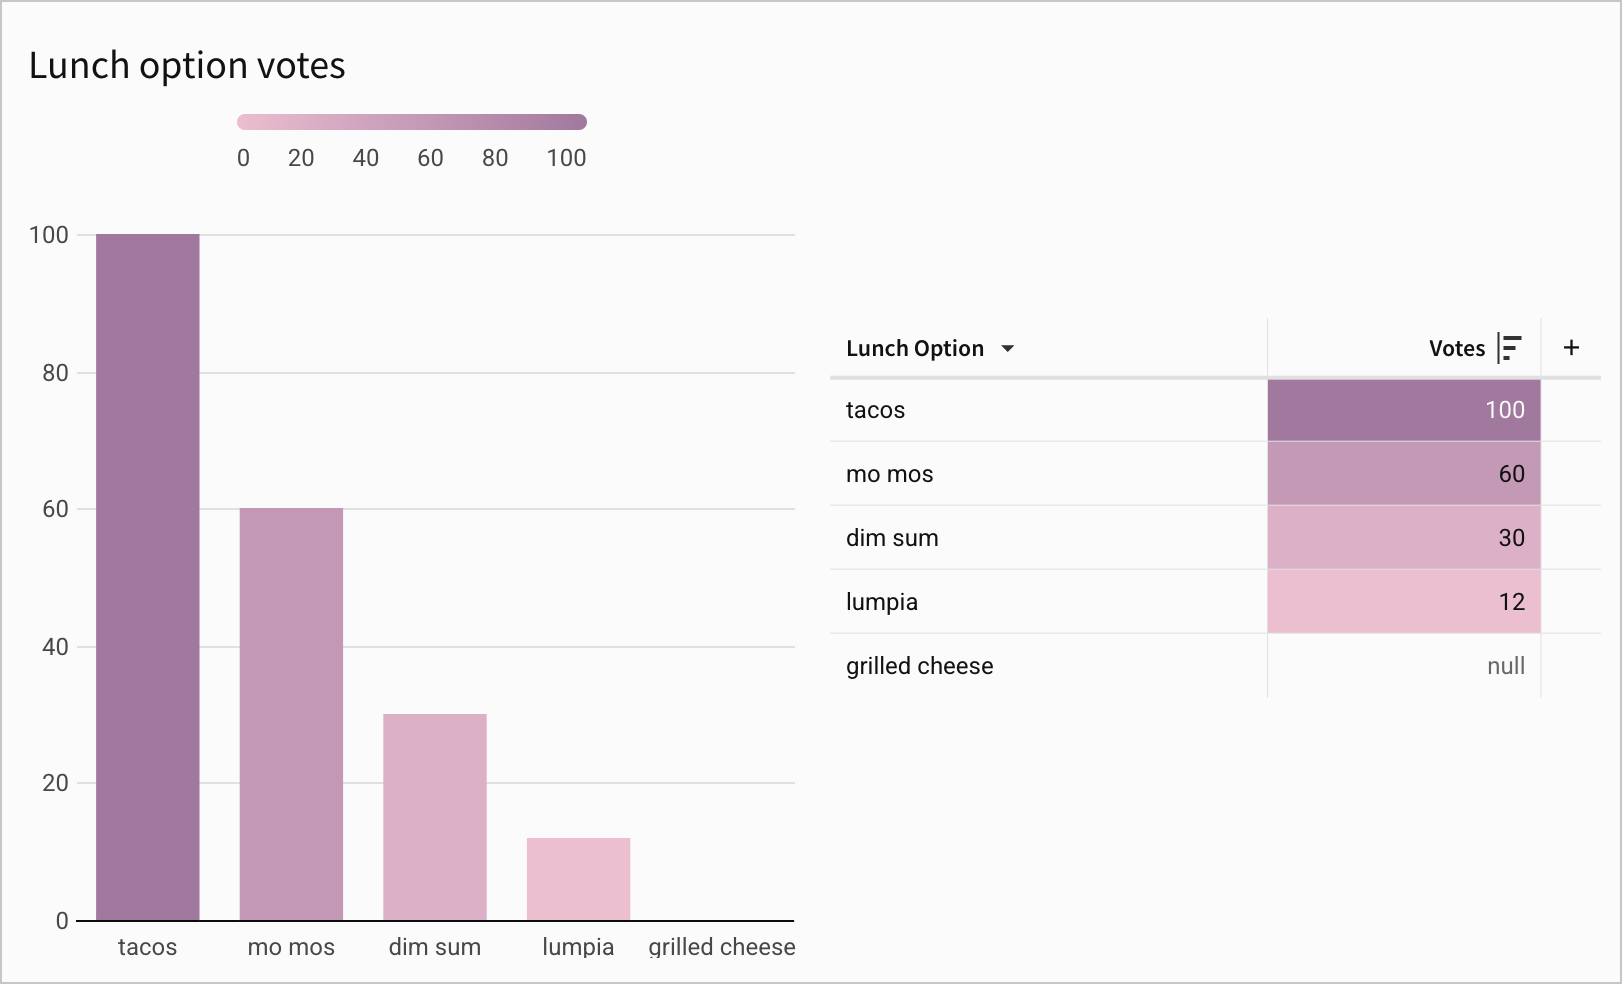
Add a custom color scale
When you format a chart, or conditionally format a table column, you can apply a single color or a color scale, among other options. Sigma includes several predefined color palettes, but you can also create your own:
You can add a color scale palette at the organization level as part of a theme, at the workbook level in the workbook settings, or at the element level for a specific data element. The following elements support color scales:
- Bar chart
- Funnel chart
- Gauge chart
- Geography map
- Scatter plot
- Tables, pivot tables, and input tables with conditional formatting.
User requirements
- To edit a chart, you must have Can edit or Can explore access to the individual workbook.
- You must be in Edit or Explore mode for the workbook. See workbook modes overview.
Choose a predefined color scale palette
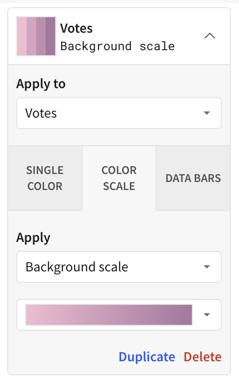
- Open the color options for the chart in the editor panel, or open conditional formatting options for a table and select Color scale.
- Select the dropdown menu for the color palette to review other color choices.
- Use the dropdown menu to choose between Sequential (default) or Diverging palettes.
- Select a palette.
- (Optional) To reverse the default colors, turn on the switch to Reverse color scale.
- (Optional) To customize the color at specific data values, turn on Customize domain, then specify a Minimum value, Middle value, and Maximum value in the data.
- (Optional) To use distinct colors instead of a gradient color scale, set Steps to a value between 1 and 5, depending on your data values. You can use this option with the color domain settings to more granularly define the color settings for specific data values. Set Steps to None to return to a gradient color scale.
- (Optional) For conditional formatting only, you can enable Format null values as zero to apply formatting to null values. The data value does not update but cells with null values reflect conditional formatting.
To create a custom color palette to use for sequential or diverging scales, see Set a custom color scale palette.
Set a custom color scale palette
To set a custom color scale palette for a data element or conditional formatting of table cells:
-
Open the color options for the chart in the editor panel, or open conditional formatting options for a table and select Color scale.
-
Select the dropdown menu for the color palette to review other color choices.
-
(Optional) Select a default palette.
-
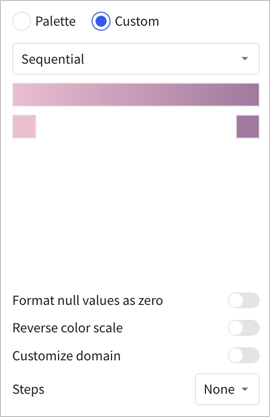
Select Custom to configure a custom color palette. The default colors match the default palette selected when you opened the custom option, or the default palette set in the selected workbook theme.
-
For each color that you want to customize, select the color block, then choose a new color by doing one of the following:
- Select one of the provided standard colors.
- Enter a hex code for the color.
- Use the eyedropper.
- Choose a color with the color picker.
-
(Optional) To reverse the colors, turn on Reverse color scale.
-
(Optional) To customize the color at specific data values, turn on the switch for Customize domain, then specify a Minimum value, Middle value, and Maximum value in the data.
-
(Optional) To use distinct colors instead of a gradient color scale, set Steps to a value between 1 and 5, depending on your data values. You can use this option with the color domain settings to more granularly define the color settings for specific data values. Set Steps to None to return to a gradient color scale.
-
(Optional) For conditional formatting only, you can enable Format null values as zero to apply formatting to null values. The data value does not update but cells with null values reflect conditional formatting.
To make a custom color scale available to other elements in the workbook, set a custom scale of sequential colors or diverging colors in the workbook settings. This sets a default custom color scale. You can override it on a specific element. After overriding a workbook-level or theme-level custom color scale, you can choose Revert to default to use the workbook-level or theme-level custom color scale again.