View column details
Sigma allows you to view column details for all column types except JSON. Column details provide automatically generated data distribution statistics, allowing you to assess the shape and quality of your data.
This document covers how to access column data, and explains the fields that are provided within the column details overview.
User requirements
- Users must have Can view access to a workbook or data model to see column details.
Access individual column details
To see details and statistics about an individual column:
- Click the down arrow (
 ) to open the column’s dropdown menu.
 - Select Column Details.
Specific column details vary depending on the column type, but the overall structure remains the same.
Review column summaries and statistics
Reviewing column data allows you to view key column values and data summaries.
Review basic column data
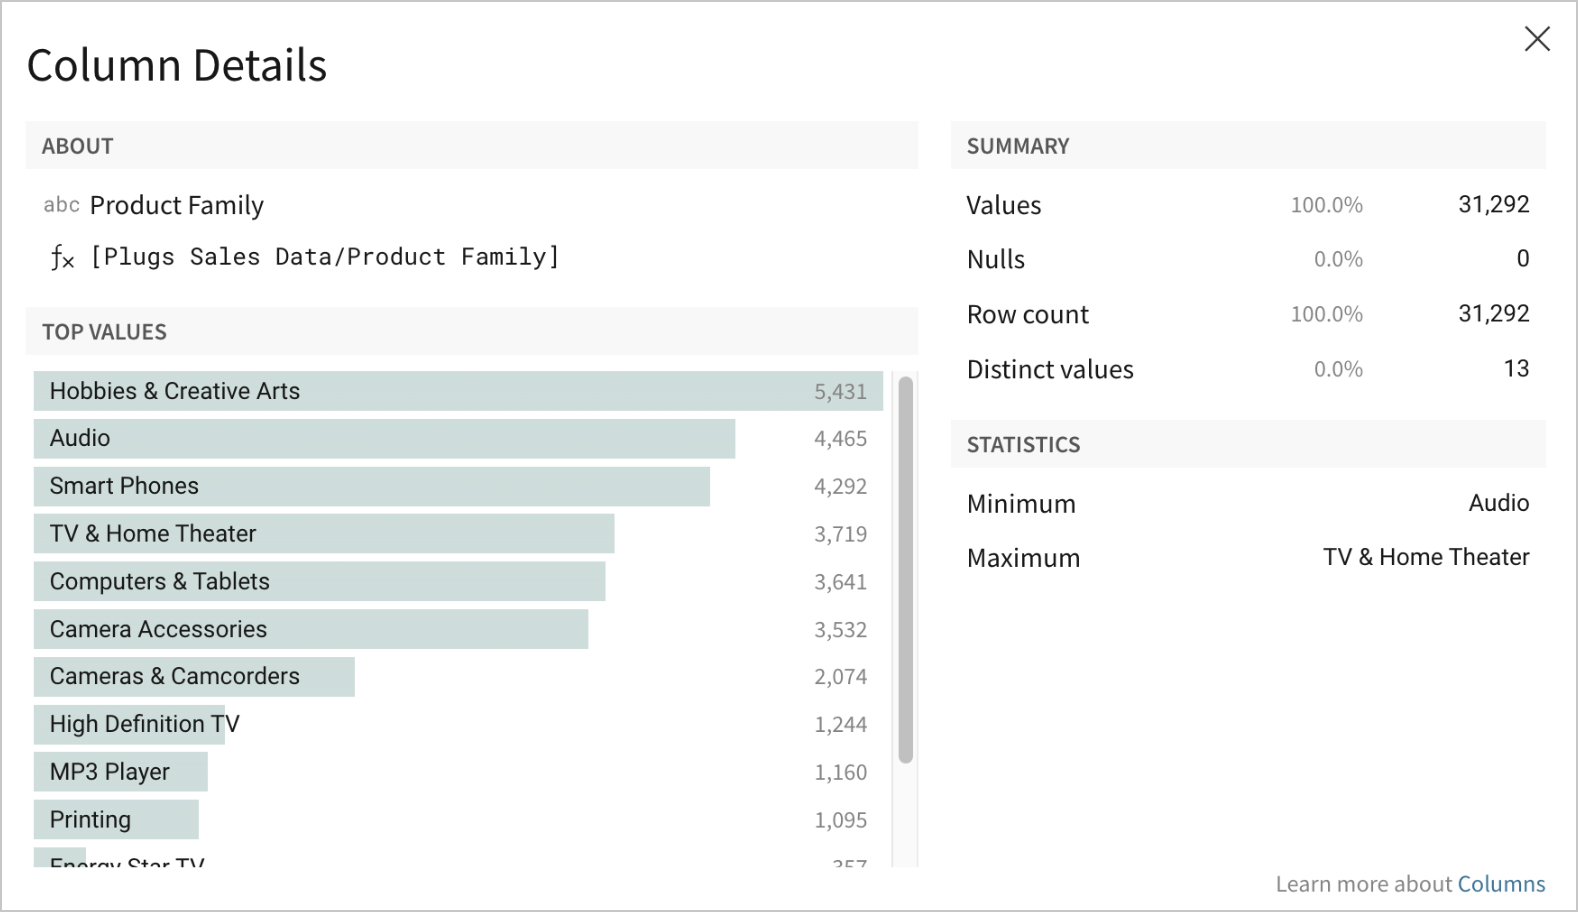
View information about the column data and how it was calculated in the About section, which lists type, name, and formula (fx).
Review column values
The Top Values section is useful for visualizing the data distribution. The Top Values list, available for text, number and date type columns, contains the column’s most common values, which can help identify trends or common characteristics.
A Value Distribution histogram is also available for number and date columns, which can be useful for identifying outliers and overall data shape for that column.
Review data summary
The Summary section lists key column totals like Values, Nulls, Row count and Distinct values, which can be useful for evaluating data quality and diversity.
Values and Nulls indicate the number of null and non-null values in the column, and can indicate dataset completeness or need for further data cleaning.
Row count and Distinct values can give a sense of the size and diversity of the data in that column.
Review data distribution summary
The Statistics section lists a variety of column statistics. Minimum and maximum values are displayed for date and text columns. These and other statistics, listed below, are available for number type columns:
- Minimum - The column’s minimum value. Depending on column type, this will be the lowest number, the oldest date, or the first text value when sorted alphabetically (see Min).
- 25th Percentile - The number of values in the bottom 25th percentile of the columns values (see PercentileCont).
- Median - The midpoint in a sorted list of column values (see Median).
- 75th Percentile - The number of values in the bottom 75th percentile of the columns values (see PercentileCont).
- Maximum - The column’s maximum value. Depending on column type, this will be the highest number, the newest date, or the last text value when sorted alphabetically (see Max).
- Average - The average of all column values (see Avg).
- Standard Deviation - The column’s computed standard deviation (see StdDev).
- Variance - The column’s statistical variance (see Variance).
These statistics may be helpful when performing further analysis into your data, by helping you understand the spread of data (25th Percentile and 75th Percentile), spot outliers (Minimum and Maximum), and evaluate data consistency (Variance and Standard Deviation).