Create and edit joins in data models and workbooks
Joins allow you to combine data from multiple tables based on matching information. Joining data can enrich your reporting and analysis, help you answer specific questions about your data, or make inconsistencies or missing data more apparent.
Sigma supports four logical join types - inner joins, left outer joins, right outer joins, and full outer joins. Each join type has a different way of handling matched and unmatched rows, and can be used for different types of analysis. For information on the different join types, see Types of joins.
This document covers:
- Considerations and limitations when creating joins in Sigma
- How to create and edit joins in workbooks and data models
- An example of using joins to create a daily customer revenue table.
For steps on how to create joins in datasets, see Join data in datasets. For information on whether using a join is the right method of combining data for you, see Choosing a method of combining data. To create unions, see Create and edit unions.
User requirements
- To create joins in a workbook: You must be the workbook owner or be granted Can explore or Can edit access to the workbook.
- To create joins in a data model: You must be the data model owner or be granted Can edit access to the data model.
Considerations and limitations
-
Tables cannot be joined across connections. For example, if you have an input table created on the Sigma sample connection, you will not be able to join this to a table on another connection. You must ensure the tables you want to join are available on the same connection.
-
Before creating a join, ensure that the data types of your intended join keys match. For example, you cannot create a join using a text column and a number column. Instead, you must use two text columns or two number columns.
-
You cannot initiate a union from the element menu on a direct CSV upload. If you want to create a join using the element menu on a CSV file, you first have to create a child element of the CSV table (select
 Create child element).
Create a join
Workbooks and data models both use the same join interface. You can access the join interface in multiple ways:
-
From the Add element bar:
- In a workbook: If you want to create a join on a table or pivot table, select Data > Table/Pivot Table > Join. If you want to use a join as a source for a chart, select Charts > your desired chart type > Join.
- In a data model: Select Data > Table > Join.
-
From element menu: From the table you want to create a join with, select
 More > Element source > Join.
If you are performing a join on a child element, using the element menu to create the join results in the parent table being used for the join. If you want to create the join on the child element itself, you should initiate the join using the Add element bar.
After navigating to the join interface, select your sources and configure your join:
-
In the Select source modal, configure the table you want to use as the left table in your join:
- Search for and select the table you want as the left table.
- Select the columns you want represented in your table. All columns are selected by default. A preview of the resulting table is shown.
- After you are done configuring your table, click Select.
Sigma keeps track of frequently used join sources from other users in your organization. If you select a source that is frequently used, Sigma suggests additional sources in the Select source modal and in Recommended sources in the join interface.
-
From the join interface, in Sources, select Add Source. In the Select source modal, select and configure the right table of your join.
-
After you have added your source, confirm that the left table name appears in the Join with dropdown, and the right table appears under Selected source. Edit your source selections if necessary.
-
In the Join type dropdown, select your desired join type. For more information on the different join types, see Types of joins.
-
Select or enter your desired Join keys. The keys must be of the same data type (e.g. text, number, date), or a type mismatch error occurs.
- To use one of the columns in your table table, select the column name from the dropdown.
- To use a formula as a join key, select + Add formula, then enter your formula in the formula bar. For example, you might want to truncate a date column using a formula.
Sigma suggests joins based on the column names and data types in your tables. For example, if two datasets share a column with similar characteristics (e.g., Customer ID appearing in both a sales table and a customer details table), Sigma suggests a join on that column.
-
Select your desired comparison operator from the dropdown between the join keys. The default operator is equal to (=), which checks that the join keys match exactly.
In addition to the equal to (=) operator, Sigma supports the following comparison operators:
- less than (<)
- less than or equal to (<=)
- greater than (>)
- greater than or equal to (>=)
- not equal to (!=)
- null-safe equal to (<=>)
- null-safe not equal to (<!=>)
The null-safe equal to (<=>) and null-safe not equal to (<!=>) operators are identical to the equal to (=) and not equal to (!=) operators, respectively, except for in the case of null values. The equal to (=) and not equal to (!=) operators return
Nullwhen either key is null, while null-safe equal to (<=>) and null-safe not equal to (<!=>) respect comparisons between null values.For example,
Null = NullreturnsNull, whileNull <=> NullreturnsTrue.Non-equi joins (joins using operators other than =) can be useful for scenarios where you need to filter for data in a specific range of values (e.g. before or after a certain date), or identifying duplicates in your data by checking equality.
-
If you want to add another join key, select + Add keys and repeat steps 5 and 6.
You can see the match rates for your join keys on the right, and a preview of what the joined table looks like under Join output.
The number of join key matches can provide information about the cardinality of your tables and what your output might look like:
-
Keys with no matches: If you are performing an inner join and see many keys with no matches, you might expect less rows in your data as unmatched rows are removed. If you are performing a left, right, or outer join, you might expect more nulls in your data due to the unmatched keys.
-
Keys with 2+ matches: If you see many keys with multiple matches, your tables have a one-to-many or many-to-many relationship. You might expect more rows in your final output, as rows might be duplicated.
-
-
Once you are done configuring your join keys, select Preview output to see the following:
- A diagram with your join relationship.
- A preview of the join output table. You can select the columns you want to display in your final output by selecting or unselecting the checkboxes next to the column names.
-
Select Done. Your new element appears on the workbook canvas. If you selected a Pivot table or Chart element, you might need to configure additional items for your output to show as desired. See Working with pivot tables and Intro to charts. A diagram of the join relationship is also be available to view in the lineage of your workbook.
Edit an existing join
To edit an existing join:
-
To choose which columns are displayed in the table created by the join, select
More, then Element source, then Edit join…. -
To change the table columns that are displayed in your join element, you can select or unselect the checkboxes next to the column names.
-
To edit your join keys, type, or right table, select any table in Sources that is not your left table. Configure your changes, then select Preview output.
-
Select Done.
Example: Showing daily revenue by customer
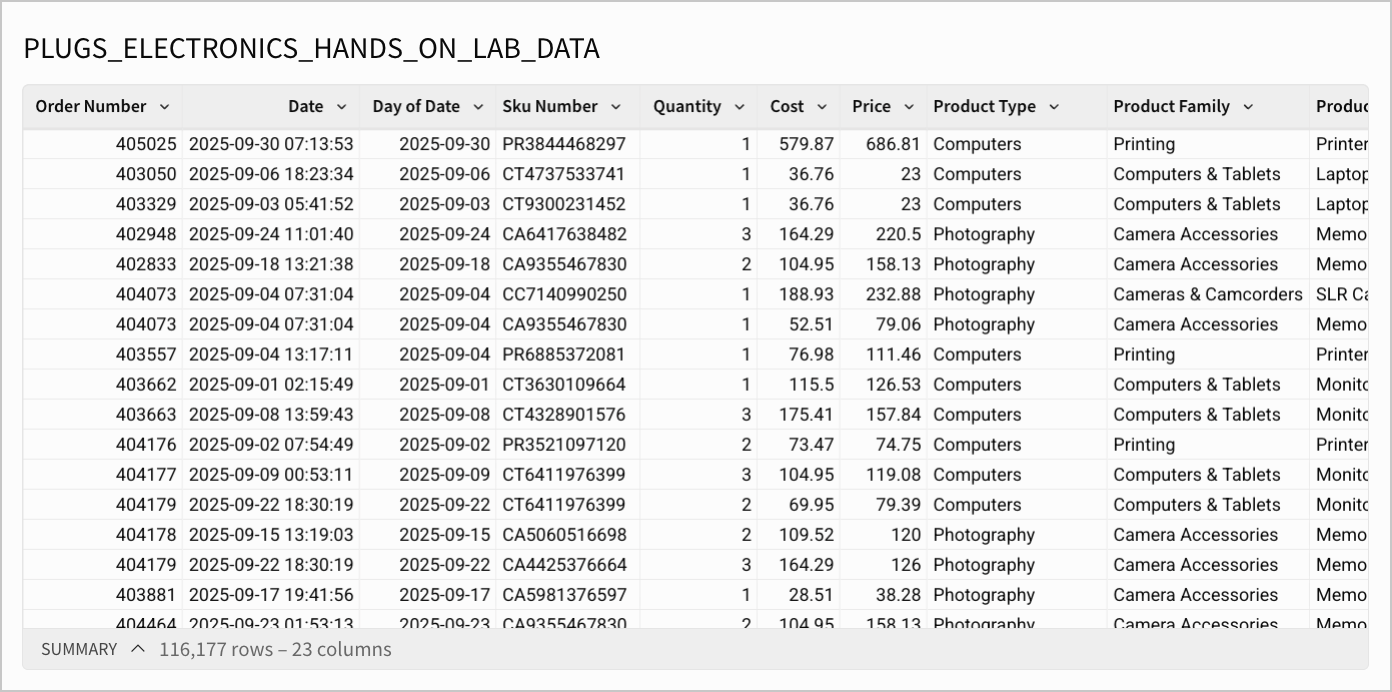
For example, you might have a table of customer transactions, like the PLUGS_ELECTRONICS_HANDS_ON_LAB_DATA data source. If you want to create a table that shows daily revenue for every customer in a specific month, even for days with no transactions, this can be accomplished by using joins.
An overview of the process is:
- Filter to the desired month and date unit
- Get all possible combinations of date and customer name
- Combine possible combinations with actual transactions
- Group and aggregate the joined data
Filter to the desired month and date unit
To get store transactions for the month of September 2025, at the day of date level, for the PLUGS_ELECTRONICS_HANDS_ON_LAB_DATA data source:
-
From the
PLUGS_ELECTRONICS_HANDS_ON_LAB_DATAtable, add a new column using the formulaDateTrunc("day", [Date]). This creates a new Day of Date column with a date granularity of day. -
Select
 Filters > + Add Filter…. Select the Day of Date column, then set your date range to be between September 1 2025 and September 30 2025.
Your table might look something like:
Get all possible combinations of date and customer name
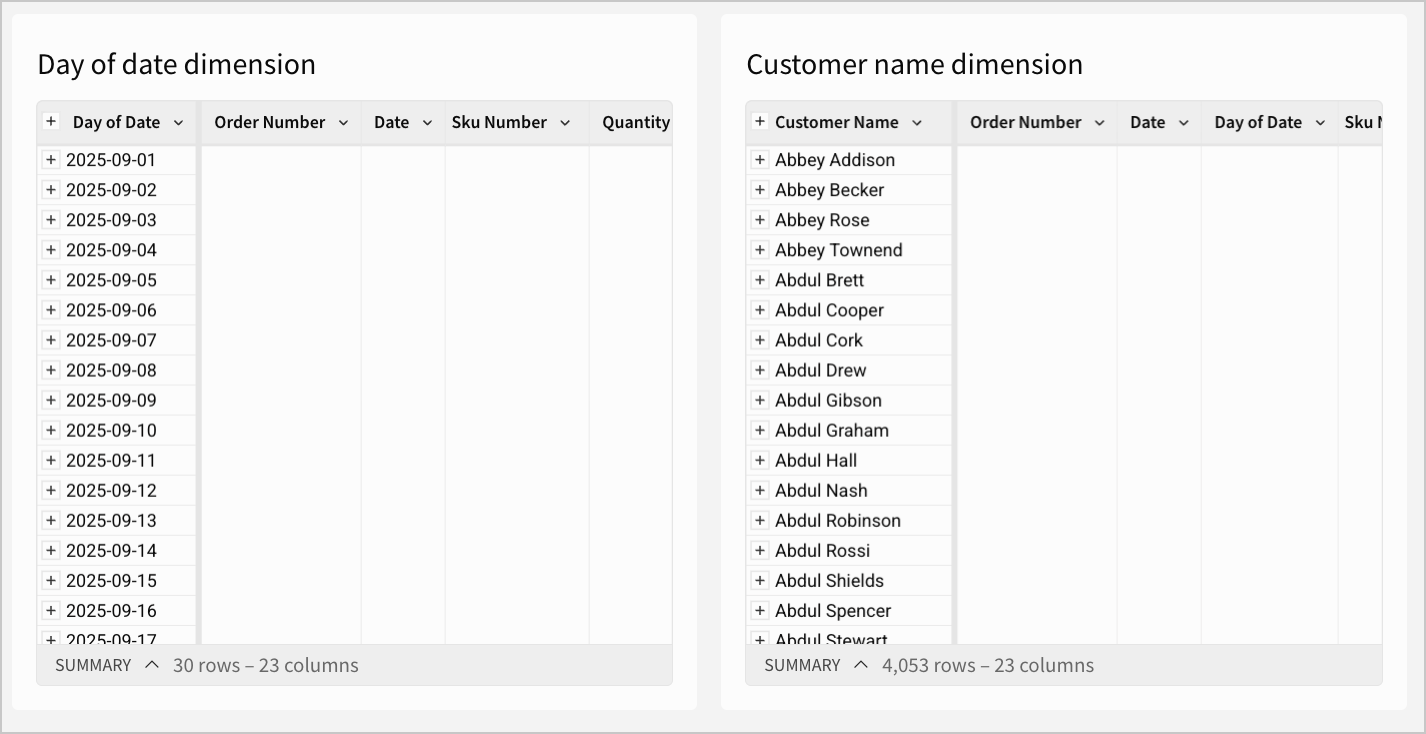
To get all possible combinations of date and customer name, you first want to isolate the date and customer dimensions:
-
From the filtered
PLUGS_ELECTRONICS_HANDS_ON_LAB_DATAtable, select Create child element, then select Table. -
Drag the Day of Date column under Groupings, then select - to collapse the grouping. Rename your table to “Day of date dimension”.
-
Repeat the steps, creating another child of
PLUGS_ELECTRONICS_HANDS_ON_LAB_DATA, but for the Customer Name column.
The two new tables might look something like:
To get all combinations of date and customer name, you can implement a cross join. Cross joins return a set of data with a number of rows equal to the product of the number of rows in your left and right join table. Every row from your left table is paired with a row in your right table, regardless of if there is a match in the data.
To create this join:
-
From the Add element bar, select Data > Table > Join.
-
In the Select source modal, search for and select the Day of date dimension table, then click Select. This is the left join table.
-
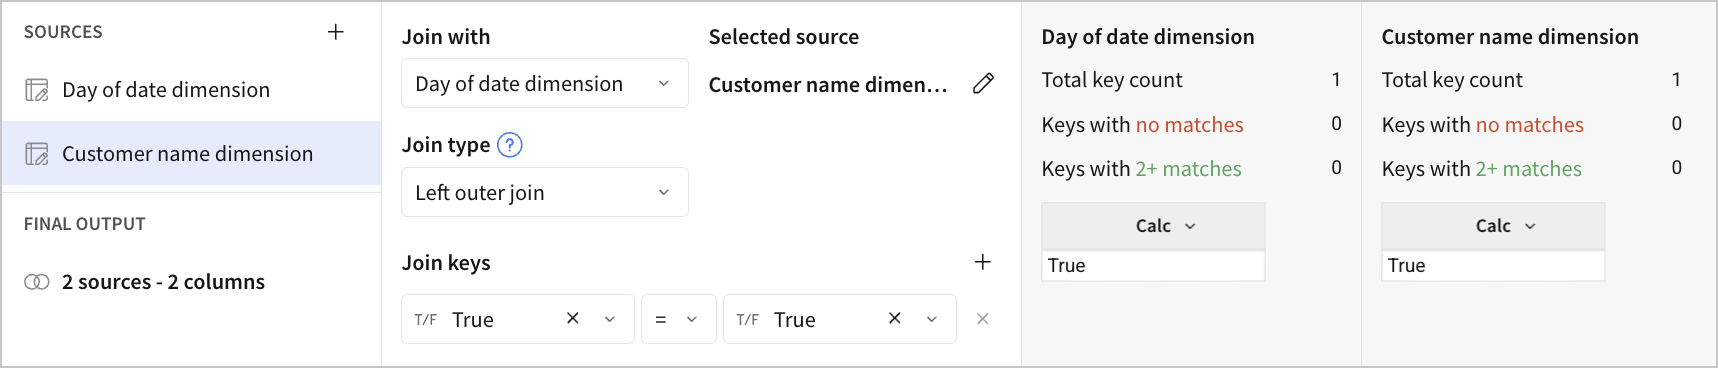
In the joins interface, select + Add source, then search for and select the Customer name dimension table. This will be the right join table.
-
Under Join keys, select the left dropdown, then select + Add formula. Enter
Truein the formula bar. Repeat this in the right dropdown.Using the
True = Truecondition as our join key causes every row in the left and right tables to be matched, because the condition is always true. For every possible combination of customer name and day of date, the condition True = True is evaluated and returns true, so all possible combinations are returned. Regardless of the join type we select here, the number of rows in our output will be the product of rows in the Day of date dimension table and Customer name dimension table.
-
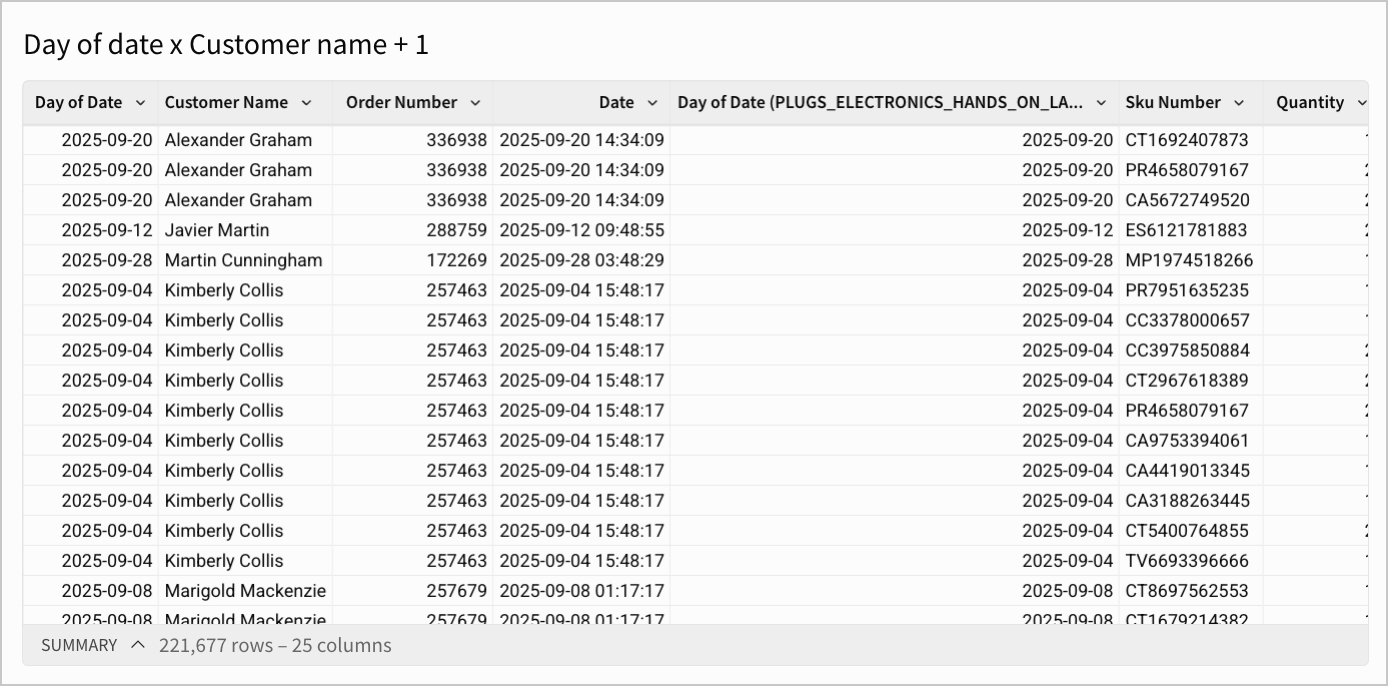
Select Preview output to see what your join output looks like. You can select the columns you want to display in your final output by selecting or unselecting the checkboxes next to the column names. Select Done.
-
A table with all possible combinations of customer name and day of date in September 2025 appears. Rename your table to “Day of date x Customer name”.
Combine possible combinations with actual transactions
Next, join this table with the PLUGS_ELECTRONICS_HANDS_ON_LAB_DATA table:
-
From the Add element bar, select Data > Table > Join.
-
Add the Day of date x Customer name as your left table, and
PLUGS_ELECTRONICS_HANDS_ON_LAB_DATAas the right table. -
Ensure the selected Join type is Left outer join. The left outer join type is used as we want to preserve all rows from our possible combinations table.
-
Add the following Join keys:
- Day of date = Day of date
- Customer name = Customer name
You need to join on both date and customer name to ensure that the transactions are matched correctly, as both date and customer name are required to uniquely identify a transaction.
For example, customers may make multiple transactions, so joining on only customer name would risk transactions being mixed across dates. This might result in data being duplicated, as every combination of customer name and date is generated.
Alternatively, if you only join on date, transactions may be mixed across customers as there can be multiple transactions per day. For example, customer A’s transactions on September 1st might be mixed with customer B’s transactions on September 1st.
Your table might look something like:
Group and aggregate the joined data
Add in the appropriate groupings and revenue calculation:
-
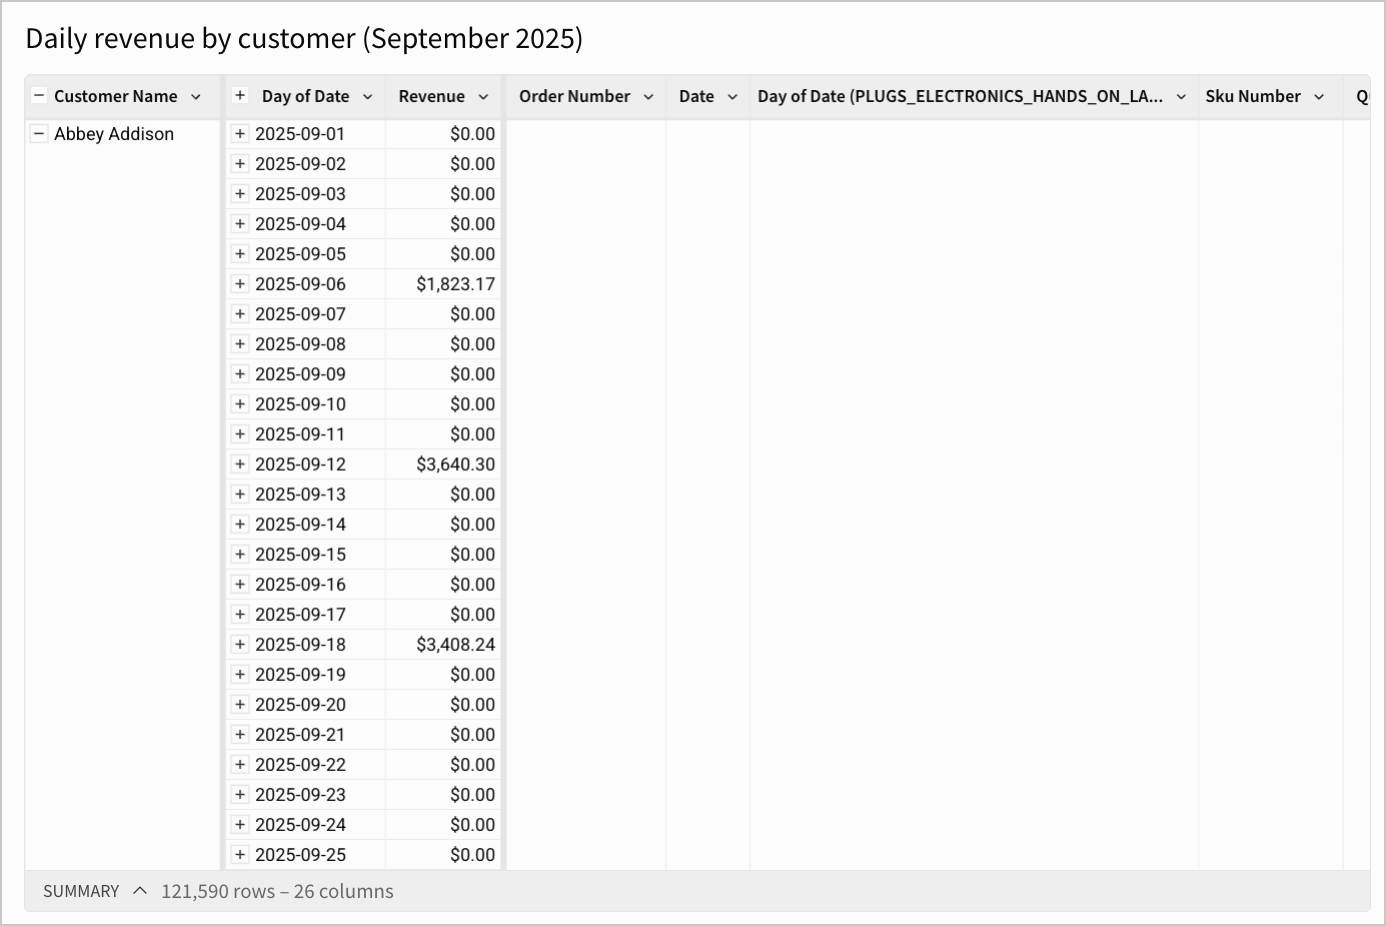
Rename the table you just created to “Daily revenue by customer (September 2025)”.
-
Select + Add grouping, then select Customer Name.
-
Select + Add grouping, then select Day of Date.
-
To calculate revenue, under the Day of Date grouping, select Add calculation…. Rename the new column to “Revenue”, and enter the formula:
Zn(Sum([Price] * [Quantity])).Using the Zn function adds zero values in place of nulls when there are no transactions on that day. Using Sum for the revenue formula of
[Price] * [Quantity]ensures that if there are multiple transactions from the same customer in a day, they are all captured. -
Select the down arrow (
 ) next to the Revenue column, then select Format > Currency.
 -
Collapse the Day of Date grouping.
Your table might look something like:
For another example on joining data using input tables, see Lesson Eight: Input tables and combining data in the Sigma Fundamentals for Builders tutorial. Additionally, see the Sigma blog post on advanced SQL joins techniques.