Lesson one: Basic organization and navigation
Lesson one: Basic organization and navigation
Welcome to lesson one: Basic organization and navigation.
Before we can build a dashboard, we’ll need to orient ourselves to Sigma’s layout, file structure, and workflow.
This lesson will teach you about workbooks, connecting to data, and the various ways users can view data. At the end of this lesson, you’ll have created a workbook with a table of data. You’ll use this workbook throughout the tutorial.
Navigation and layout
When you first log in to Sigma, the default home page looks something like the screenshot below. This home page can be customized by administrators, so yours might look different. By default, recent files are displayed in the center for ease of access.
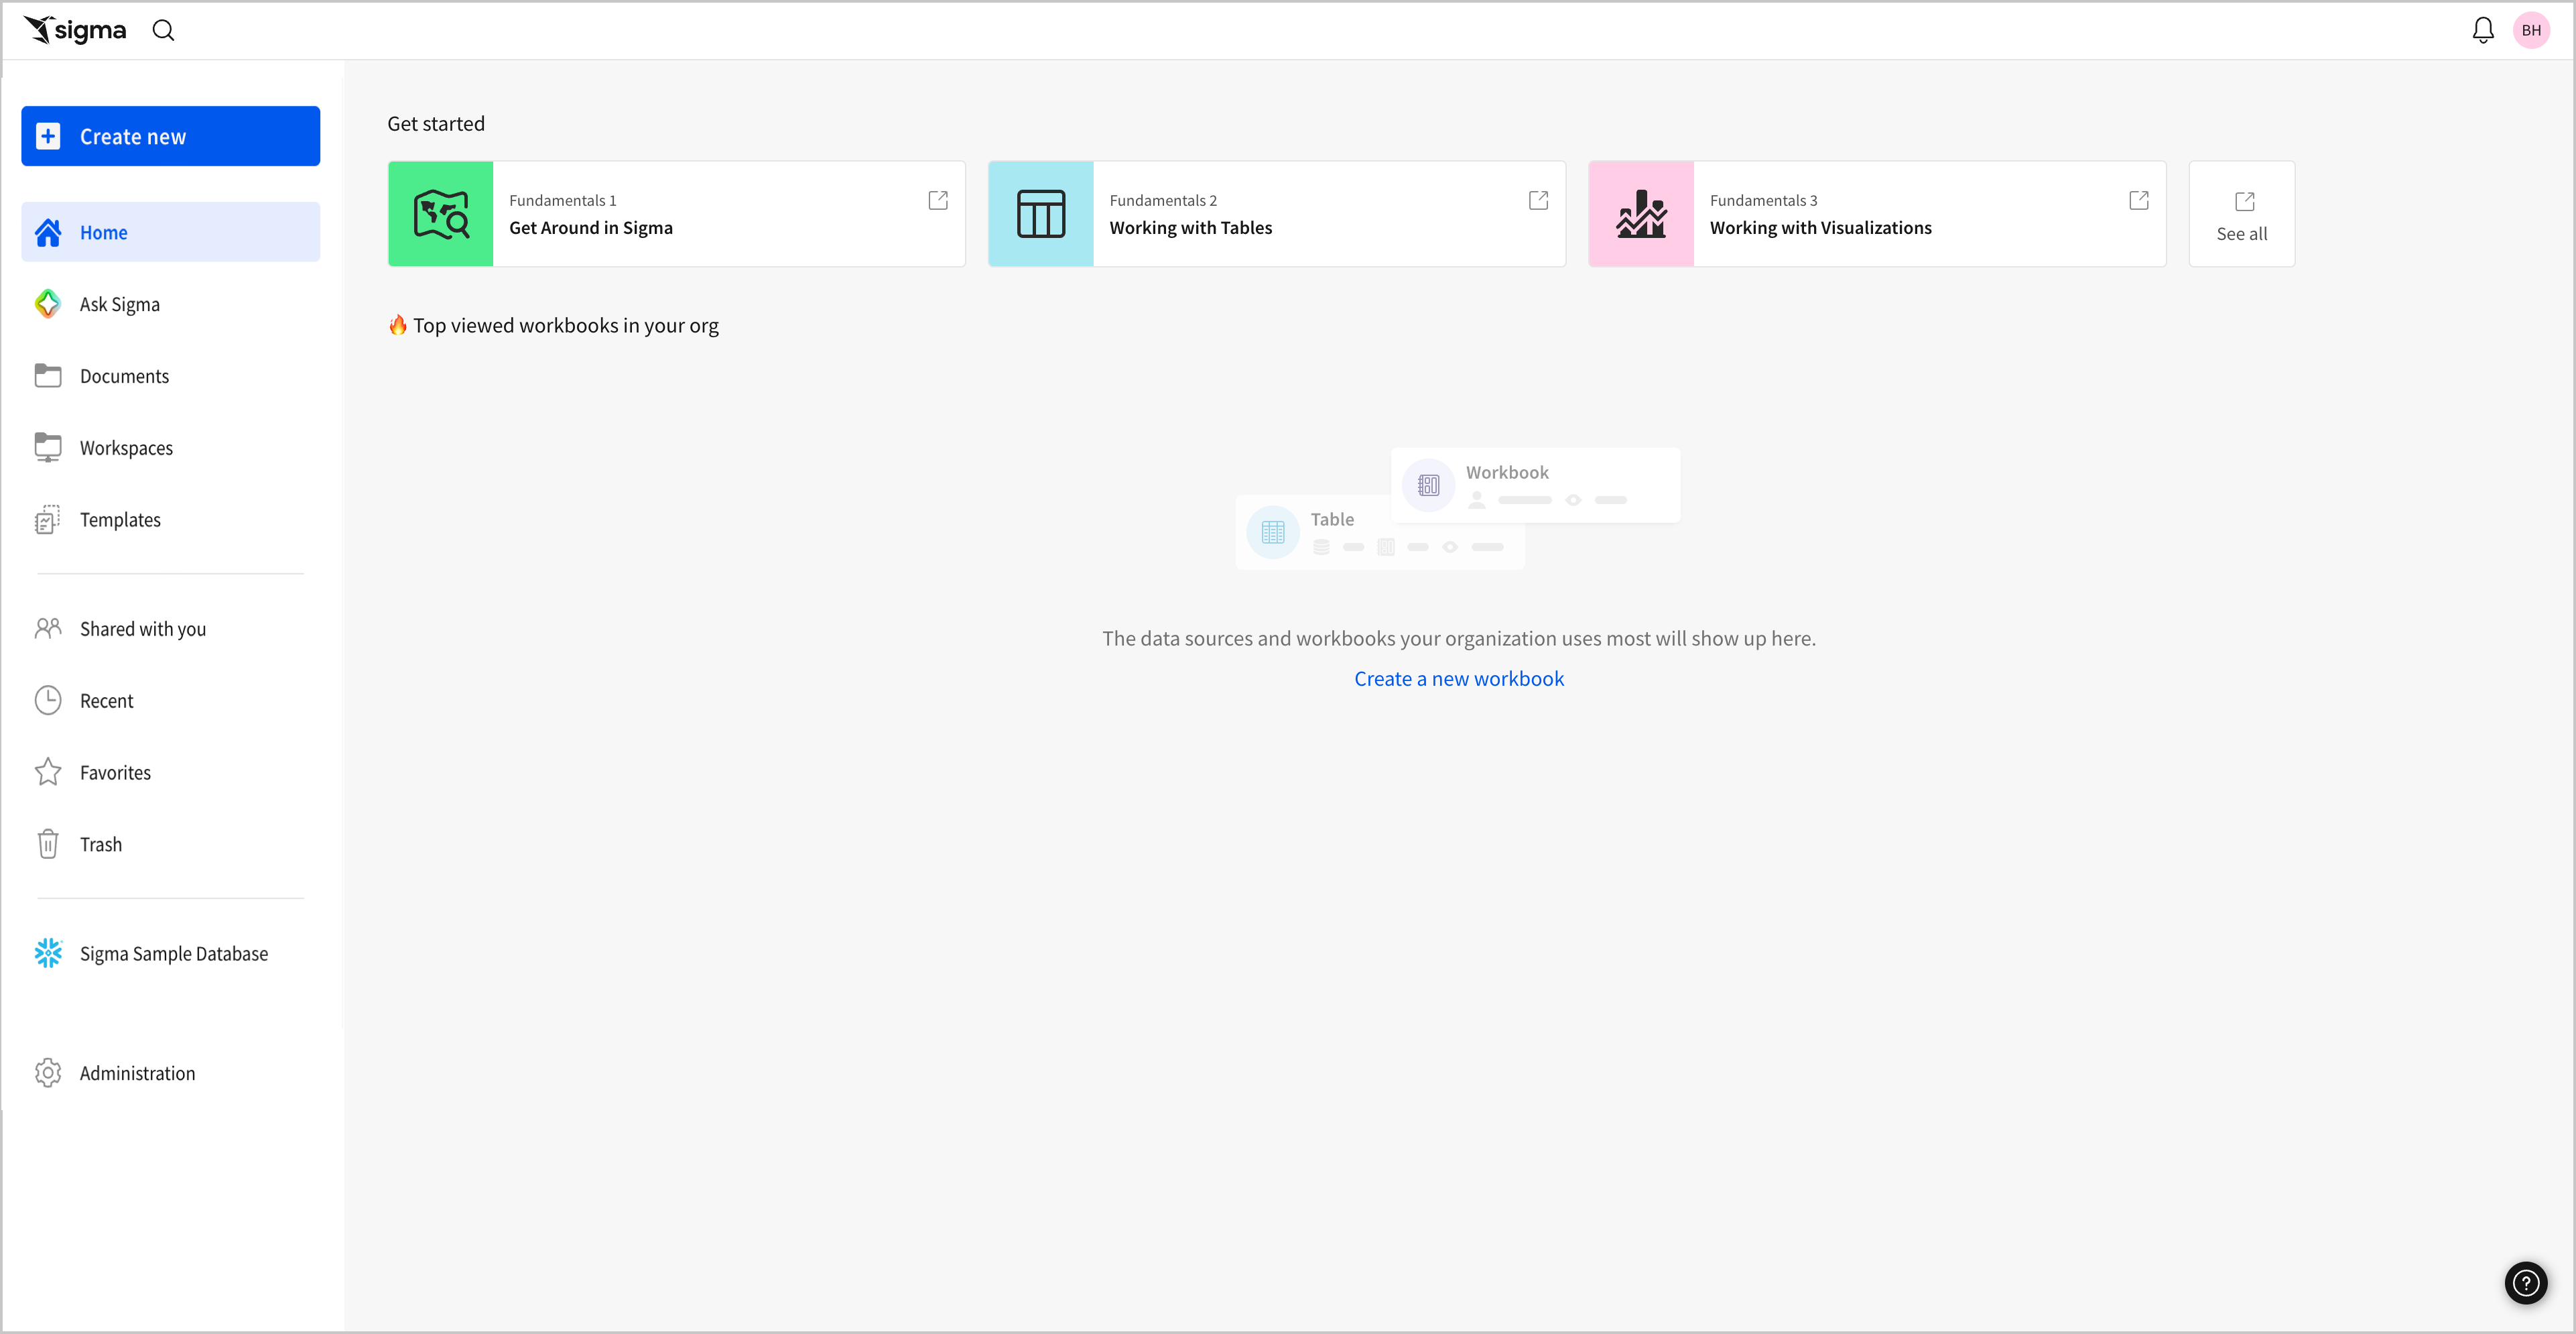
On the left-hand side, the navigation menu allows you to navigate files in Sigma. Documents shows you folders, workbooks, and other files you’ve created, while Workspaces and Templates provide options for sharing with collaborators. Below that, Shared with you, Favorites, Recents, and Trash offer specific views into files in your organization.
Most work in Sigma is done in workbooks, a document that you and other users in your organization can create, edit, favorite, and templatize to collaborate and share data.
In the top-right corner, you can access Notifications and the user menu. When selected, the user menu gives you a few basic options.
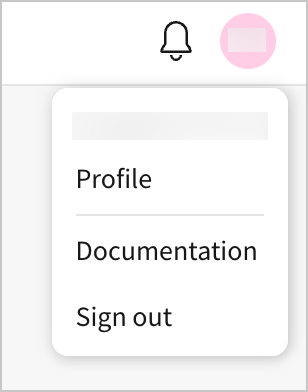
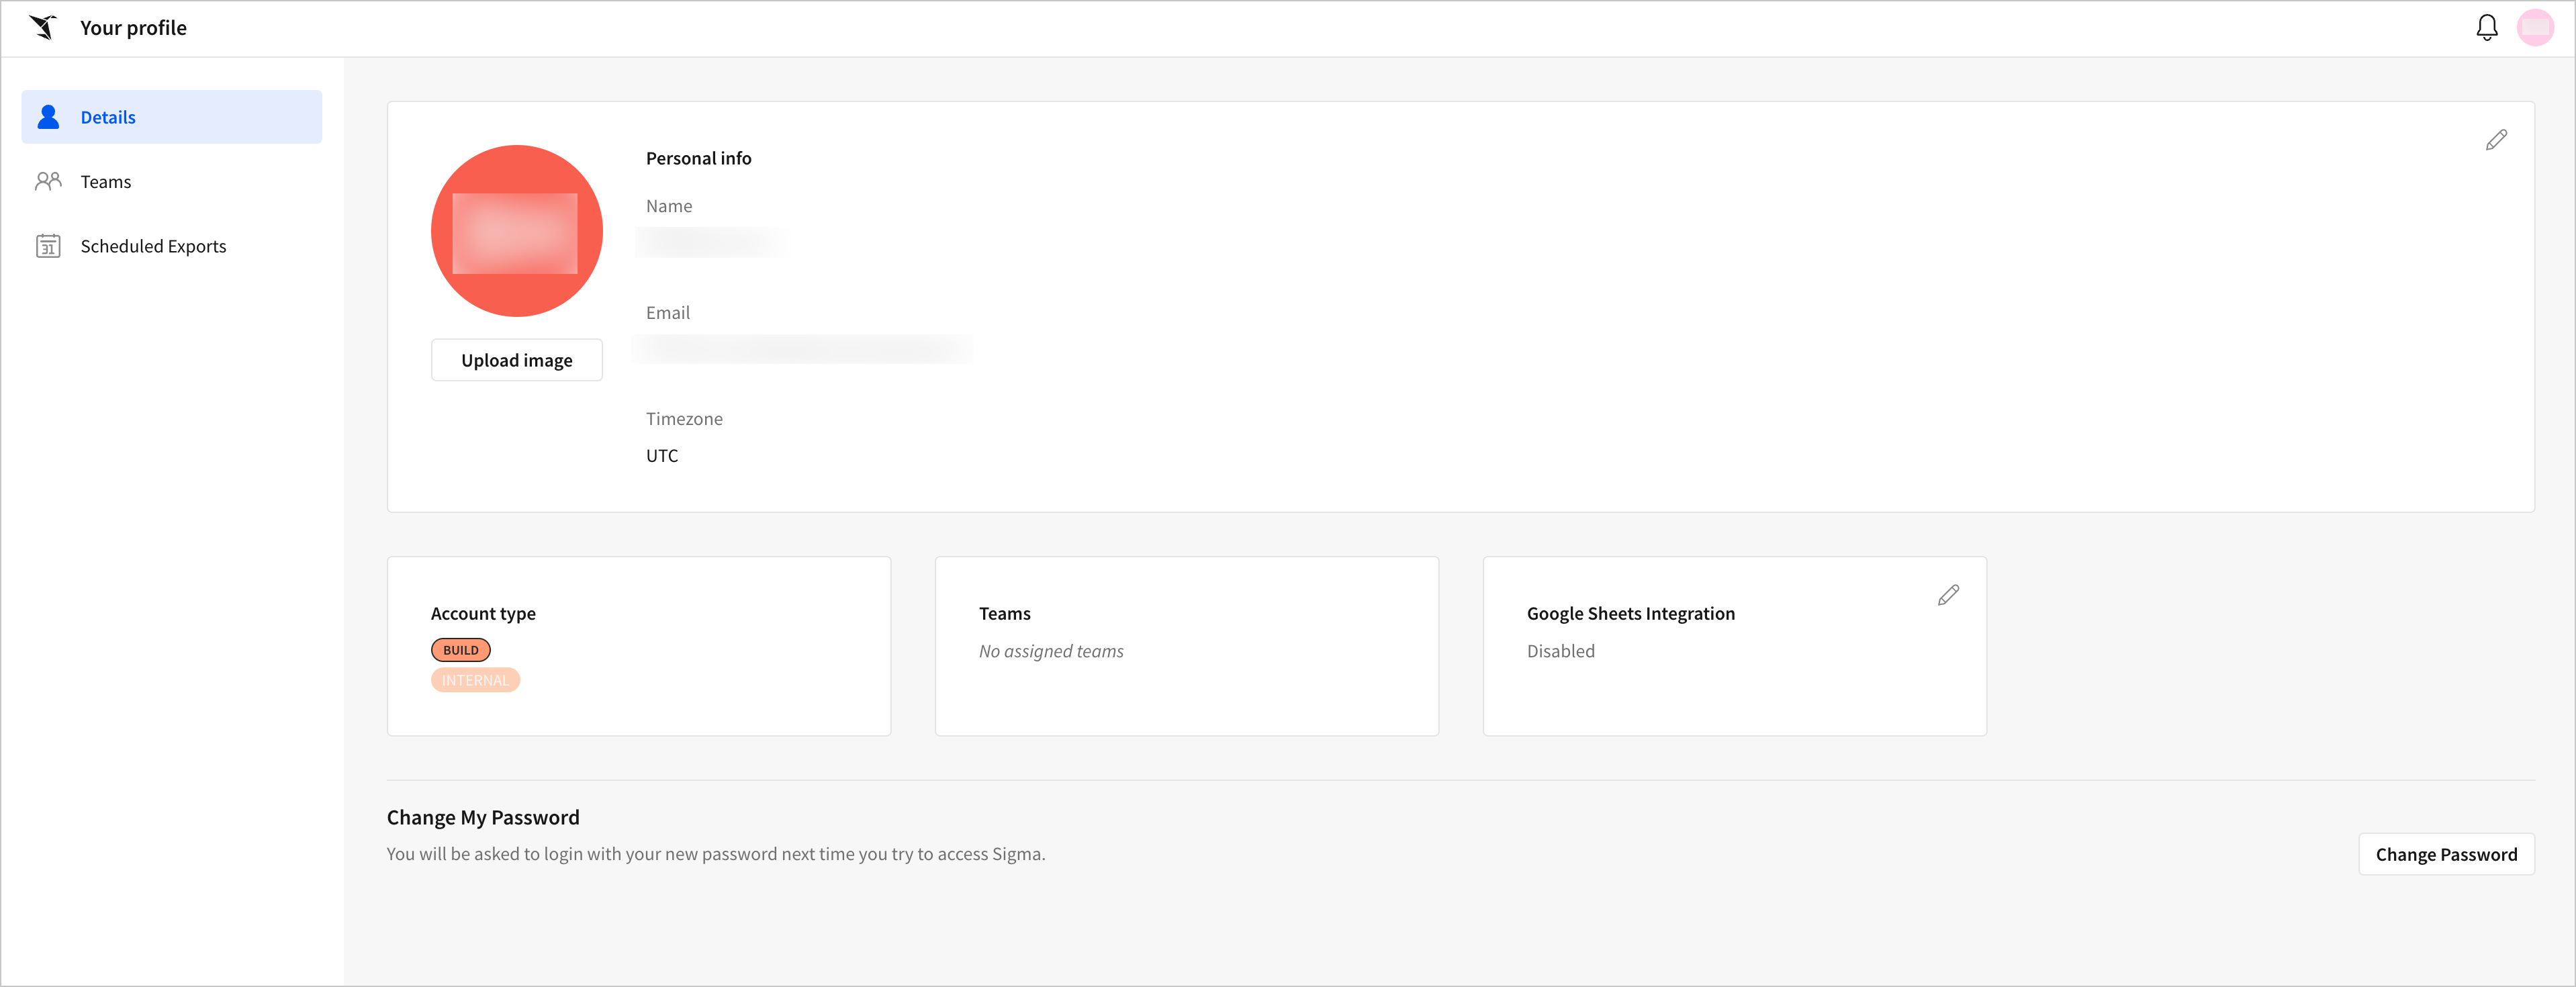
By selecting Profile, you can manage personal information like setting a profile photo, viewing your account type, seeing teams you’re a member of, and reviewing scheduled exports for your account.
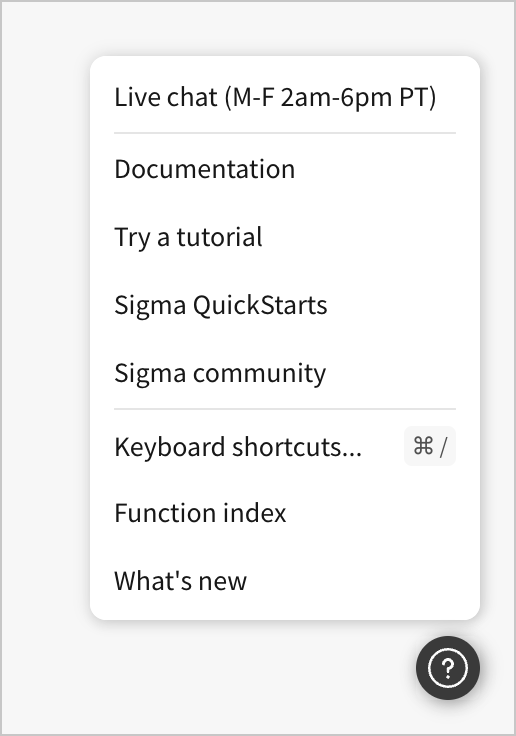
Return to the home screen. In the bottom-right corner open the ![]() Help menu. This menu provides a range of resources, including Documentation, Sigma community content, and Live chat support.
Help menu. This menu provides a range of resources, including Documentation, Sigma community content, and Live chat support.
At this point, we’ve scanned the page and oriented ourselves to some of the available options, but remember that the focus of this course is on building content in Sigma. Let’s take our first step in building a dashboard by creating a workbook.
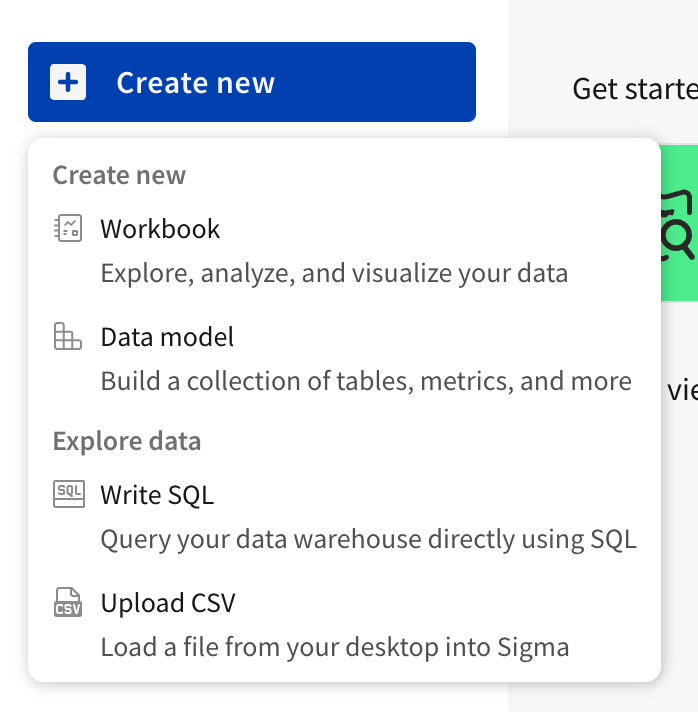
- Above the navigation menu, select Create new > Workbook.
This opens a blank workbook.
Workbooks, pages, and elements
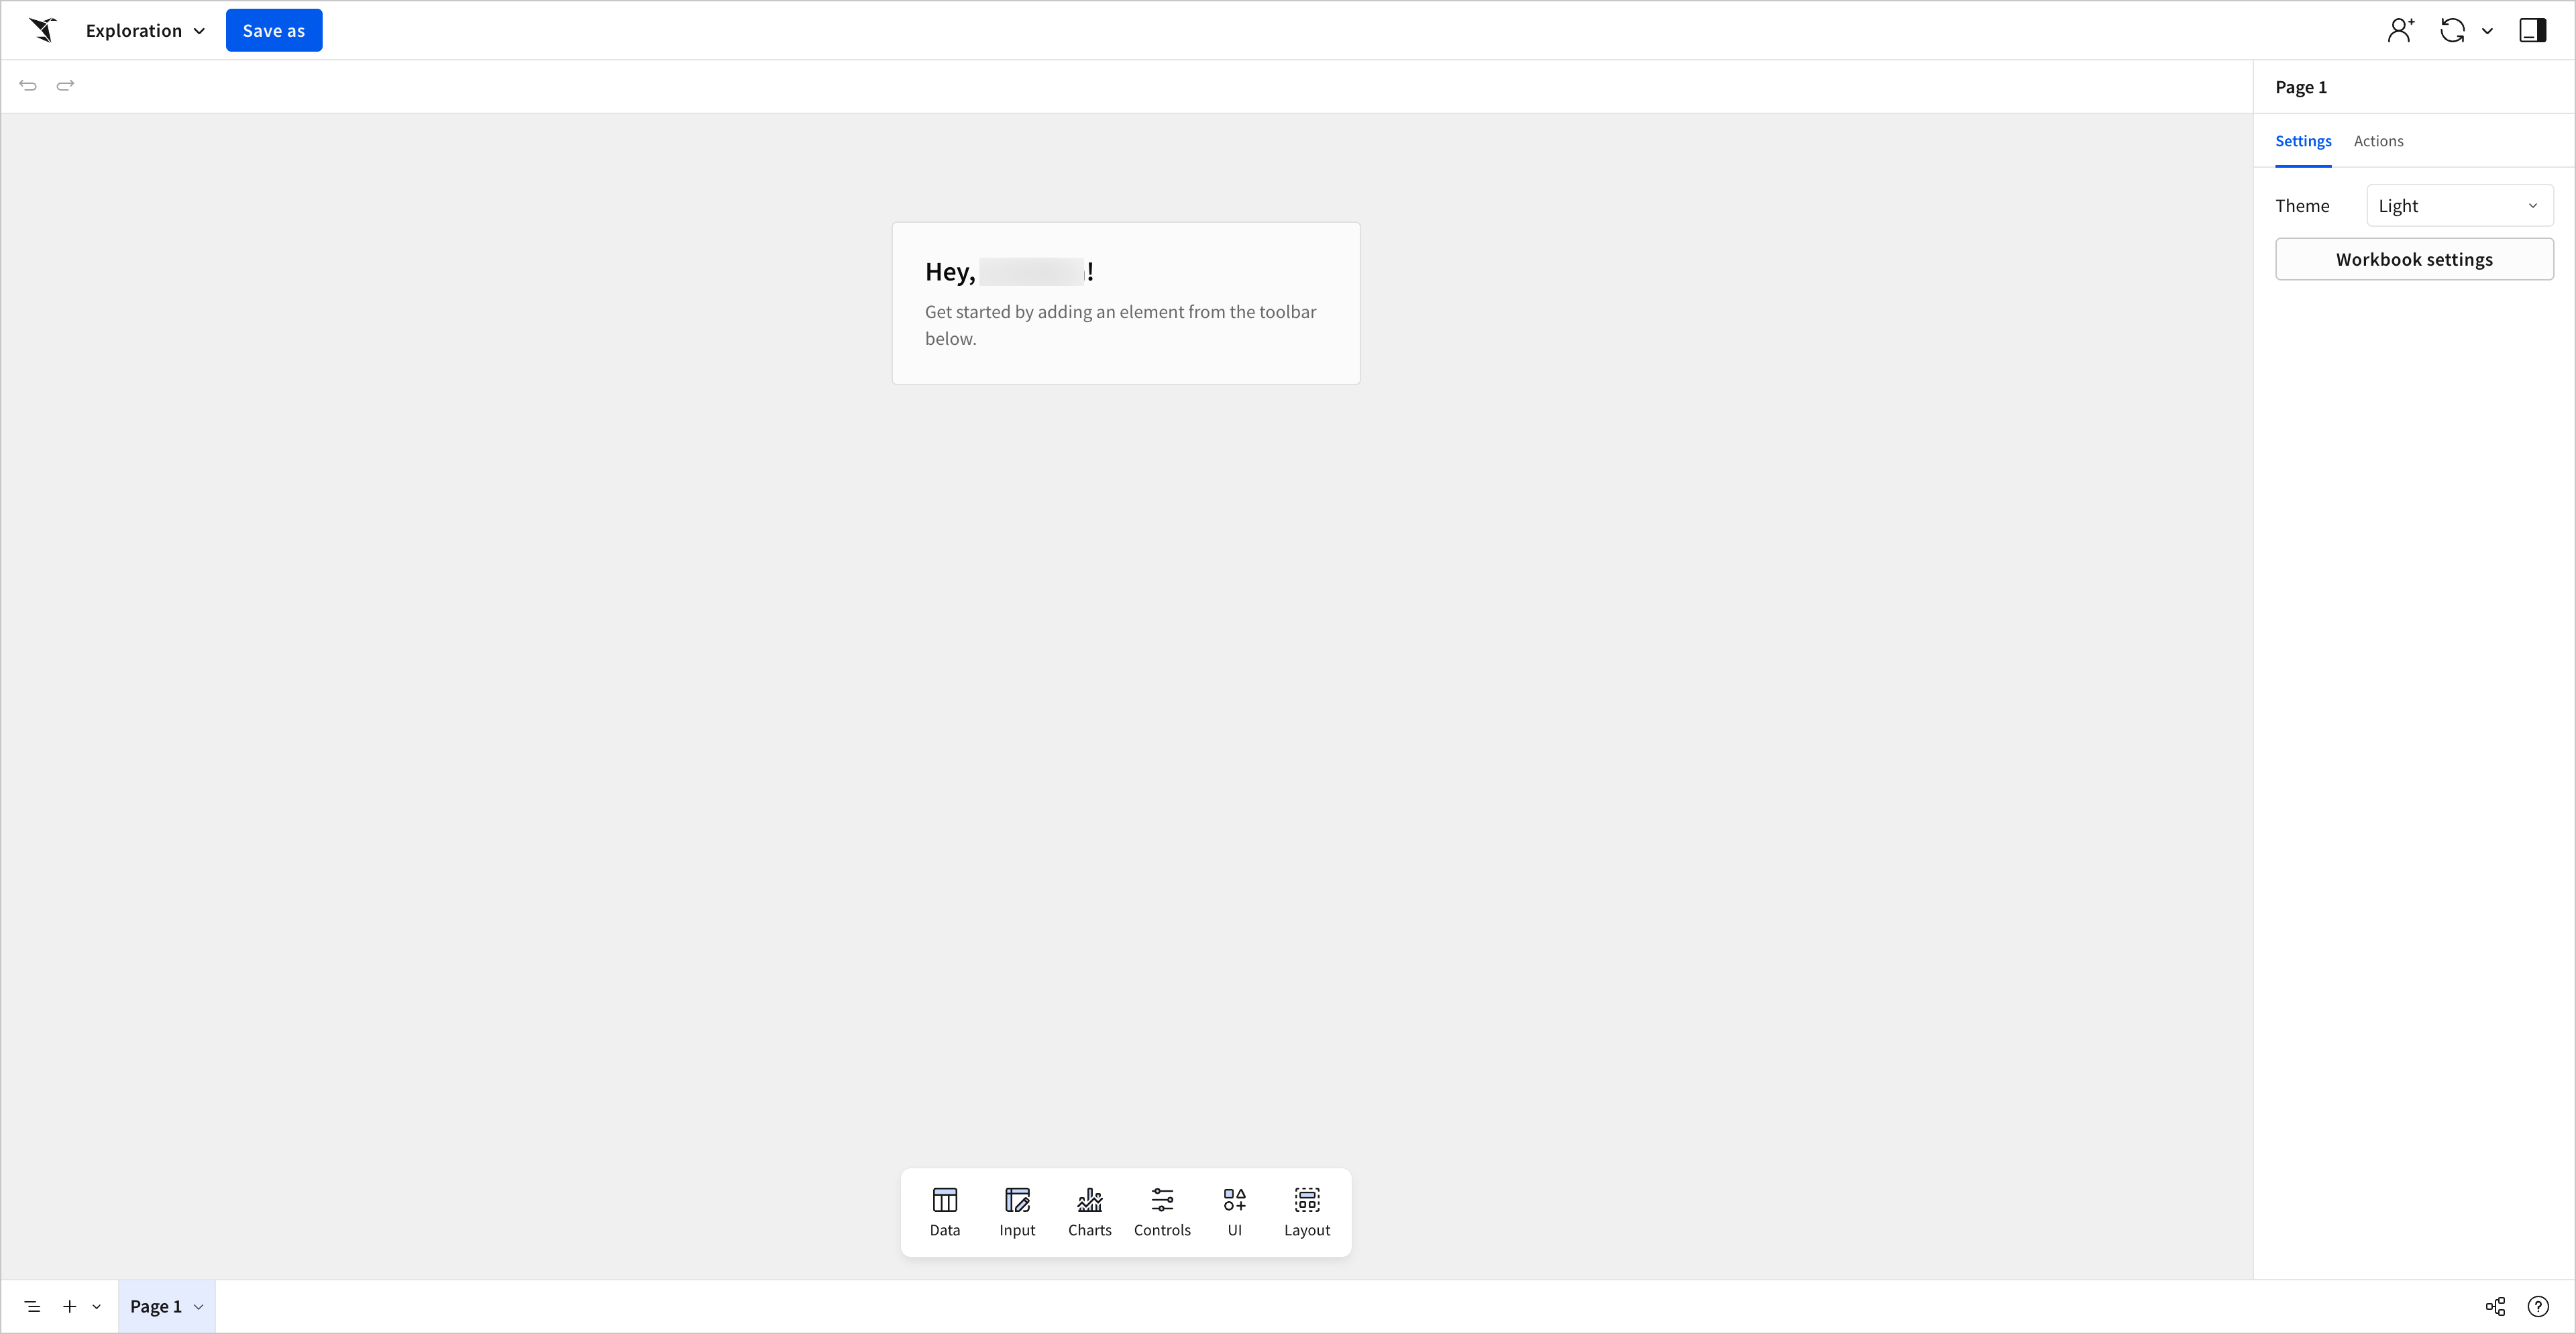
Workbooks are highly customizable spaces where we can view data, create dashboards, and develop interactive workflows. They’re the main canvases for building in Sigma.
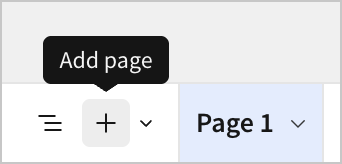
Workbooks contain one or more pages, which you can add by selecting ![]() Add page in the workbook footer.
Add page in the workbook footer.
Each page can contain several elements. Elements are the basic building blocks of our workbook. They include things like:
- Data tables
- Pivot tables
- Outputs of SQL queries
- Charts, graphs, and other visualizations
- Buttons
- Filters
- Images
- Text
- Embedded content
- And more!
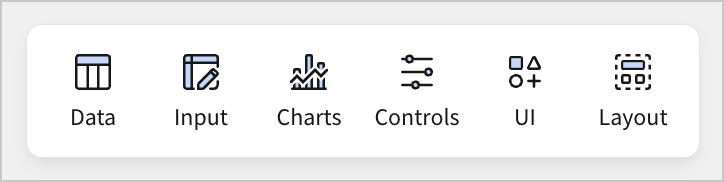
You can add an element from the Add element bar, found at the bottom of the workbook page.
Workbooks, pages, and elements exist in a hierarchy, where workbooks contain pages and pages contain elements.
At the highest level, building a workbook in Sigma is as simple as deciding which elements should be placed on which pages. Though there are many complex decisions to be made in terms of element types, settings, and interactions, it’s helpful to keep this organizing principle in mind.
How big should a workbook be?
Because one workbook can contain many pages and elements, it’s worth considering when to separate one workbook from another. Sigma recommends making a new workbook when:
- You need to customize your analysis for a new audience
- You need to connect to another data platform
- You want users to distinguish between two topics
For example, say you manage a highly detailed sales workbook that the sales team uses daily. It might have pages for opportunities, closed won, and closed lost. If the executive team asked for an overview of that data, you might decide to make an entirely new workbook for them, so you can customize their experience around key metrics only.
Adding data
When creating a new workbook, we almost always start by adding data from a data source. In this section, let’s add our first element by connecting to a data source and displaying it in our workbook as a table.
- In the Add element bar, select Data > Table.
Here, we see a menu where we can select a data source to populate the columns and rows of our table. We’ll discuss several options in this tutorial, such as adding a table from a CSV, custom inputs, data linked from an existing table element, and more. For now though, let’s add a table directly from a connected data platform.
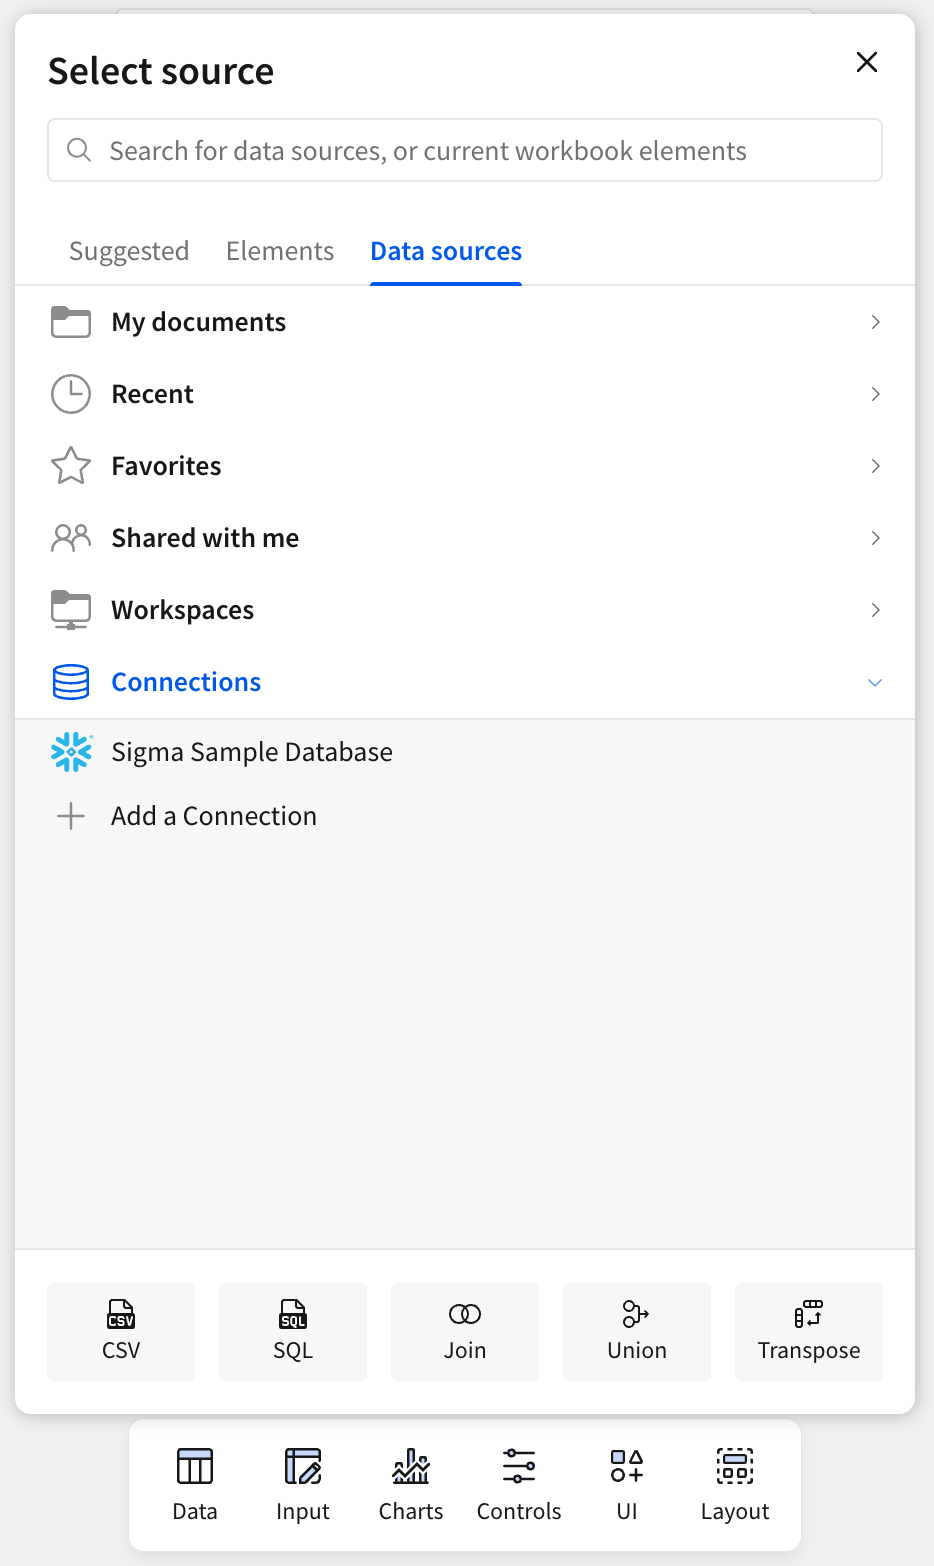
- In the Select source modal, select Data sources > Connections. Here, select the option titled Sigma Sample Database.
Your screen most likely differs from the provided screenshots at this step, because your admins have probably configured several connections that you can source data from. Any connections you have access to appear here.
Connections are pre-configured integrations with data platforms, such as Snowflake, Databricks, or another data platform. Connections are configured by administrators at the organization level, rather than in each individual workbook. Because of this, we don’t need to know much about connections to use them, we just have to understand that they link us to existing data that someone has made available for us to use in Sigma.
Where is the data?
One thing that makes Sigma unique from other business intelligence platforms is how it handles data from your data platform.
Sigma doesn’t store any data from your data platform.
In Sigma, you work with a live connection to your organization’s data platform. Since you’re accessing this data directly from a cloud service, your organization doesn’t need to configure servers, and you don’t need to manage any downloaded files. After an admin configures a connection, users like you can start analyzing, visualizing, and interacting with data.
Sigma makes the Sigma Sample Database available to all Sigma users, without any configuration. It’s a connection to a data warehouse with lots of sample data that you can experiment with. If you don’t see it as an option, it might be disabled by your Sigma admins.
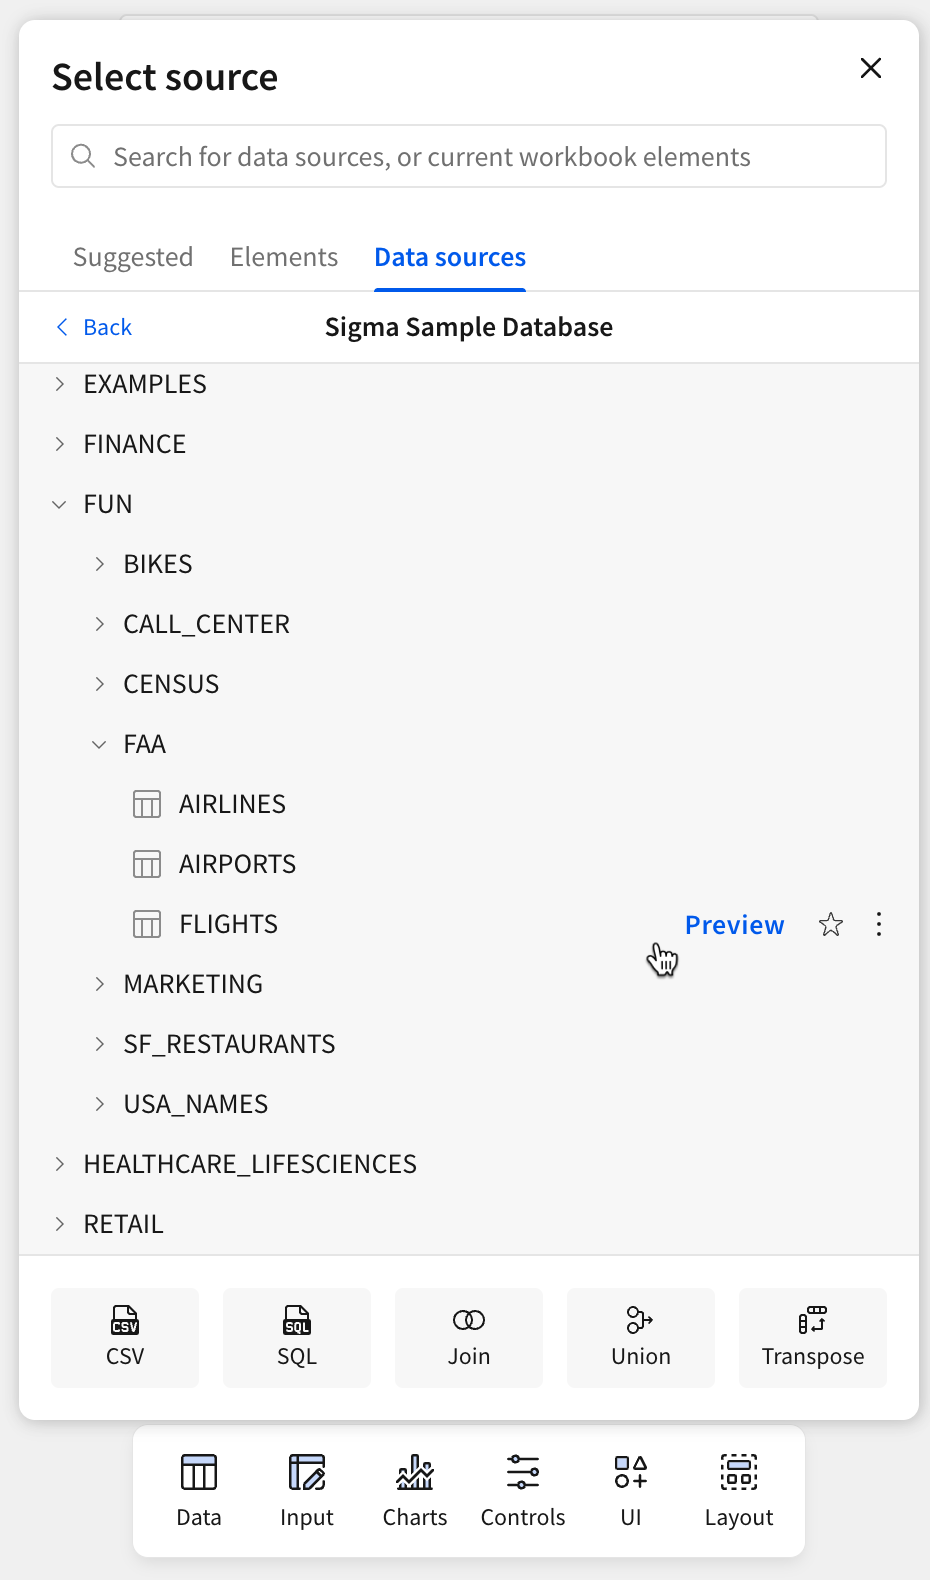
- Inside the Sigma Sample Database connection, open the FUN database. Then, select the FAA schema, and click FLIGHTS.
When you click FLIGHTS, the data from the FLIGHTS table in the warehouse appears as an element on the current workbook page.
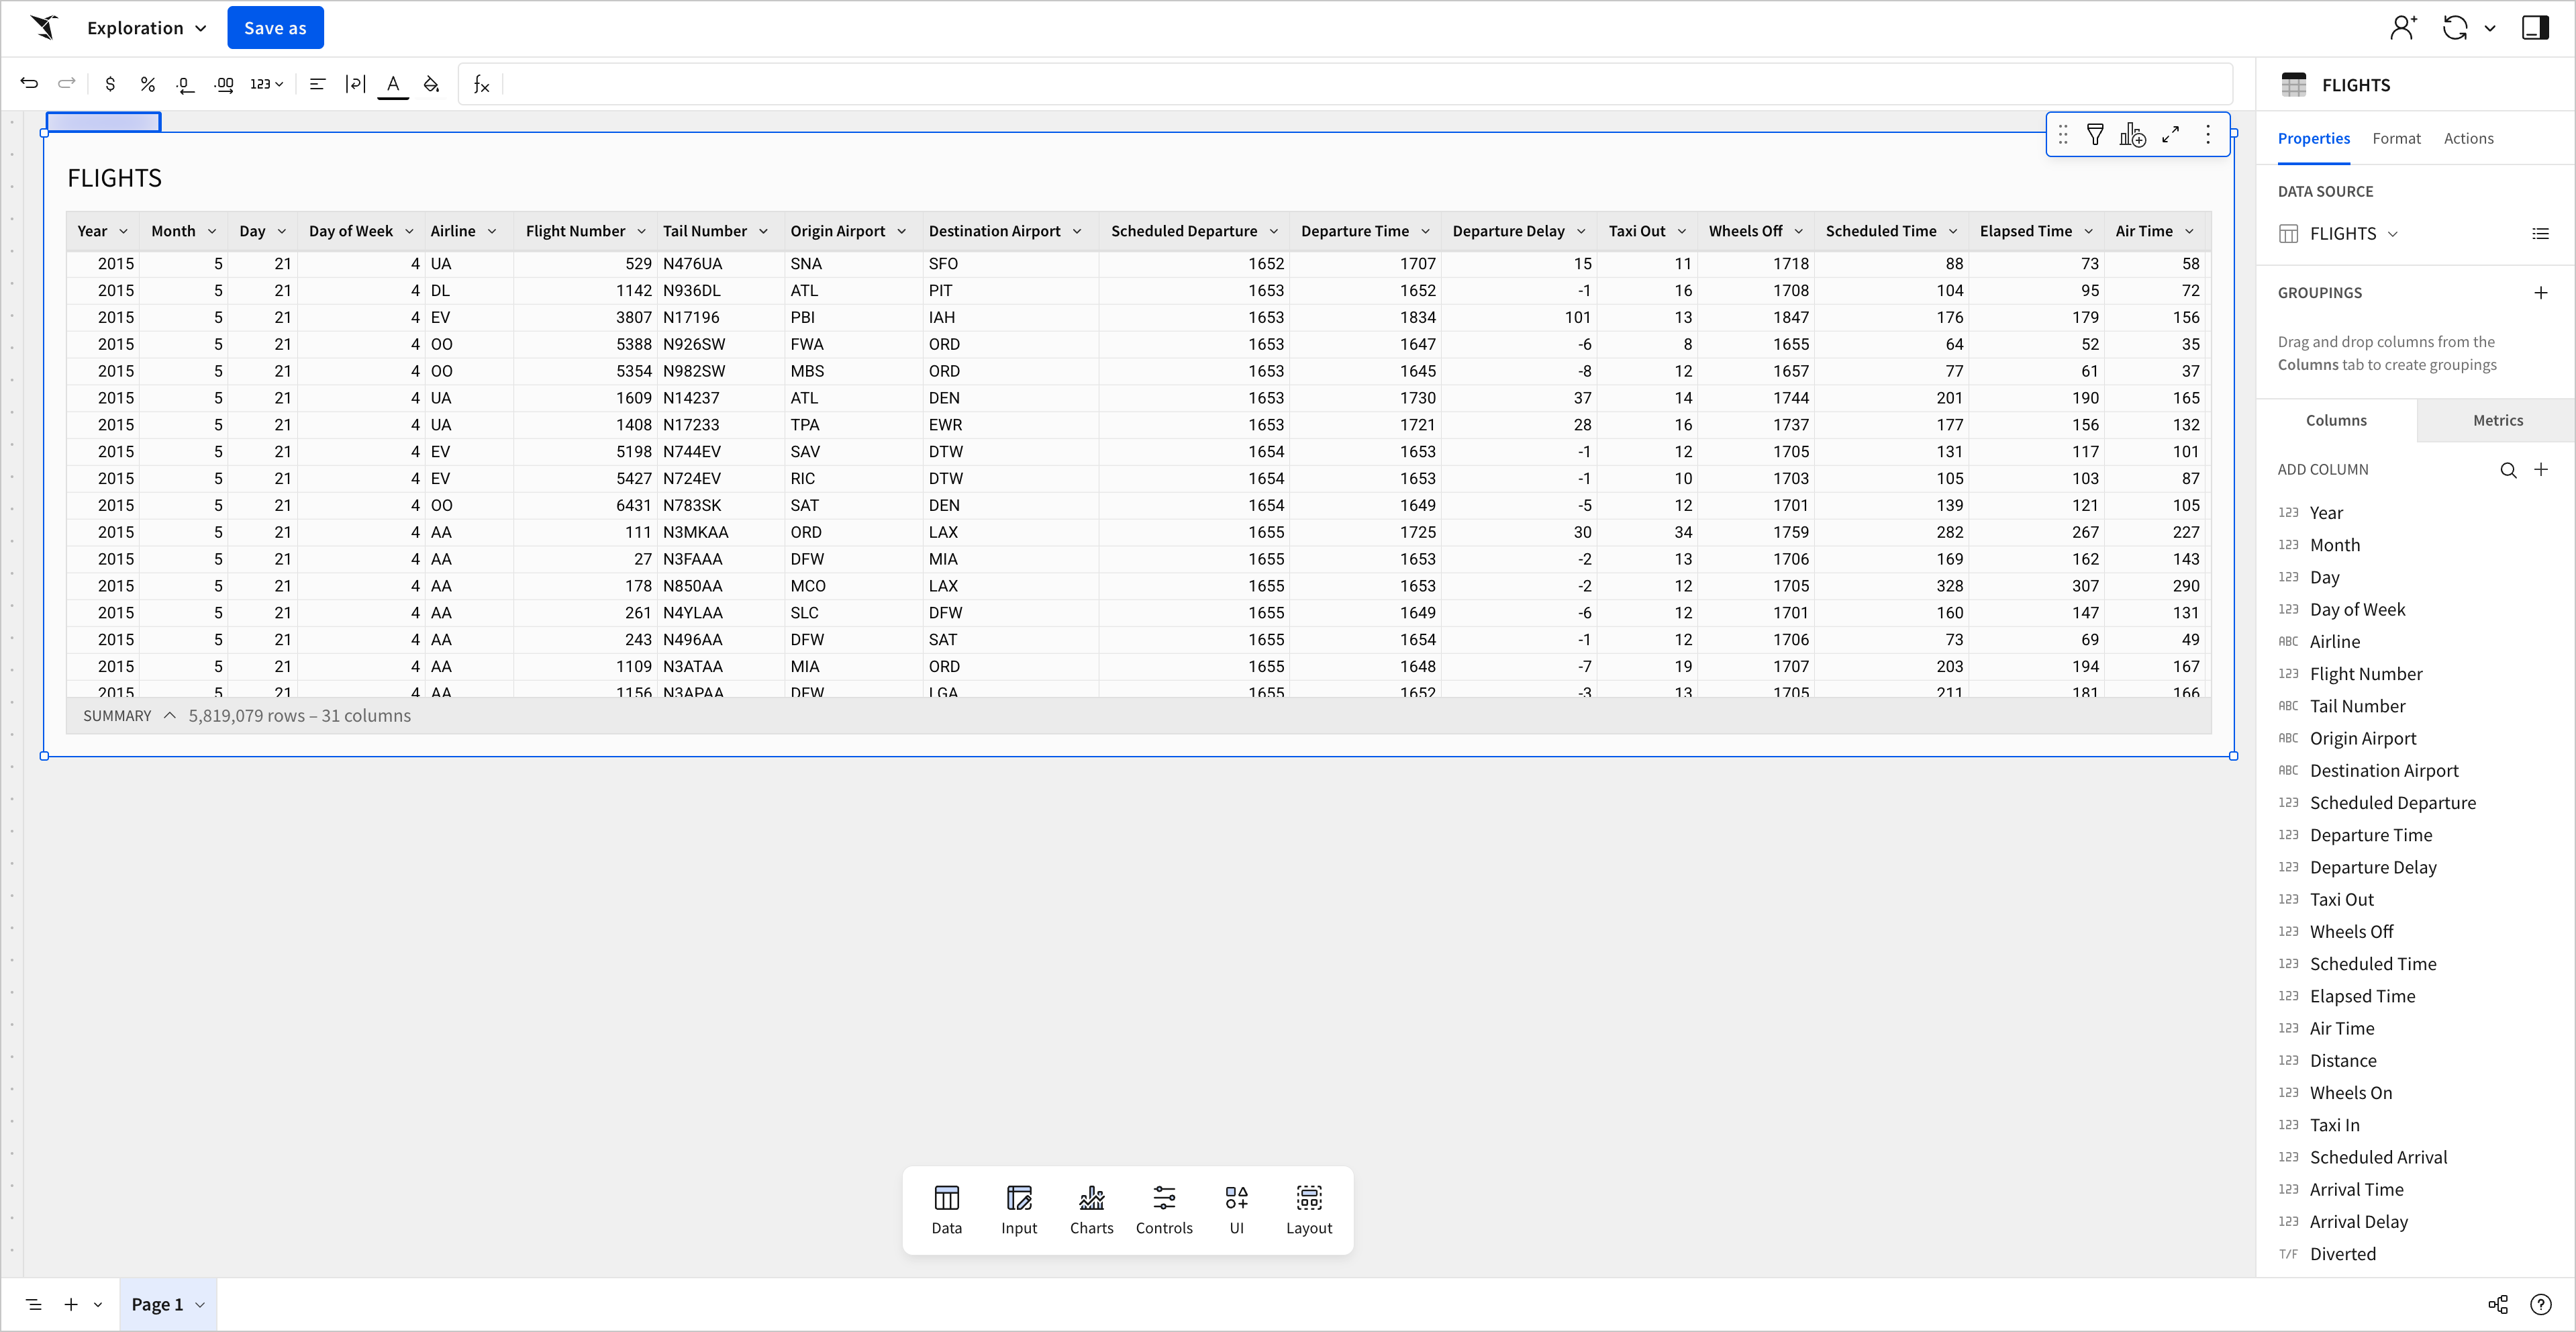
After placing an element, note the blue outline indicating that it is the currently selected element. The editor panel on the right-hand side shows information and options for the currently selected element.
If you click off the element, such as by clicking on blank space on the page, the blue outline disappears. The editor panel reverts to options for the workbook, rather than showing information about the table.
This might seem simple, but keeping track of the selected element becomes more important as we add more elements to our workbook, as well as duplicates, parent-child relationships, and more.
Saving and viewing your workbook
Now that we’ve added a table, our workbook is no longer blank. Let’s learn to save the changes we’ve made, as well as how to publish future changes we’ll make in these lessons to the published version of our workbook.
- In the workbook header, select Save as.
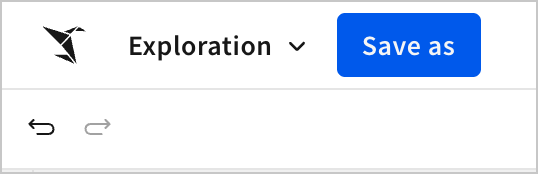
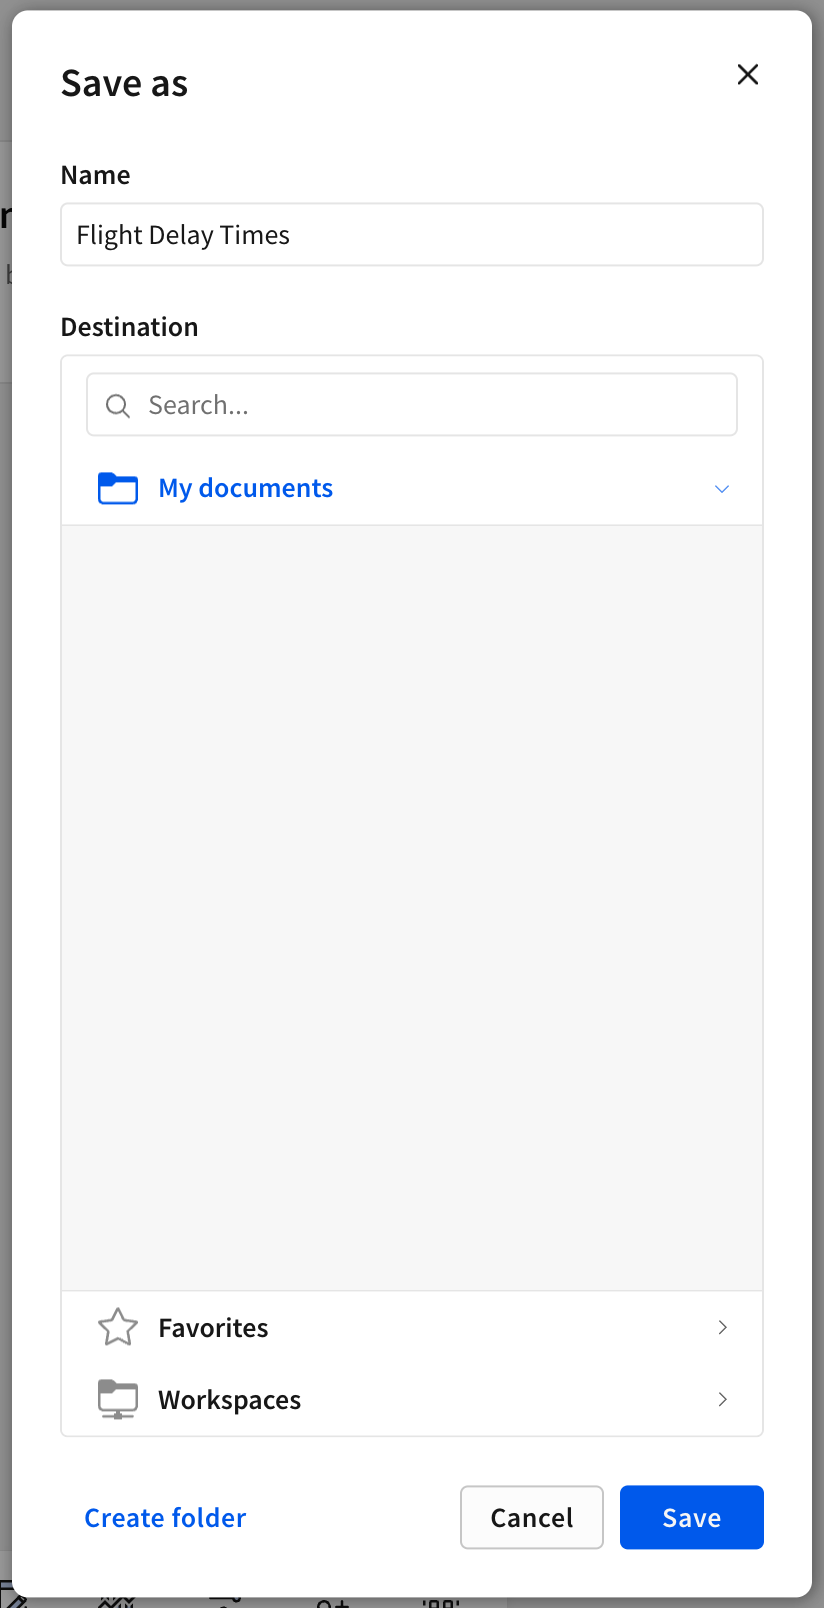
This opens the Save as modal where you can enter a name for your workbook and choose a destination to save it to.
-
Name your workbook Flight Delay Times.
-
Select Save at the bottom of the modal to save it to your documents.
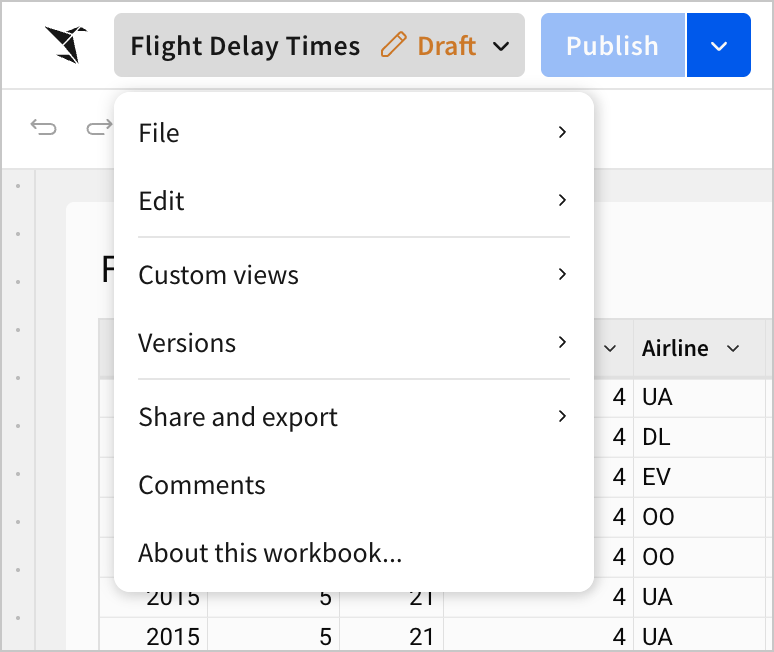
Once the workbook finishes saving, notice that all the options in the top-left corner have changed. The Save as button has been replaced with Publish, and Exploration has been replaced with the name of your workbook.
If you want to rename or administer your workbook, click the workbook title to open the Workbook menu and select from the options.
When you make changes, the Publish button becomes enabled. Click Publish to save your new changes to the published version. This version of the workbook is shared with other users.

Going forward, save changes to the published version at the end of each lesson. Though Sigma saves changes you make to the workbook regardless of the published version, we’ll need to view the published version at several points in the tutorial, so keeping it up-to-date is necessary.
Before we wrap up, let’s discuss the options Sigma provides to users for viewing their workbooks in more detail.
There are three main views:
- Draft - Where you can make and publish changes to your workbook
- Published version - Where you can view the workbook as a user
- Custom view - Where you can make and save changes that are only visible to you, and that do not impact the base workbook
So far, we’ve been working on our draft, making changes to our workbook that we can publish and share with others. This course focuses primarily on making changes to a draft and then publishing them. However, let’s take a moment to understand the published version and custom views.
- To view the published version, open the dropdown next to the Publish button, and select Go to published version.
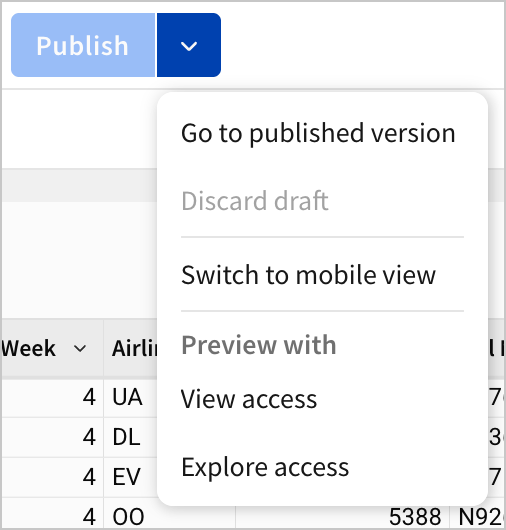
You now see the published version of the page.
We can use this option to view the published version of the page, as end users might see the workbook. It’s important to occasionally check what the published version of the workbook currently looks like. This becomes particularly useful when hiding pages and elements from users, or testing navigation.
Lastly, let’s discuss custom views.
To create a custom view, simply make any change to the workbook while viewing the published version.
For example, while in the published version, click the table, and select the funnel icon to open the filters menu. Click ![]() Add filter… to add a filter, and select any column to filter on. In the example below, a range filter on the month column sets the min and max values to 5, meaning we’ll only see data from the month of May.
Add filter… to add a filter, and select any column to filter on. In the example below, a range filter on the month column sets the min and max values to 5, meaning we’ll only see data from the month of May.
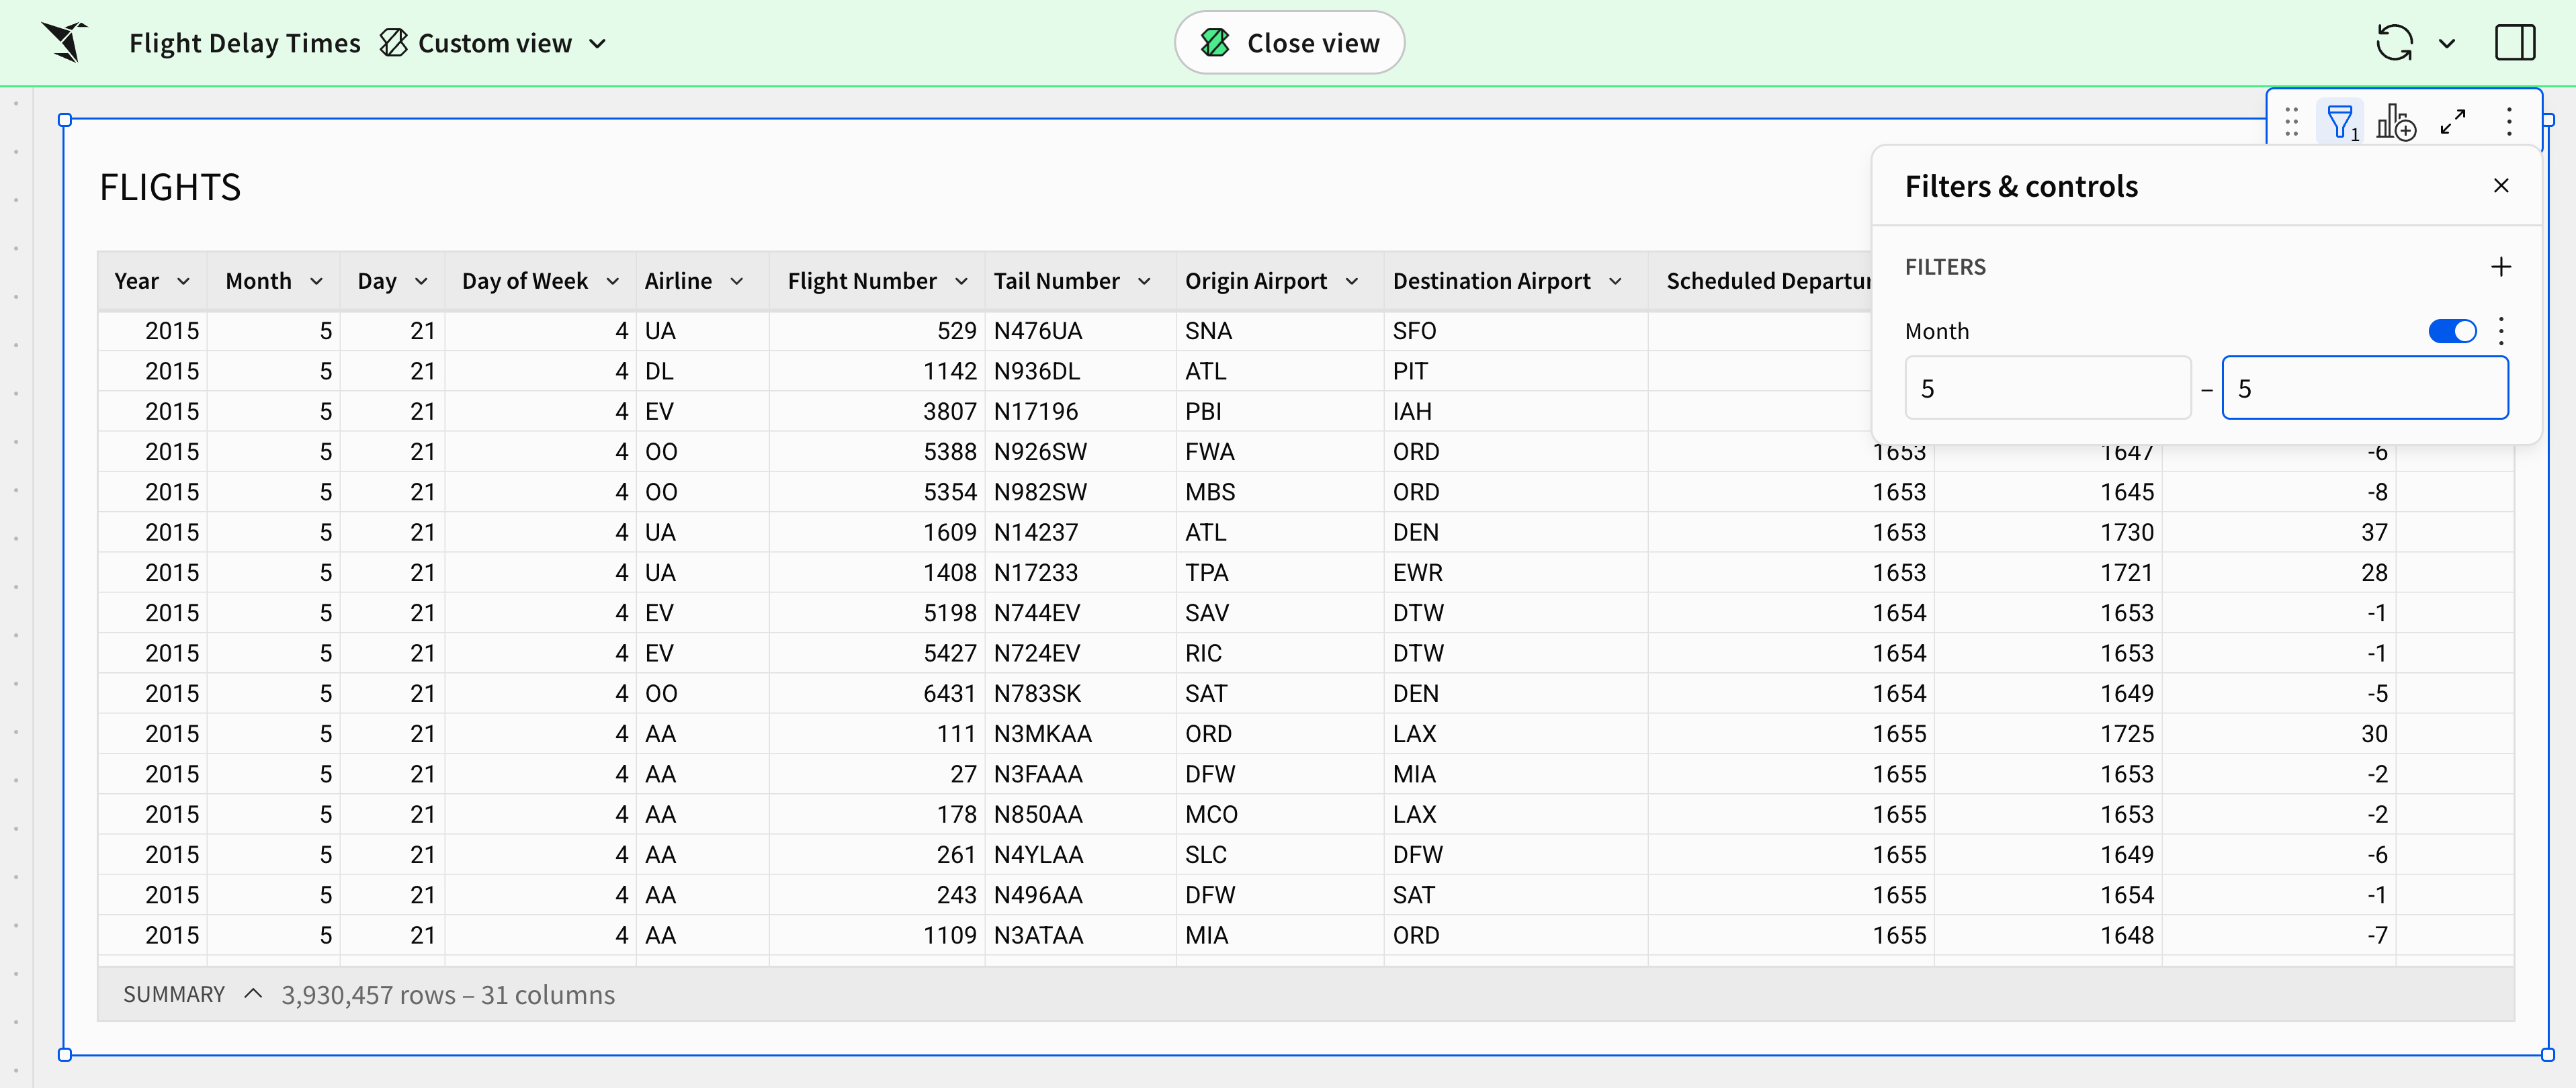
At the top of the page, the header turns green, and new options appear, like the ![]() Close view button.
Close view button.
These changes happened because the filter we applied has automatically created a custom view. Custom views allow us to save edits on top of the published version of a workbook that are visible only to us. Other users don’t see these changes, and the published version remains unchanged. Custom views allow us and other users to save settings in a workbook, regardless of the default view configured by the workbook owner.
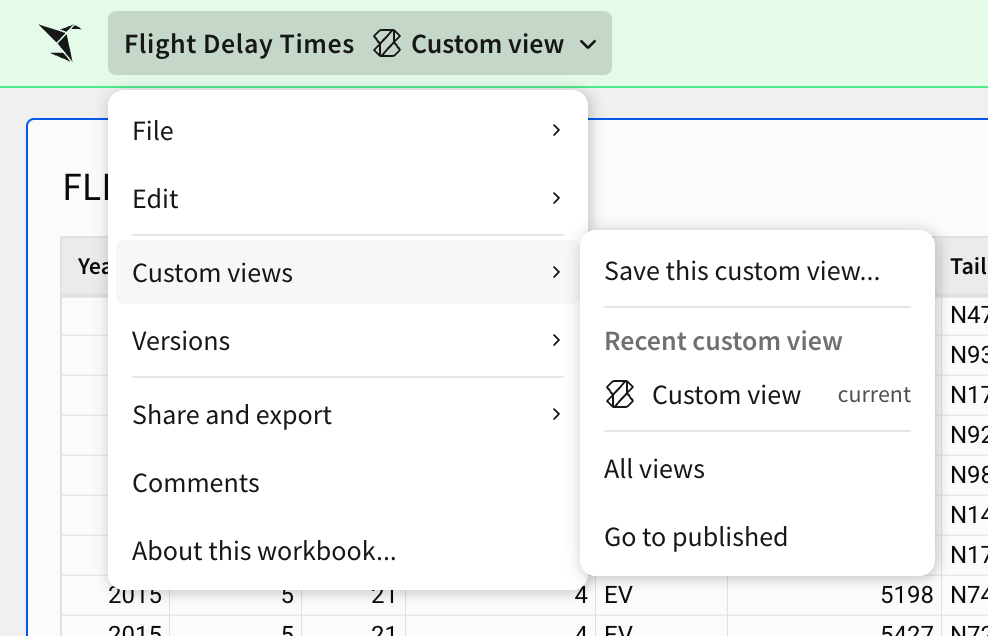
If you develop a custom view that you want to return to repeatedly, open the workbook menu in the header. Select Custom views > Save this custom view… In the Save view modal, you can set a name and some basic options.
To close the custom view and return to the published version, click ![]() Close view in the middle of the header.
Close view in the middle of the header.
To leave the published version and return to editing your draft, click Edit.
When should I use a custom view?
Custom views are helpful when one workbook has several users with competing preferences.
For example, say you’ve created a project management workbook with several filter options for fields like project type, status, owner, team, etc. Any filter settings you publish are visible as the default to all viewers when they open the workbook.
If many teams are relying on the workbook, you could publish it with all filters cleared by default, and instruct power users - like project managers - to create and save a custom view with their desired filters. That way, they could open directly to whatever filters they desire, like active tasks for their team, without disrupting the published view.
Conclusion
At the end of lesson one, our workbook is about as simple as it could be. We have one page with one table. Over the next seven lessons, however, this one table will become the backbone of a highly interactive dashboard.
Additionally, we’ve learned some key concepts that we’ll rely on throughout this course:
- Navigating Sigma’s menus and options
- Understanding the relationship between workbooks, pages, and elements
- Connecting to data
- Adding a table element to our workbook
- Saving and publishing changes to workbooks
- Toggling between draft, published version, and custom views