Tutorial: Configure API credentials, connectors, and actions for the NYC Open Data API
Tutorial: Configure API credentials, connectors, and actions for the NYC Open Data API
You can create API credentials and connectors for third-party APIs in Sigma, allowing users to create actions that call those APIs in workbooks. For instructions on how to configure API credentials and connectors, see Configure API credentials and connectors in Sigma.
By following this tutorial, you can configure a credential and connector that allow you to call an endpoint from NYC Open Data, an NYC program that provides open access to data created by city agencies. This example uses a credential with basic authentication, as well as a dynamic query parameter that can be used to Get JSON data from the NYC Open Data API in a workbook.
User requirements
- You must be assigned an account type with the Manage API connectors permission enabled.
Configure a credential and connector for an NYC Open Data API endpoint
To start, you must:
- Create a credential to store your authentication credentials for the NYC Open Data platform.
- Create a connector (with the credential) to use in a workbook.
Setup and background
To follow along with this example step-by-step, you first need to create a free account with NYC Open Data, and create a new API key in the developer settings for your profile. The secret key can only be copied from the screen at the time of creation, so be sure to store it somewhere secure and accessible once created.
This example uses the 311 Service Requests from 2010 to Present dataset. Each record in this dataset is a service request made to 311, a city agency that fields requests for information and complaints to city agencies.
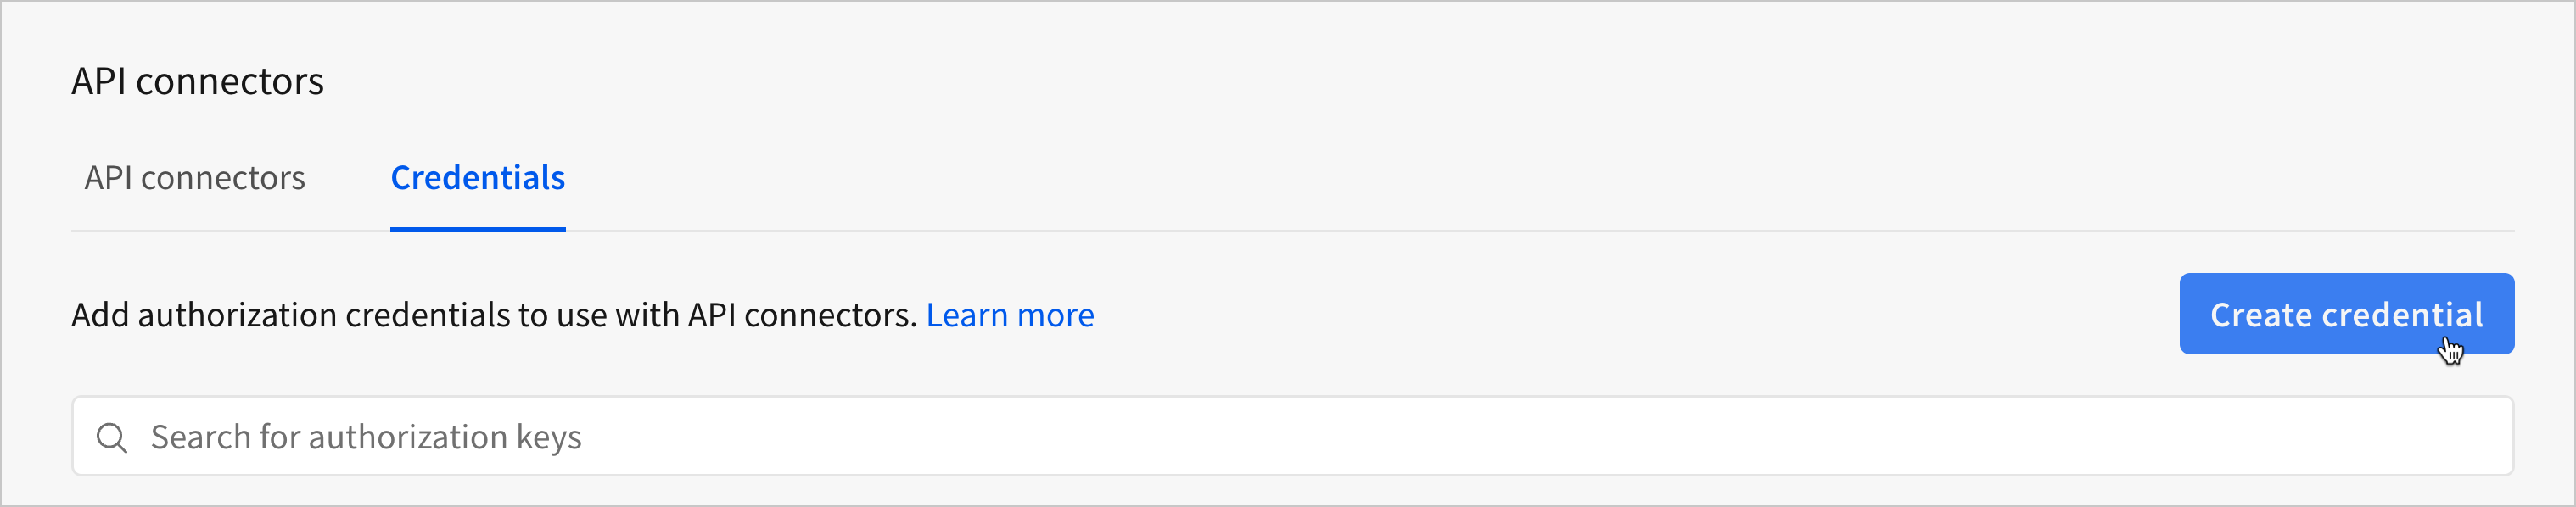
Create a credential
Create a credential to store your authentication credentials for the NYC Open Data platform.
- Go to Administration > API connectors.
- From the Sigma header, click your user avatar to open the user menu.
- Select Administration to open the Administration portal.
- From the side panel, select API connectors.
- Select the Credentials tab.
- Click Create credential.
-
On the New credential screen, configure the following fields to define the credential:
Though the NYC Open Data platform uses the term API key for the credential they provide, you can read in their documentation that the API expects a basic authorization header in the request. For more information on correctly formatting the authorization header in cases like this, see How Sigma handles authentication types in the request header.
-
Click Save.
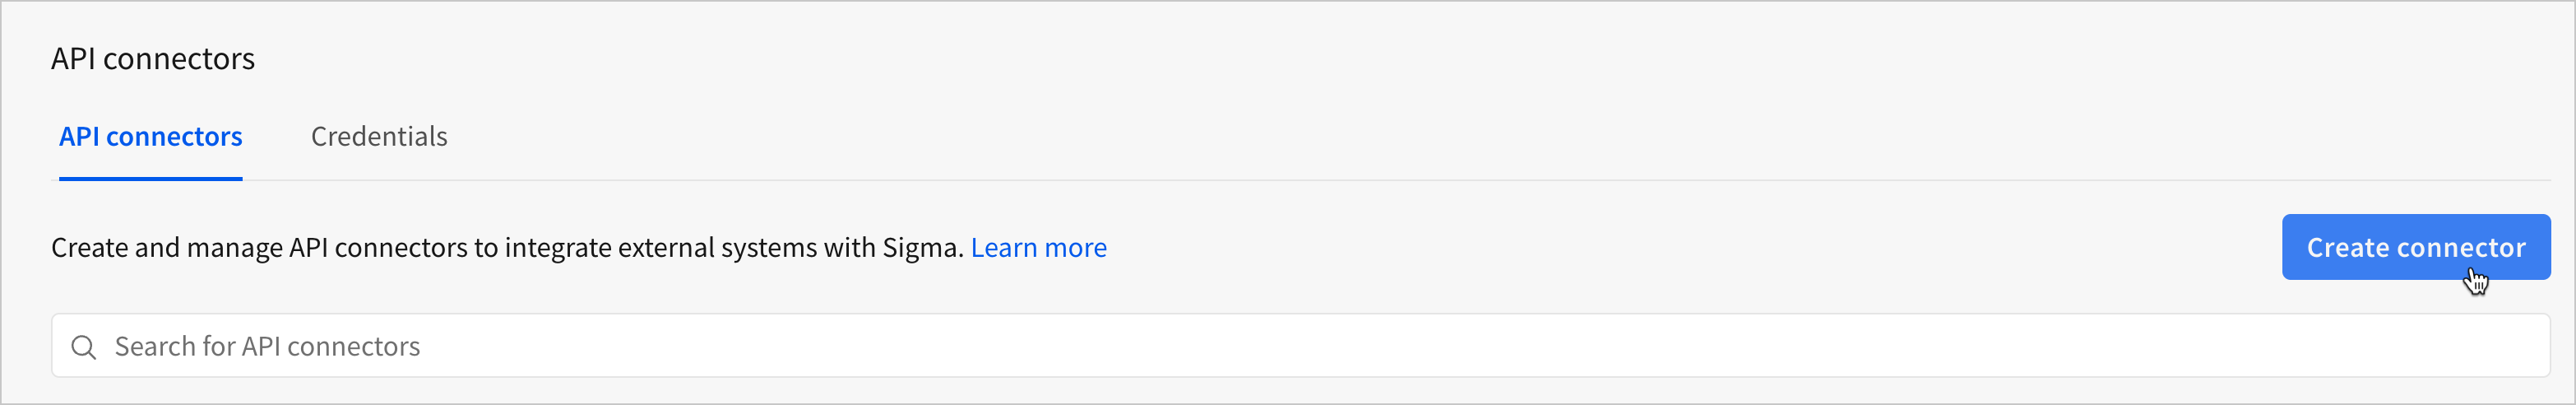
Create a connector
Using the credential from the previous section, create a connector to use in a Call API action.
- Go to Administration > API connectors.
- From the Sigma header, click your user avatar to open the user menu.
- Select Administration to open the Administration portal.
- From the side panel, select API connectors.
- Click Create connector.
-
On the New API connector screen, configure the following fields to define the connector:
To create a dynamic connector that could be used for several NYC Open Data endpoints, you can use a path parameter in the Base URL, like the following:
https://data.cityofnewyork.us/resource/:resourceUnder Path parameters, you can then set the mode to Dynamic to populate the
/:resourceparameter, allowing you to change the endpoint when using the connector in a workbook.
Get JSON data from the NYC Open Data API in a workbook
You can create actions that call third-party APIs and make the response body available in your workbook for further manipulation or data enrichment.
After following this example, you can configure actions in a workbook that call the NYC Open Data API for data on 311 Service Requests. Users can provide an address to a dynamic parameter to see the service requests made at a specific address.
Setup
To follow along with this example step-by-step, you first need to configure an API credential and connector as described in Configure a credential and connector for an NYC Open Data API endpoint.
Configure workbook elements
In a new workbook page, add and configure the following elements:
-
From the Add element bar, select UI, and then Button.
-
From the Add element bar, select Controls, and then Text Input.
-
From the Add element bar, select Controls, and then Text Area.
-
Select the text area element. In the editor panel, configure it with the following settings:
- Rename the control Response body
- Set the Control ID to response-body
-
Select the text input element. In the editor panel, configure it with the following settings:
- Rename the control Enter incident address
- Set the Control ID to enter-incident-address
-
Select the button element. In the editor panel, configure it with the following settings:
- Under Properties, set Text to Call 311 API
- Under Actions, click
 Add action to add two new actions to the Action sequence triggered On click
-
Configure the first action in the action sequence to call the API connector:
-
Configure the second action in the action sequence to update the text area control with the response body:
-
To test the Call API action, connector, and credentials, enter an NYC address into the Enter incident address control, and click the button to trigger the action sequence. If you want a sample address, try 124 EAST 14 STREET.
Break the response body into tabular data
You can use Python or SQL in Sigma to convert the JSON response body from an API action to tabular data, and use it as a table in Sigma. For more on the requirements and limitations of using the Python element, see Write and run Python code.
Code samples in this section vary by connection type, language, and output. Consider the best option for your use case.
- From the Add element bar, select Data.
- If you want to parse the JSON with Python, select Python. If you want to parse it with SQL, select Table > SQL.
- Select one of the code samples below based on your connection, preferred language, and output structure.
Databricks Python
Snowflake Python
Snowflake SQL - Single column
Databricks SQL - Single column
Databricks SQL - Multiple columns
Snowflake SQL - Multiple columns
- Click Run.
- Depending on your chosen code sample, break the output into a table:
- If you are using Python, open the Tabular output menu when the Python element finishes running, and select Table as the output child element.
- If you are using SQL, the table is created automatically. Select
 Toggle SQL editor to view the table.
- If you are using a query that returns one column of JSON objects, you can open the column menu
 and select Extract columns to break the JSON into columns. In the Extract fields from Item modal, select the fields you want to extract, and click Confirm.
 - If you are using a query that returns multiple columns, they appear as a table.
- If you are using a query that returns one column of JSON objects, you can open the column menu
After running the code, you have a table element with the contents of the JSON data currently in the response-body text area control. You can use this table as a parent element for charts, join it to other tables for data enrichment, and more.