
Customize the sort order of data elements
In Sigma, you can customize the sort order of tables, pivot tables, and charts. You can sort by any column in the data, even if the column is hidden or not used in a chart. For tables and pivot tables, you can also define the sort order for null values in a column.
Customize the sort order of a chart
To customize the sort order of a chart, such as a bar chart, do the following:
Before you start: You must be editing or customizing the workbook to configure custom sort.
- Right click anywhere on the chart or select
 More.
More. - In the menu that appears, select Sort > Custom sort....
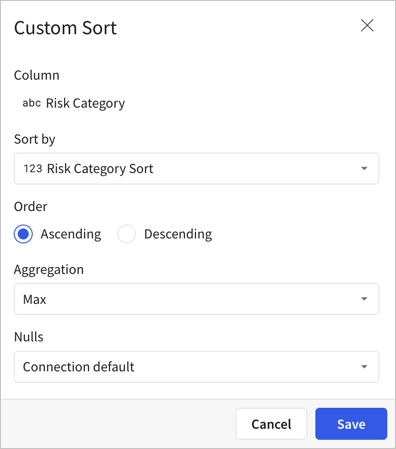
- In the Custom Sort modal, for Sort by, select a column to sort by.
- For Order, select Ascending or Descending.
- For Aggregation, select an aggregation type. Text columns do not require an aggregation.
- Click Save.
For a layered chart, such as an area chart or a scatter chart, the sort order of the values affects the order in which the layers are displayed.
Customize the sort order of a pivot table
To sort a pivot table by one column, and choose the sort order for null values in that column, do the following:
Before you start: You must be editing or customizing the workbook to configure custom sort.
-
For a pivot column or pivot row, select the down arrow (
 ) to open the column menu.
 -
In the menu that appears, select Sort > Custom sort....
-
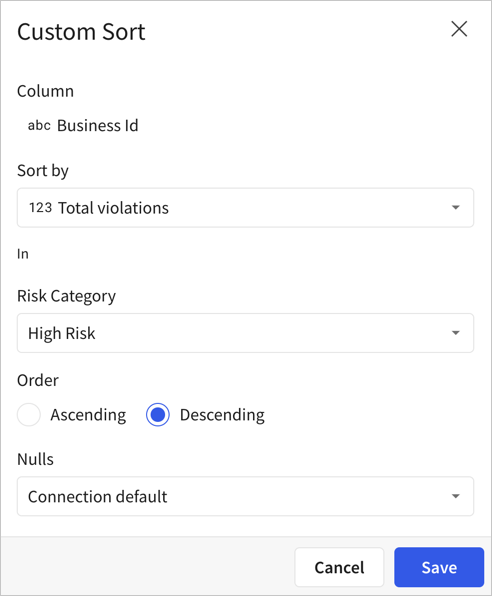
In the Custom Sort modal, the selected column is shown.
-
For Sort by, select a column to sort the selected column by. The sort column must exist in the pivot table, even if it is not displayed.
-
For Order, select Ascending or Descending.
-
For Aggregation, select an aggregation type. Text columns do not require an aggregation.
-
For Nulls, choose from Connection Default, First, or Last:
- Connection Default matches the same ordering used by your data warehouse.
- First lists null values first in a column, then sorts the rest of the column values by the sort order.
- Last lists null values last in a column, after the sorted column values.
-
Click Save.
Sort a specific values column
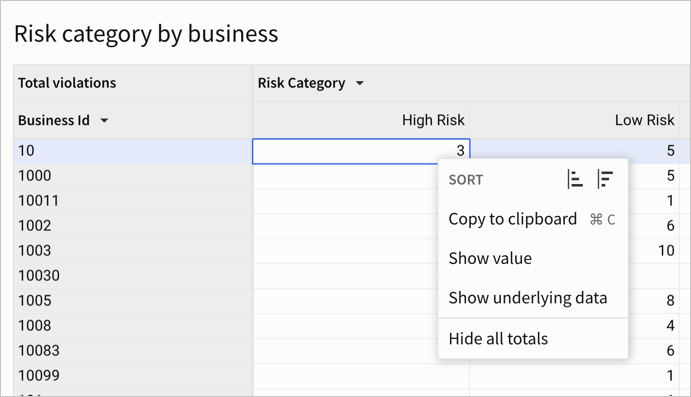
You can choose to sort a specific values column differently than other columns. For example, to sort only the High Risk column of a pivot table in descending order, do the following:
-
For a pivot table, locate the column that you want to sort differently, then right-click to open the context menu.
-
Choose an ascending (
 ) or descending (
 ) sort for the values.
The values in that column sort accordingly.
) sort for the values.
The values in that column sort accordingly. -
[optional] Adjust the custom sort, for example to change how null values are sorted in that column:
-
For the relevant pivot rows, select the down arrow (
) to open the column menu.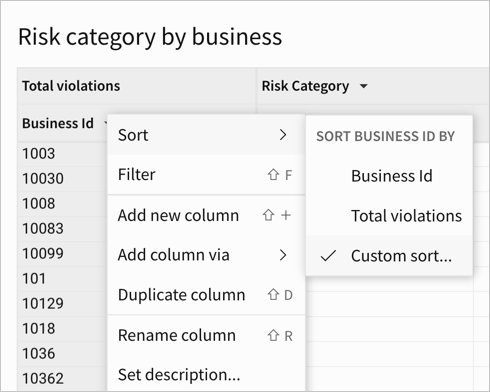
-
In the menu that appears, select Sort > Custom sort....
-
Adjust the sort for the values as desired. For example, for Nulls, choose to sort the null values last.
-
Click Save
-
Customize the sort order of a table
You can sort a table by one or multiple columns, and choose the sort order for null values in those columns.
If you want to sort by multiple columns, define the sorting rules in the order that they should apply to the table. You cannot change the order of custom sorting rules after you define them.
Before you start: You must be editing or exploring the workbook to configure custom sort.
To customize the sort order of a table, do the following:
-
For any column in the table, select the down arrow (
) to open the column menu. -
In the menu that appears, next to the Sort option, select Custom sort... (
 ).
). -
In the Sort modal, for Column name, select a column to sort by.
-
For Sort order, select A to Z or Z to A. Different columns show different options. Date columns can be sorted from Oldest to Newest or Newest to Oldest and number columns can be sorted from Largest to smallest or Smallest to largest
-
For Nulls, choose from Default, First, or Last:
- Default matches the same ordering used by your data warehouse.
- First lists null values first in a column, then sorts the rest of the column values by the sort order.
- Last lists null values last in a column, after the sorted column values.
-
To sort by multiple columns, select Add new and repeat the steps for another column.
-
Click Save.
Example: Use a helper column to sort an unordered column
Because you can customize the sort order by hidden columns, you can create a helper column to define an order for a column of string values. You can create a helper column to sort a column of weekday names in order, month names in order, or another text column according to an order that you define.
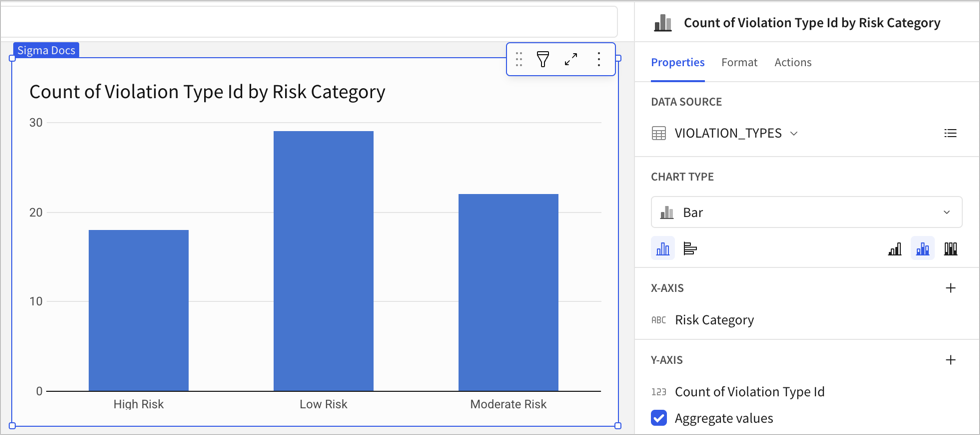
For example, in the Sigma Sample Database, the EXAMPLES.SF_RESTAURANTS.VIOLATION_TYPES table includes a Risk Category column that lists 3 types of risk: "High Risk", "Moderate Risk", and "Low Risk". If you want to sort the risk categories in order from most to least severe, you can create a column to define the sort order, then set up a custom sort for a visualization that uses that helper column:
-
While editing a workbook, add a table that uses the
VIOLATION_TYPEStable from the Examples schema of the Sigma Sample Database as a data source. -
Add a column to the table, named Risk Category Sort. For the column, use the following formula:
Switch([Risk Category], "High Risk", 1, "Moderate Risk", 2, "Low Risk", 3)The formula applies a numeric value to each text value from the Risk Category column, from most to least severe.
-
Create a bar chart as a child element from the table, using the Risk Category column as the X-axis and Violation Type Id as the Y-axis. The Violation Type Id column is aggregated to become a count of all violations.
-
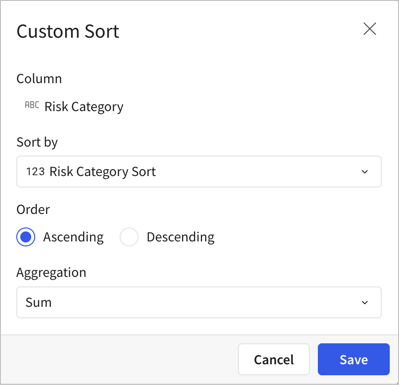
Sort the bar chart by selecting
More > Sort > Custom sort.... -
For Sort By, select the Risk Category Sort column.
-
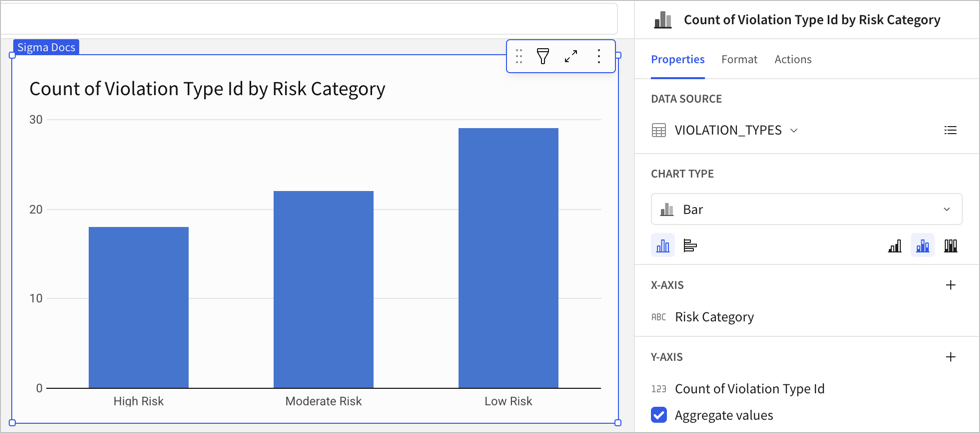
For Order, leave the default of Ascending selected to sort from most severe (1) to least severe (3).
-
For Aggregation, choose Sum. The aggregation is irrelevant in this example.
-
Click Save and confirm that your chart is sorted as you expect.
For another example, see How to sort a fiscal date column in the Sigma Community.
Updated 7 months ago