
Create and format trellis charts
Trellis charts (also known as small multiples or panel charts) allow you to compare and analyze multiple subsets of data within a single chart. The subsets are represented by smaller charts (or panels) arranged in rows and columns based on specific data dimensions. The division of data and resulting grid-like structure make it easier to identify patterns, trends, and relationships that can help you uncover valuable insights within large, complex datasets.

This document introduces the concept and structure of trellis charts and explains how to use them to add clarity and value to your charts.
The following chart types support trellising:
User requirements
The ability to create and format trellis charts requires the following:
- To use this feature, you must have Can edit or Can explore access to the individual workbook.
- You must be in a draft, custom view, or saved view of the workbook.
Prerequisites
- You must have or create a chart that is compatible with trellising.
Understanding trellis charts
Trellis charts enable you to quickly and effectively visualize multidimensional data subsets and explore them from different angles. Although you could build an individual chart element for each data subset, you can quickly create a trellis chart that offers several advantages that contribute to data coherence and ease of use, including the following:
-
Organization: Data subsets are presented in a logical, organized structure that facilitates systematic comparison and exploration.
-
Scalability: Data updates, including new attributes introduced to the dataset, are seamlessly incorporated into the chart’s dimensions.
-
Consistency: The shared underlying data ensures consistent application of filters and aggregations, while the use of a single chart provides uniformity in scale, format, and styling.
Trellis rows and columns
In a trellis chart, rows (vertical divisions) represent one dimension, while columns (horizontal divisions) represent another. The individual panels represent the intersections of specific row and column attributes, which visualize data subsets that are more digestible and easily compared in the context of the dimensions and corresponding attributes.
Non-trellis vs. trellis
The following charts demonstrate how trellising can enhance data chart.
No trellising: This initial chart shows a basic view that compares total revenue per fiscal year from 2019 to 2023. The stacked bars differentiate revenue for each product family, providing an additional dimension to explore within and across each year.

Trellis columns: This second chart incorporates trellis columns to deepen the analysis. You can still analyze total revenue by fiscal year and product family, but the additional dimension allows you to compare these data points within and across smaller data subsets based on store region.

Trellis rows and columns: This final chart incorporates trellis rows and columns for even more granular data subsets. As with the previous chart, you can still analyze total revenue by fiscal year and product family, but the two additional dimensions allow you to compare data points within and across data subsets based on the intersections of store regions and product types.
While the grid structure makes it easy to compare revenue between data subsets that share a common store region or product type (shared attributes across the same row or column), you can also obtain meaningful insights by exploring data points across the complete grid.

Create a trellis chart
-
Select a chart on the workbook page.
-
In the editor panel, select Trellis.
-
Add columns to the Trellis row and Trellis column sections as needed.
- To create a vertical comparison of data subsets, click
 Add column in the Trellis row property.
 - To create a horizontal comparison of data subsets, click Add column in the Trellis column property.
- To create a vertical comparison of data subsets, click
-
Select a column to add using one of the following methods:
- To derive dimensions from an existing column in the data source, search or scroll the Select column list and select the desired column.
- To create dimensions based on a new column, select Add new column, then enter a function or value in the formula bar.
You can also select an existing column by dragging and dropping a column name from the Columns list to the Trellis row or Trellis column property.
Create a trellis chart with multiple series
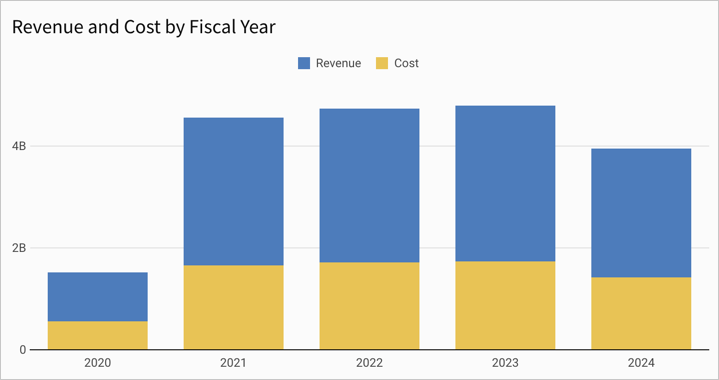
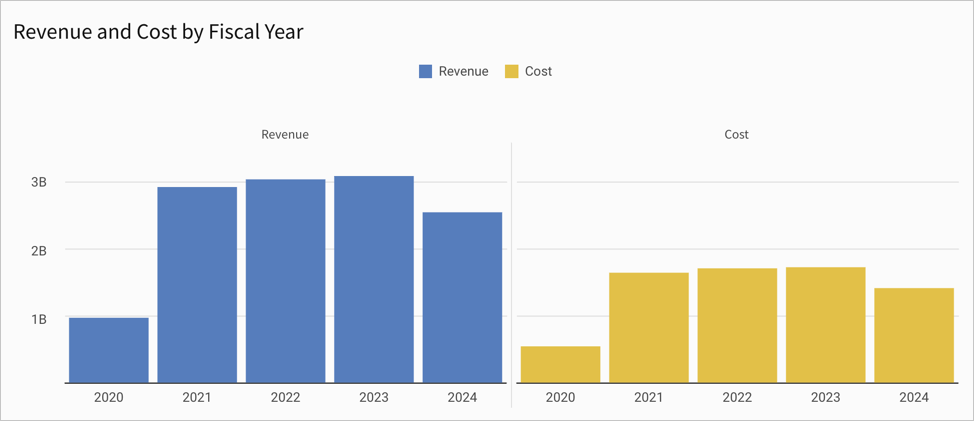
If your chart is a bar, line, area, or scatter chart containing multiple series, such as both Revenue and Cost, you can create a trellis chart for the series
-
Select a chart with at least two series on the workbook page.
-
In the editor panel, select Trellis.
-
For Trellis by, select Series.
-
For Direction, select Row (default) or Column.
To remove a trellis by series and set up a trellis by category instead, select Revert to default.
Customize trellis titles and labels
You can change the visibility of trellis titles and labels, customize the chart title, font size, and font color as needed.
-
Select the chart you want to modify on the workbook page.
-
In the editor panel, select Format, then click Trellis to expand the section.
-
Modify the available options for the trellis:
- To modify the size of the trellis tiles within the chart, modify the Tile size. You can choose Auto or Compact.
- For a trellis chart with rows or columns, you can choose to show or hide a border between rows and columns. To show the border, select the checkbox for Show row border or Show column border.
-
Configure the title and label for the trellis rows or columns in the chart:
-
To show the title, turn on the Show title toggle or turn it off to hide the title.
-
To show the label, turn on the Show label toggle or turn it off to hide the label.
-
To set the title or label's text, enter the title or label in the relevant text box.
-
To change the font size and color of trellis titles and labels, use the formatting tools:

Font size Select a font size (10-48px). 
Text color Enter a hex value or select an option from the color palette or picker.
-
Customize shared trellis components
By default, Sigma displays shared x-axis labels for each column (cartesian charts only), shared y-axis labels for each row (cartesian charts only), and a shared legend for the entire grid. You can customize the trellis format to use shared components or display separate labels and legends for each panel.
-
Select the chart you want to modify.
-
In the editor panel, select Format, then click Trellis to expand the section.
-
To change the shared components, configure the X-axis, Y-axis, and Color legends fields:
- To share the axis values or legend, turn on the X-axis toggle, Y-axis toggle, or both.
- To display the axis values or legend in each panel, turn off the toggle for the desired axes.
-
To configure custom chart axis marks, such as ticks and grid lines, follow the steps in Configure chart axis marks.
Updated 7 months ago