RankPercentile
Rank the rows in the table by percentile using the input column.
Usage
RankPercentile(column, [direction])
column (required) The column used to order the table. The input column can be numbers, dates or text.
direction (optional) The direction to sort the input column. Default is to sort ascending.
The percentile is a number between 0 and 1. The last row is always 1 and the first is 0, unless there is only 1 row or there is a tie for the top value. To display the result as percentages as opposed to numbers, change the column formatting from Automatic to Percent.
Example
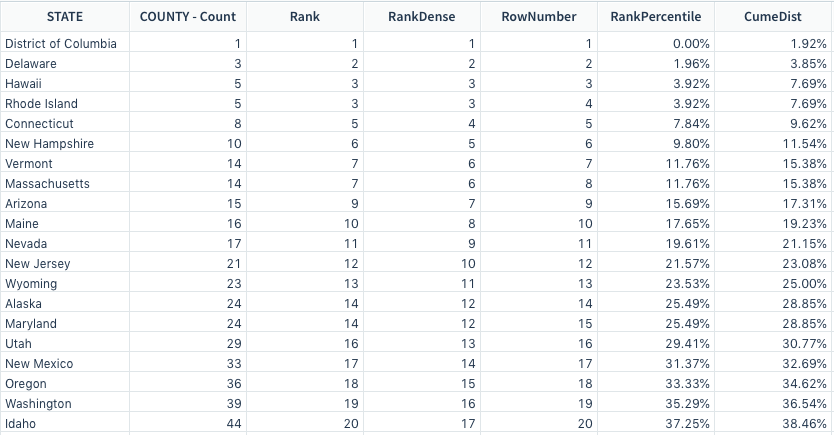
RankPercentile([Population by State])
- This assigns the state with the smallest population rank 0, the largest population is assigned rank 1.
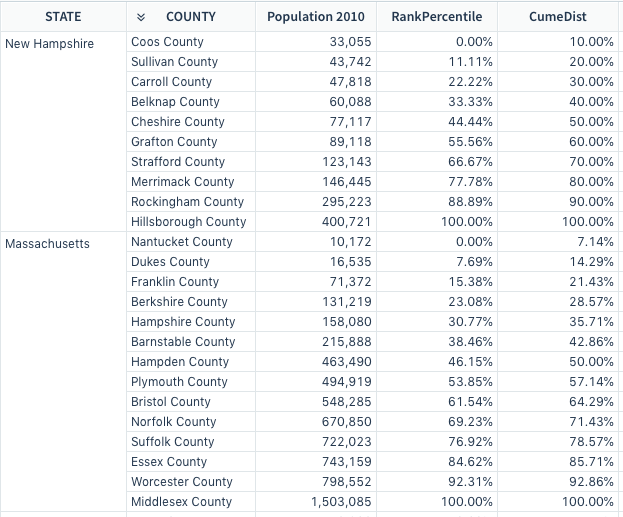
RankPercentile([Population 2010])
RankPercentile([COUNTY - Count])