
Area charts
You can create a chart from the Add element section of the workbook, or directly from an existing data element.
Visualized data does not display on the page canvas until all required plot fields are defined.
Add columns to open fields and marks using either the + menu or dragging and dropping the column.
Required Fields
- X-AXIS (1+ columns)
- Y-AXIS (1+ columns)
Columns added to the Y-AXIS field are aggregated by default. Aggregation type (e.g. Sum vs Count) is dependent on the original column’s value type (e.g. text, number, date, etc).
For example, a numeric column such as 'Sales Amount' creates a new calculated column, 'Sum of Sales Amount' (e.g. Sum([Sales Amount])).
Marks
- COLOR
- TOOLTIP
- TRELLIS
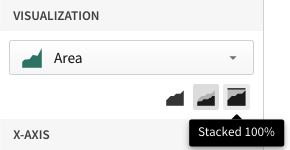
Stacked area chart variations
Area charts support three stack variations:
- No Stacking - Areas start from the X axis and might overlap
- Stacked - Areas stack on top of each other
- Stacked 100% - All areas add up to 100% of the area
Create a stacked area chart
Before you start: This action uses the editor panel. If you have not done so already, open the editor panel from either Explore or Edit mode.
- In the editor panel, add a column to the Color field.
- [optional] Select one of the three stack options from the top of the chart’s editor panel view.
Format Options
To begin editing an visualization’s format options:
Before you start: This action uses the editor panel. If you have not done so already, open the editor panel from either Explore or Edit mode.
- Select
 Element format in the side navigation
 - Select a format option to view and edit its settings.
The following format options are available for area charts: