
Snowflake usage templates
Sigma's Snowflake usage templates provide an accurate, in-depth, and prebuilt analysis that helps you understand your company's Snowflake consumption and performance. These templates combine descriptive and prescriptive analytics to provide a foundation for starting an unrestricted analysis into Snowflake usage data. Sigma offers the following templates:
User requirements
The ability to view Snowflake usage templates on your company's Snowflake usage data requires the following:
- You must be an organization Admin or be assigned an account type with the View usage dashboard permission enabled.
- Your connection must have access to the proper Snowflake usage data schema for each template (see Grant privileges to a role in Snowflake).
You can see the templates on sample Snowflake usage data by launching the template, regardless of your connection's Snowflake access.
Types of Snowflake usage templates
These are the descriptions, the data, and the privileges for each template:
- Cost Monitoring
- Covers compute and storage cost across all accounts in the organization. Tracks contract consumption, compute cost and storage cost across your entire Snowflake organization.
SELECTaccess on theORGANIZATION_USAGEschema.- This schema exists only in your primary Snowflake account.
- Performance Monitoring
- Monitors queries in an individual Snowflake account. Tracks query performance, warehouse activity, and other performance metrics.
SELECTaccess on theACCOUNT_USAGEschema.- User Activity
- Monitors users in an individual Snowflake account. Tracks how Snowflake users use warehouses and databases.
SELECTaccess on theACCOUNT_USAGEschema.- Reader Cost
- Monitors compute cost for reader accounts of an individual Snowflake account.
SELECTaccess on theREADER_ACCOUNT_USAGEschema.
Change the role of a connection
The value may be set by user attributes; depending on your access, you may not be able to make the change.
-
Open your Sigma Admin Portal.
-
Select the Connections page from the left hand panel.
-
Select your connection from the connection list.
-
In Connection Details, click Edit.
-
In the Edit connection page, scroll to the Connection Credentials section.
-
Change the Role definition.
-
Click Save.
Grant privileges to a role in Snowflake
To use the Snowflake Usage Templates, you must grant access for the proper schema to the role of your Sigma connection to Snowflake. For example, the following SQL statement grants access to the Snowflake database to the SigmaServiceRole role.
grant imported privileges on database snowflake to role SigmaServiceRole;Note that all templates don't run on the same schema. To understand roles, permissions, and grants for a specific schema, see Snowflake's Account Usage documentation.
Create a new workbook from a Snowflake Usage Template
To display your company's Snowflake usage data, follow these steps to create a workbook from a Snowflake Usage Template.
-
Go to your Home page.
-
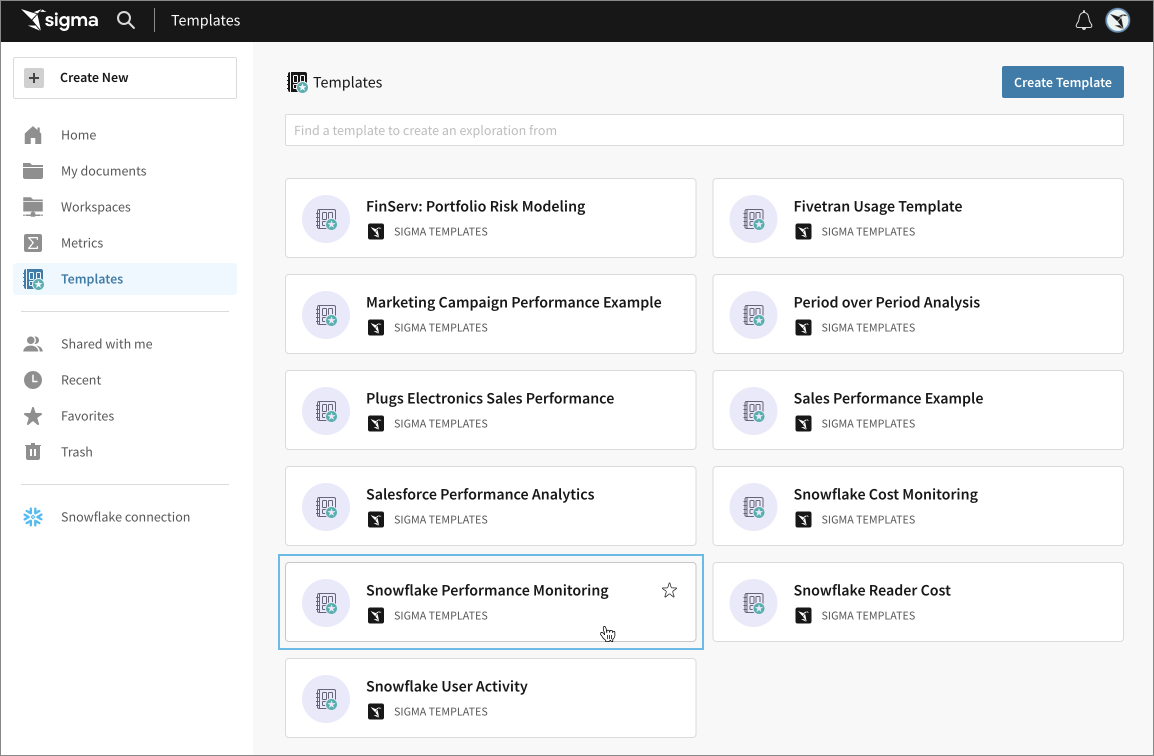
In the left navigation pane, select Templates gallery page. You can access it from:
-
On the left panel, click Templates.
-
Click the Snowflake Usage Template you want to use.
-
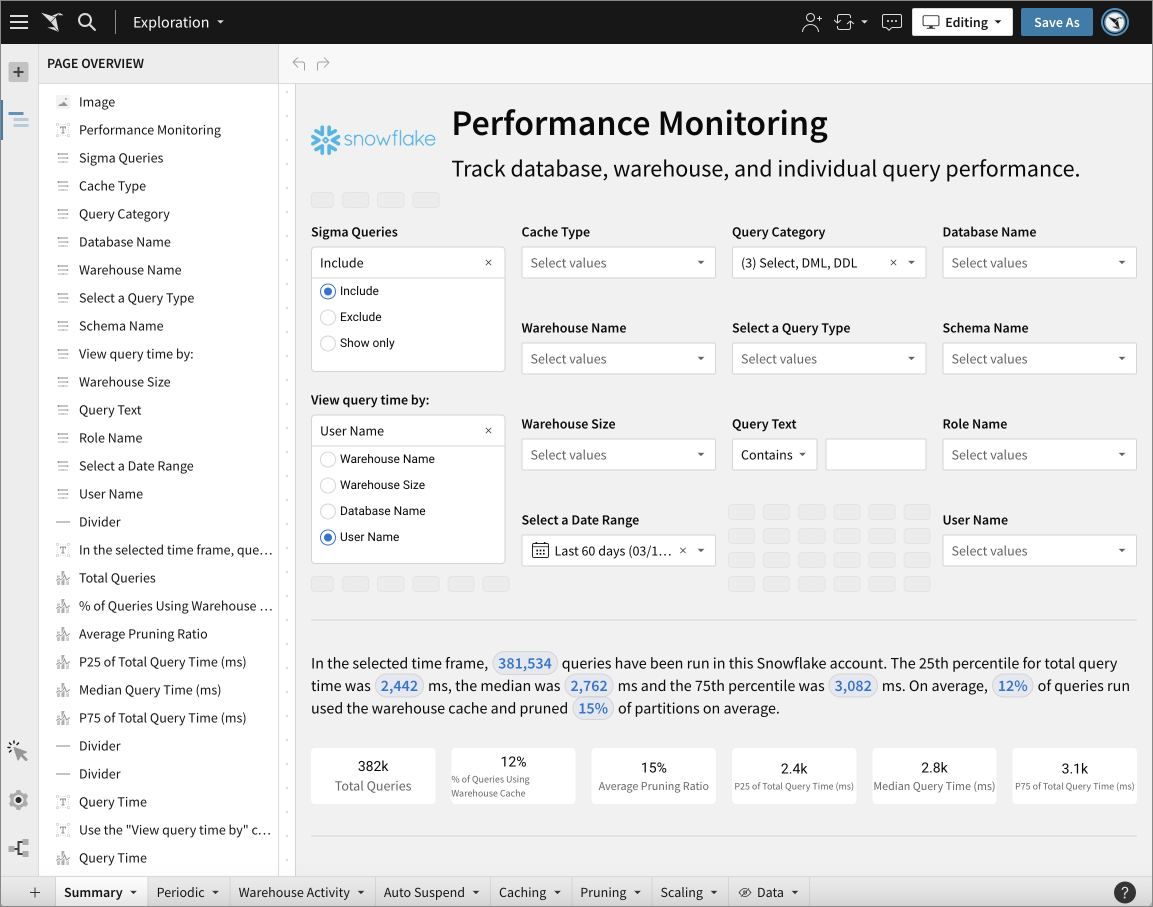
This page initially shows sample Snowflake usage data.
-
Click Swap Now to replace this sample data with your own Snowflake usage data.
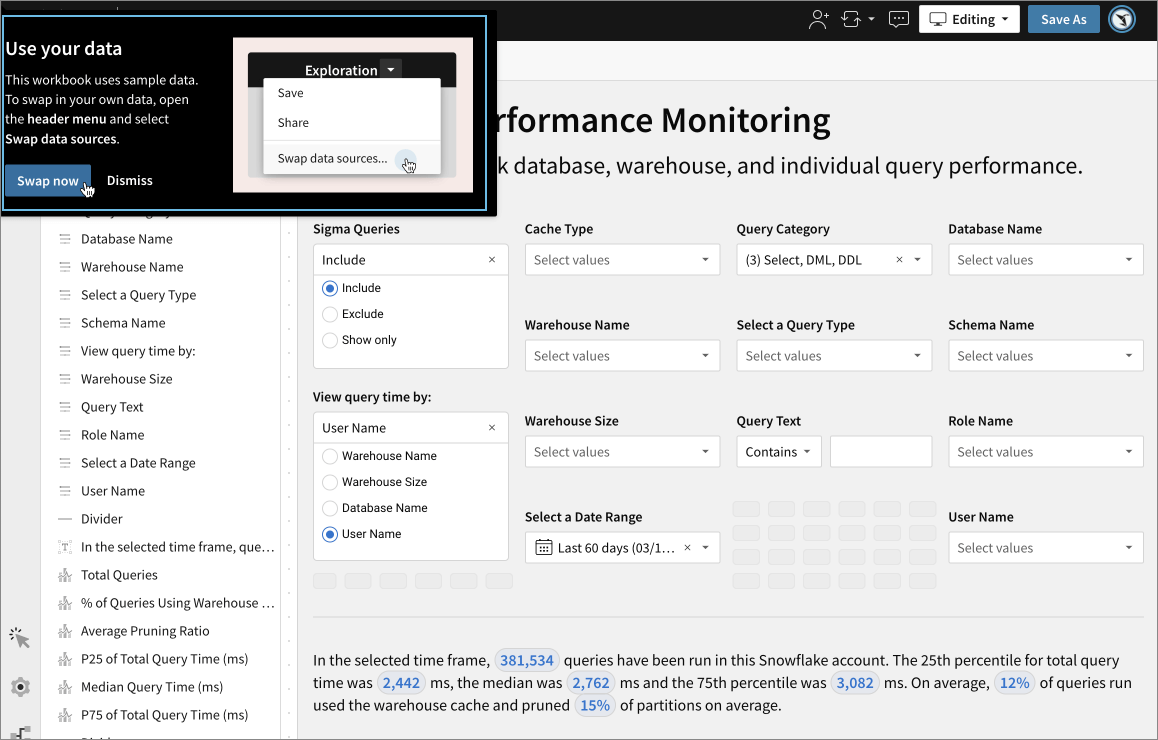
To view the workbook with sample data, click Dismiss.
-
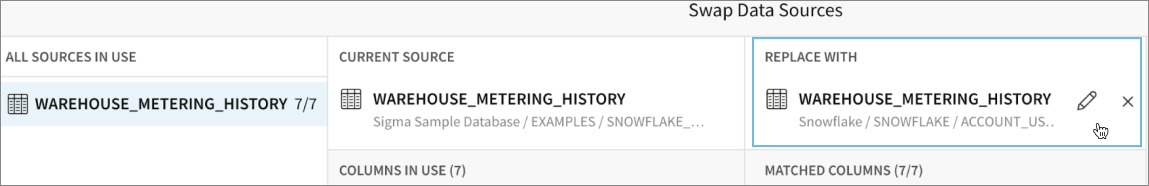
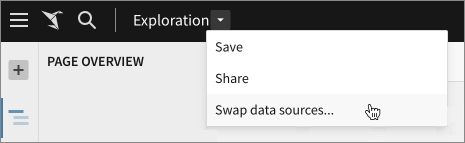
When you click Swap Now, it opens the Swap Data Sources page. Sigma searches your connections for tables that match the structure of the current sources.
Because Snowflake usage tables are consistent in structure, there should be a fully compatible match. If no match is found, you can manually locate the correct table.

-
In the Replace With section, locate the matched source you want to replace, then click Edit.
-
Select a new table from the modal.
-
When you locate the correct tables to swap, click Swap. The page refreshes, and displays your data.
-
Check the workbook to confirm that you have correct data.
-
To create an editable and publishable workbook from the template, click Save As in the header, and save your new workbook.
Known issues and Snowflake concepts
Slow upload or timeout
If your Snowflake Usage workbooks upload slowly or time out, you can improve their performance.
Slow load times and query timeouts are common when the warehouse struggles to respond to a request because of the complexity of queries that run on large tables of busy warehouses. In response to slow load times, Sigma will time out a request if the query is still running after 2 minutes.
To check on your query run times and view timeouts, visit your workbook's query display modal.
To improve your workbook's load time, filter the date to a smaller date range. Snowflake Organization and Account Usage tables are partitioned by time, so filtering by the date improves performance.
Errors when source swapping
You may experience errors or NULL data when swapping tables in templates. To avoid errors, ensure that the tables you swap are:
- From the same connection
- From the correct schema
- Not empty
To verify these, open the Swap Data Sources modal, and check the connection for each table.
Snowflake sometimes provides an ORGANIZATION_USAGE schema for secondary Snowflake accounts, but leaves it empty. The Cost monitoring template may refer to this empty scheme, resulting in errors. You can fix this by changing the source instructions to use the ORGANIZATION_USAGE schema of the primary account.
Snowflake organization vs. account
An organization is the main Snowflake object; it is effectively a collection of Snowflake accounts. It may contain one or many accounts, and only one of them is the primary account. This primary account has the ORGANIZATION_USAGE schema provided to it in the SNOWFLAKE database. The other (secondary) accounts, do not have access to this schema by default.
An account is a collection of warehouses, databases, users, roles, and so on. Each account is a child of an organization, and has its own ACCOUNT_USAGE and READER_ACCOUNT_USAGE schema. These schemas contain data for this account only, and no information about other accounts in the same organization.
Current data
After you launch a copy of the template that you attached to your own data, the Snowflake Usage Template always shows up-to-date data. The templates rely on the Snowflake-provided views that are managed by Snowflake, and deliver current data (up to few hours latency).
Updating templates
When Sigma updates the templates, and publishes a change to a shared template like the SUTs, all Sigma organizations with access to that template can see those changes for all new workbooks launched from that template. Workbooks created from the previous version of the template will not see the update.