
Dataset Worksheet Columns
Columns are central to working in Sigma. When you create a dataset worksheet, you can structure and format your existing columns, create column calculations, and sort and filter your data.
View columns in dataset worksheets
When working in the dataset’s worksheet, it will look like the screenshot below. This view provides you two ways to immediately start working with your columns: the worksheet spreadsheet and the column view panel. When changes are made from one of these two components, your column(s) will automatically update in the other.
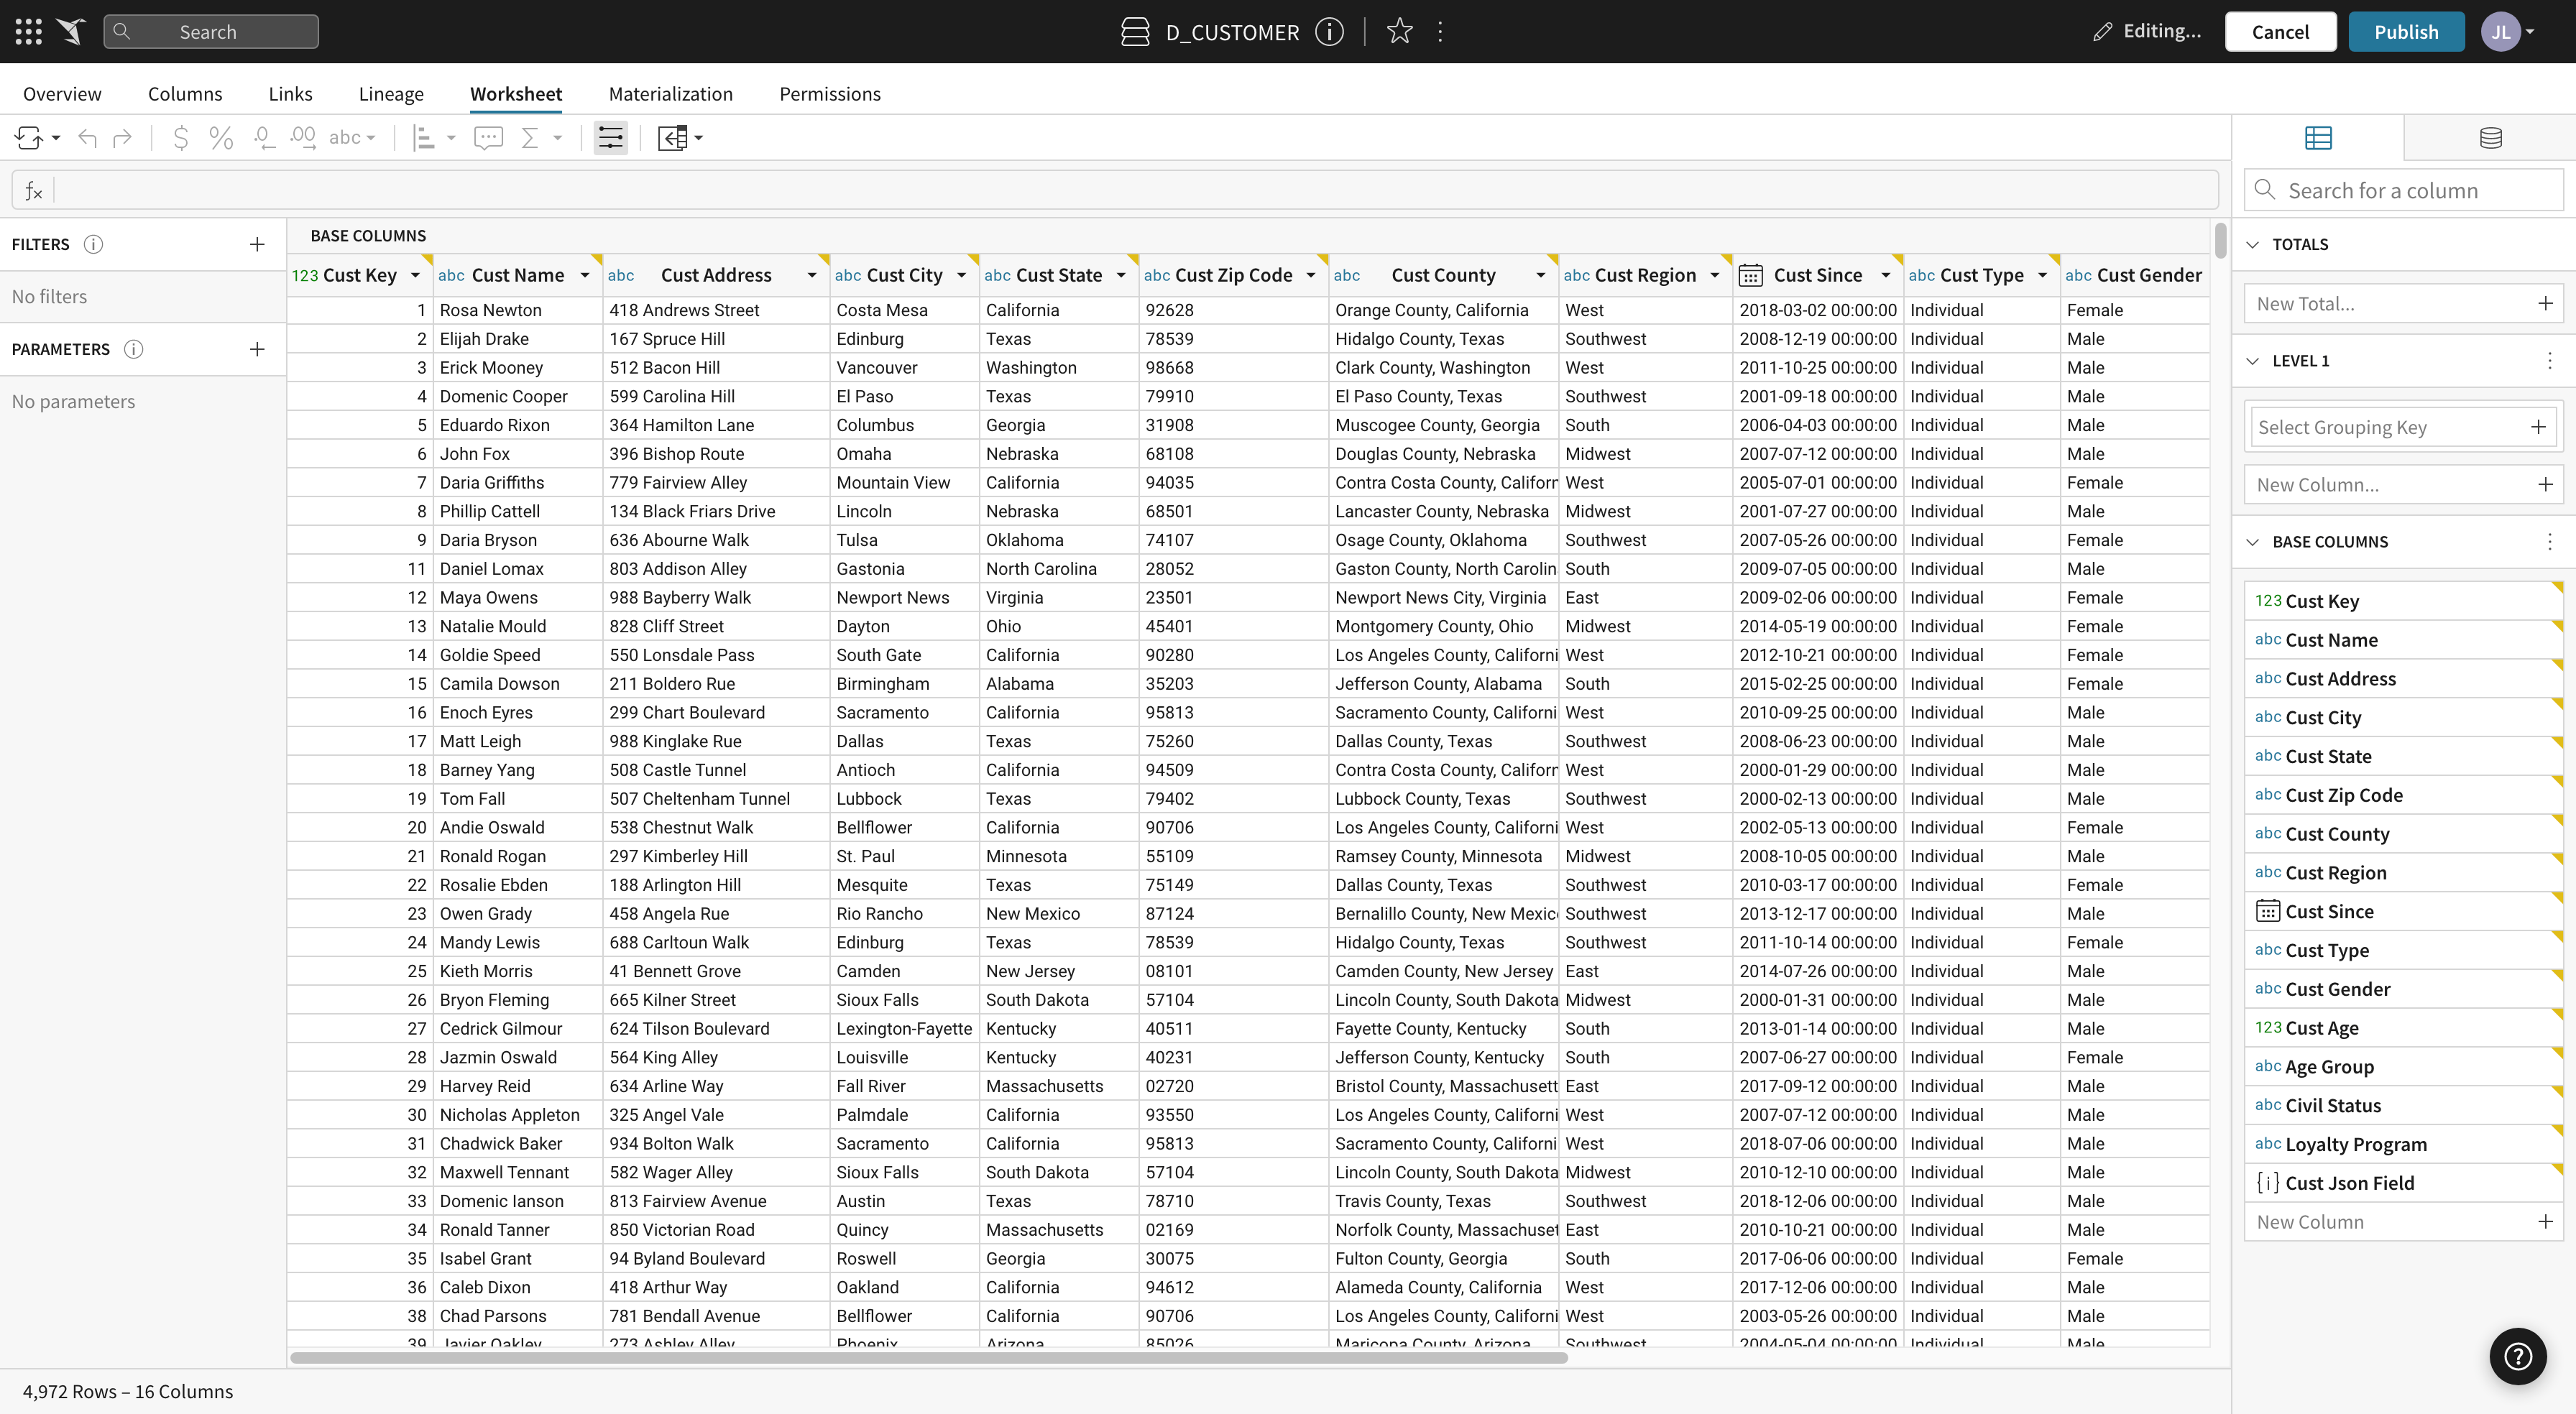
The spreadsheet interface
The worksheet spreadsheet interface is centrally located to provide an interactive spreadsheet-like interface. All column actions can be initiated from this table using the column menu.
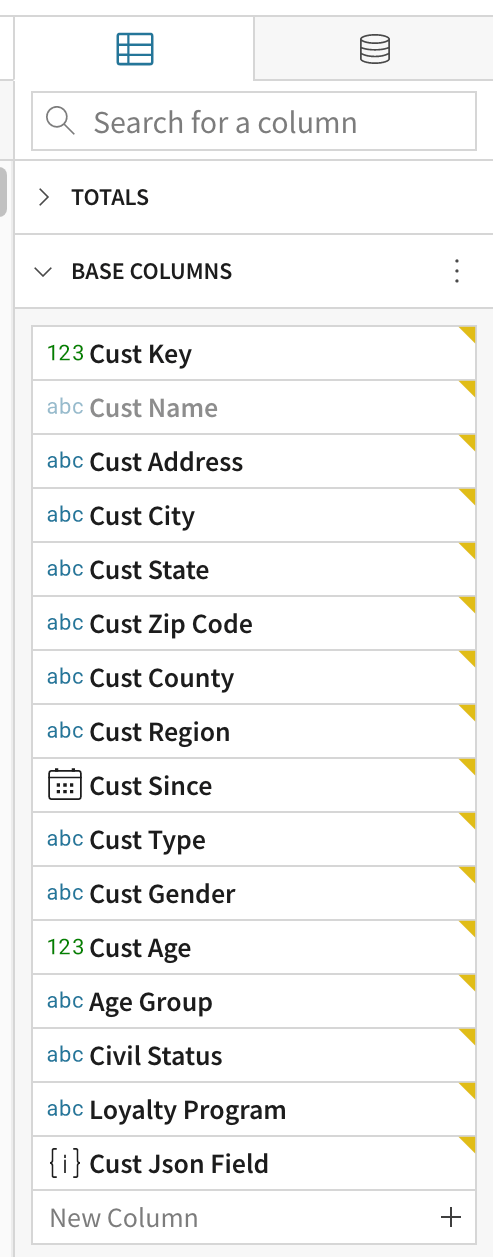
The column view panel
The column view panel can be found on the right side of your worksheet. It shows a high level editable view of your worksheet’s columns. Use this panel to search for columns and group data into levels. Like the spreadsheet, each column also has a column menu.
Column details
Column details are available for all worksheet column types, except Json. To see details and statistics about an individual column, open the column menu and select Column Details....
Contents of the modal vary depending on column type; however the overarching structure remains consistent.
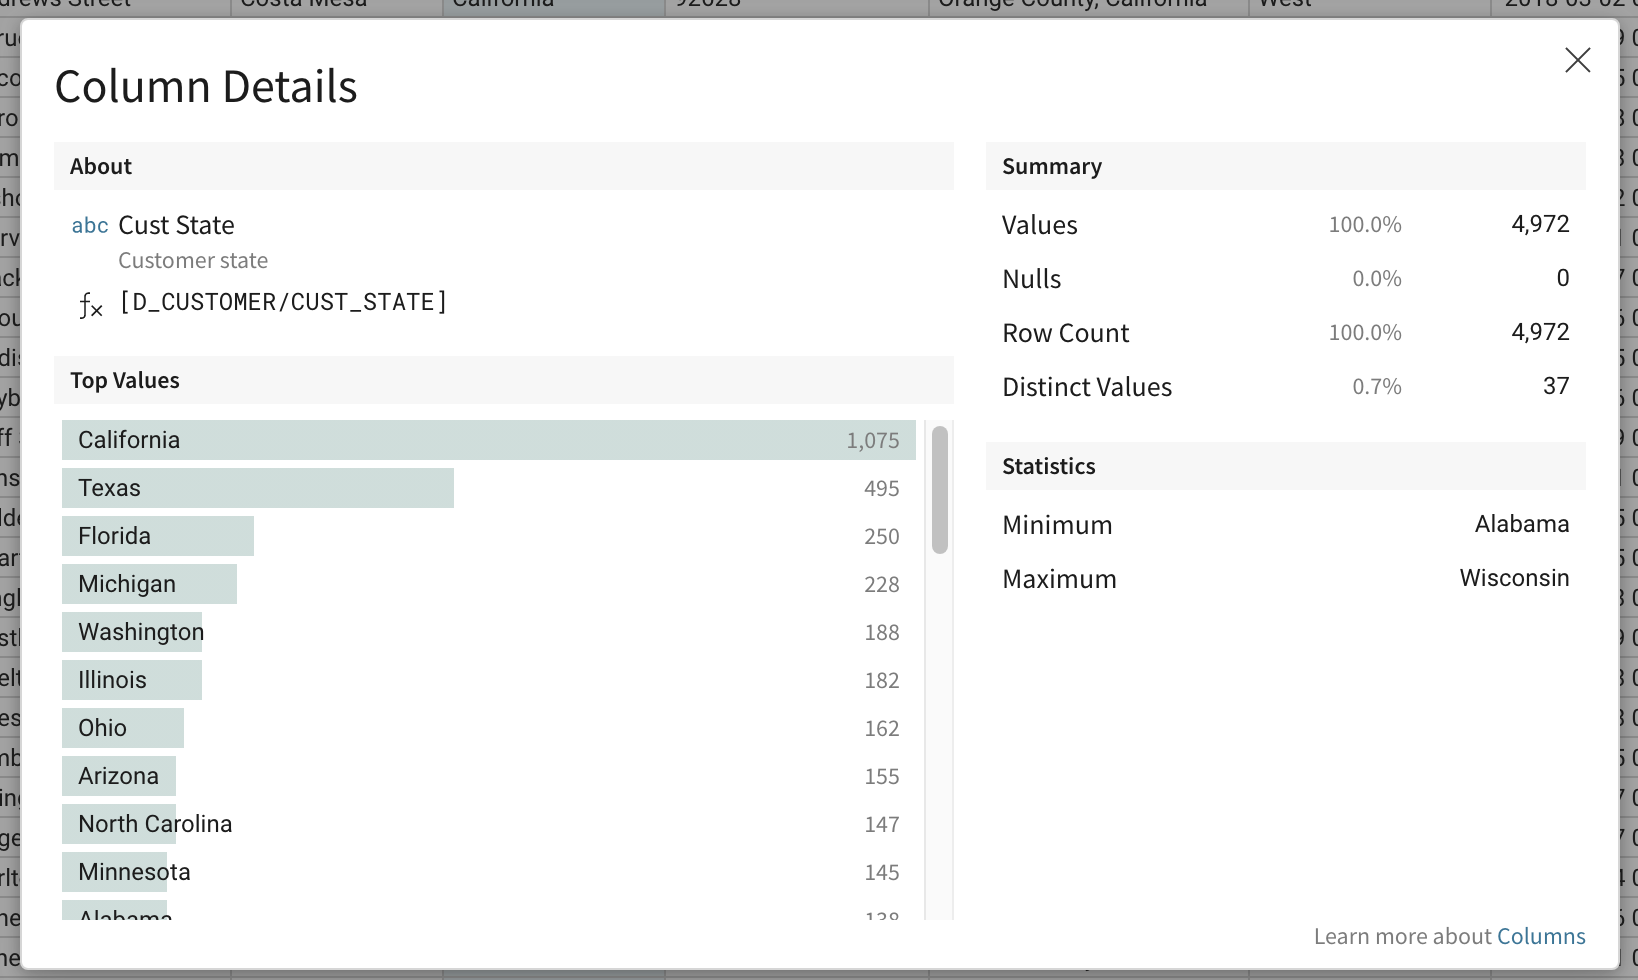
About
This section lists column type, name, and formula (fx).
Values
This section displays visual representations of the columns data. The Top Values list contains the column’s most common values. This information is available for Text, Number, and Date columns. A Value Distribution histogram is also available for Number and Date columns.
Summary
This section lists key column totals: Values, Nulls, Row Count and Distinct Values. The percent column delineates the percentage of count out of total rows in the column.
- Values - The total number of non-null values (see Count)
- Nulls - The total number of null values (see CountIf and IsNull)
- Row Count - The total number of rows in the column, regardless of value
- Distinct Values - The total number of unique values (see CountDistinct)
Statistics
This section lists a variety of column statistics. Minimum and Maximum values are displayed for Date and Text columns. These and all other stats listed below are available for Number columns.
- Minimum - The column’s minimum value. Depending on column type, this will be the lowest number, the oldest date, or the first Text value when sorted alphabetically (see Min)
- 25th Percentile - The number of values in the bottom 25th percentile of the columns values (see PercentileCont)
- Median - The midpoint in a sorted list of column values. (see Median)
- 75th Percentile - The number of values in the bottom 75th percentile of the columns values (see PercentileCont)
- Maximum - The column’s maximum value. Depending on column type, this will be the highest number, the newest date, or the last Text value when sorted alphabetically (see Max)
- Average - The average of all column values (see Avg)
- Standard Deviation - The column’s computed standard deviation (see StdDev)
- Variance - The column’s statistical variance (see Variance)
Work with existing columns
Column Menus
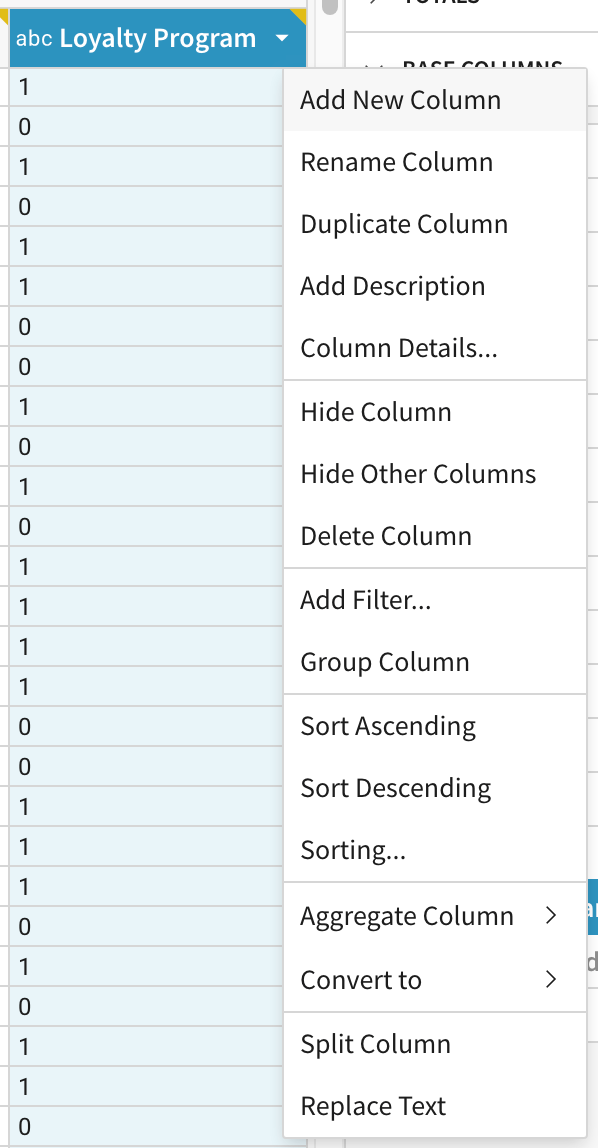
Column menus allow you to directly manipulate your worksheet's data. A few common column actions are sorting, formatting, hiding, deleting, filtering, and aggregating data.
A column’s menu can be found next to the column’s name in the worksheet spreadsheet and in the column view panel. To open the menu, hover over the column name and click the dropdown arrow that appears.
Formatting columns
- Open the column menu on the column you would like to format.
- In the dropdown, hover over Format.
- Select a format from the submenu.
Note: Format options are dependent on the column’s value type.
Sorting columns
Individual columns can be sorted both ascending and descending directly from the column’s menu. Open the worksheet sort modal from any column’s column menu to define multi-column sorting.
Moving columns
Individual columns can be moved using drag and drop. This is possible in both the spreadsheet interface and the column view panel.
Renaming columns
To rename a column, double-click on the column’s name or select Rename Column from the column menu.
Changing the name of a column in Sigma does not change its name in the database.
Adding column descriptions
To add or edit a description to a column from the column menu:
- Open the column’s menu.
- Click Add Description.
- Enter a description in the text input box.
- Click Save.
To add or edit a description from the worksheet toolbar:
- Select the column.
- Click the description icon in the worksheet toolbar.
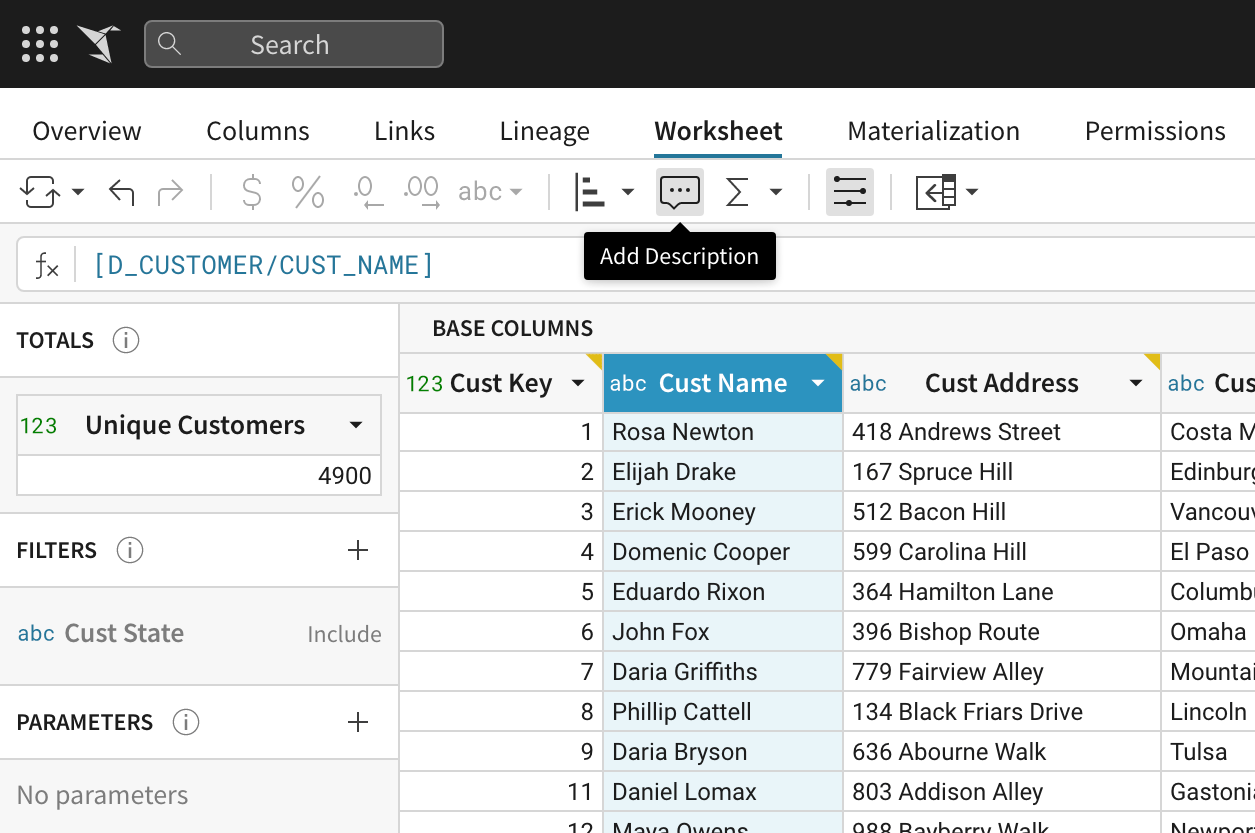
- Enter a description in the text input box.
- Click Save.
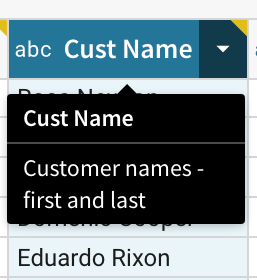
Viewing column descriptions
Columns with descriptions can be identified by a yellow marker in the top left corner of the column header. Hover over the column header to view the description.
Hide or unhide columns
Columns can be hidden using the 'Hide Column' action in the column menu. Hidden columns are not visible in the spreadsheet. However, they are still visible and actionable from the column view panel. In the column view panel, hidden columns display "grayed-out" compared to their visible neighbors (see 'Billing Country' in the screenshot below).
To unhide a hidden column, select the Unhide Column action from the column's menu.
You may also choose to use the Hide Other Columns action. This will show the selected column(s) and hide all other columns in the worksheet.
Hidden columns are only hidden from the spreadsheet. They can still be used elsewhere in the worksheet, such as in visualizations, filters, and calculated columns.
Delete columns
Columns can be deleted using the 'Delete Column' action in the column menu.
Deleting a column will remove any related filters, effect any referencing visualizations, and break any referencing calculated columns.
As is the case with all worksheet column actions, deleting a column will not effect the data in the underlying data source.
Multi-column selection
Multiple columns can be selected from both the spreadsheet and the column view panel. To select a range of columns, hold down the shift key when clicking the second endpoint in the range. To select and deselect multiple columns individually, hold down ⌘ as you click each column.
To perform actions on your selected columns, open the column menu on any selected column. Not all column actions can be applied multi-selected columns.
Creating and calculating columns
Adding a New Column
To inject a new column into the middle of the table, select Add New Column from the menu belonging to the column located directly before where you would like to place your new column.
To add a new column at the end of the table or as the last column in a grouping level, click on the associated Add New Column button in the column view panel.
Use the formula bar
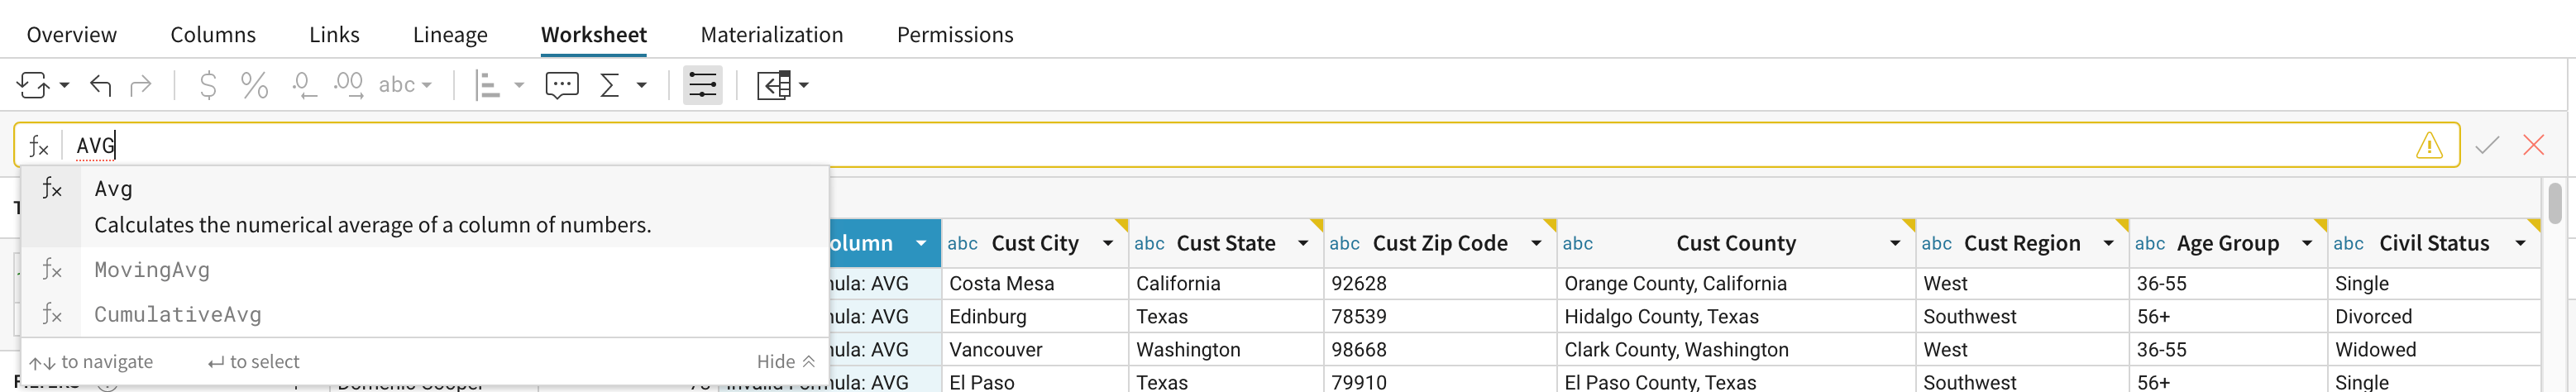
The formula bar is central to calculating data in worksheets. It is located near the top of the worksheet, above the spreadsheet and below the toolbar.
The formula in the formula bar always belongs to the column selected in the worksheet. No formula will be displayed if no columns or multiple columns are selected.
To calculate a new formula, first add a new column. Then type in your formula into the formula bar. As you type, it will suggest auto-completed function names and column names. After you complete your formula click Enter or click the green check to the right of the formula bar.
Working with level groupings
Group your data:
- On the right hand side of the screen, find the name of the column that you would like to Group By. Drag the column up to the box that says Select Grouping Key.

- Using the column menu, accessed by clicking the arrow on the right hand side of the column names at the top or side of the worksheet, you can easily create an aggregate column. When you create an aggregate column, it automatically nests under the next level Group.
If you Group by Holiday, and then create an aggregate column that sums your sales data, the new column will display the total sales per Holiday. - You can create additional groups as well. Locate the name of the column you want to group by in the list of column names on the right hand side of your screen. Click and drag the column name up above the Base Columns list, and an option to add a new level will appear. The worksheet will now show you two levels of data groupings. You can create aggregate columns of data under all of the group levels.
Collapsing levels
Collapsing levels helps you see only the data you need. You can collapse and expand levels by clicking the double arrows at the left of the Base Columns label.
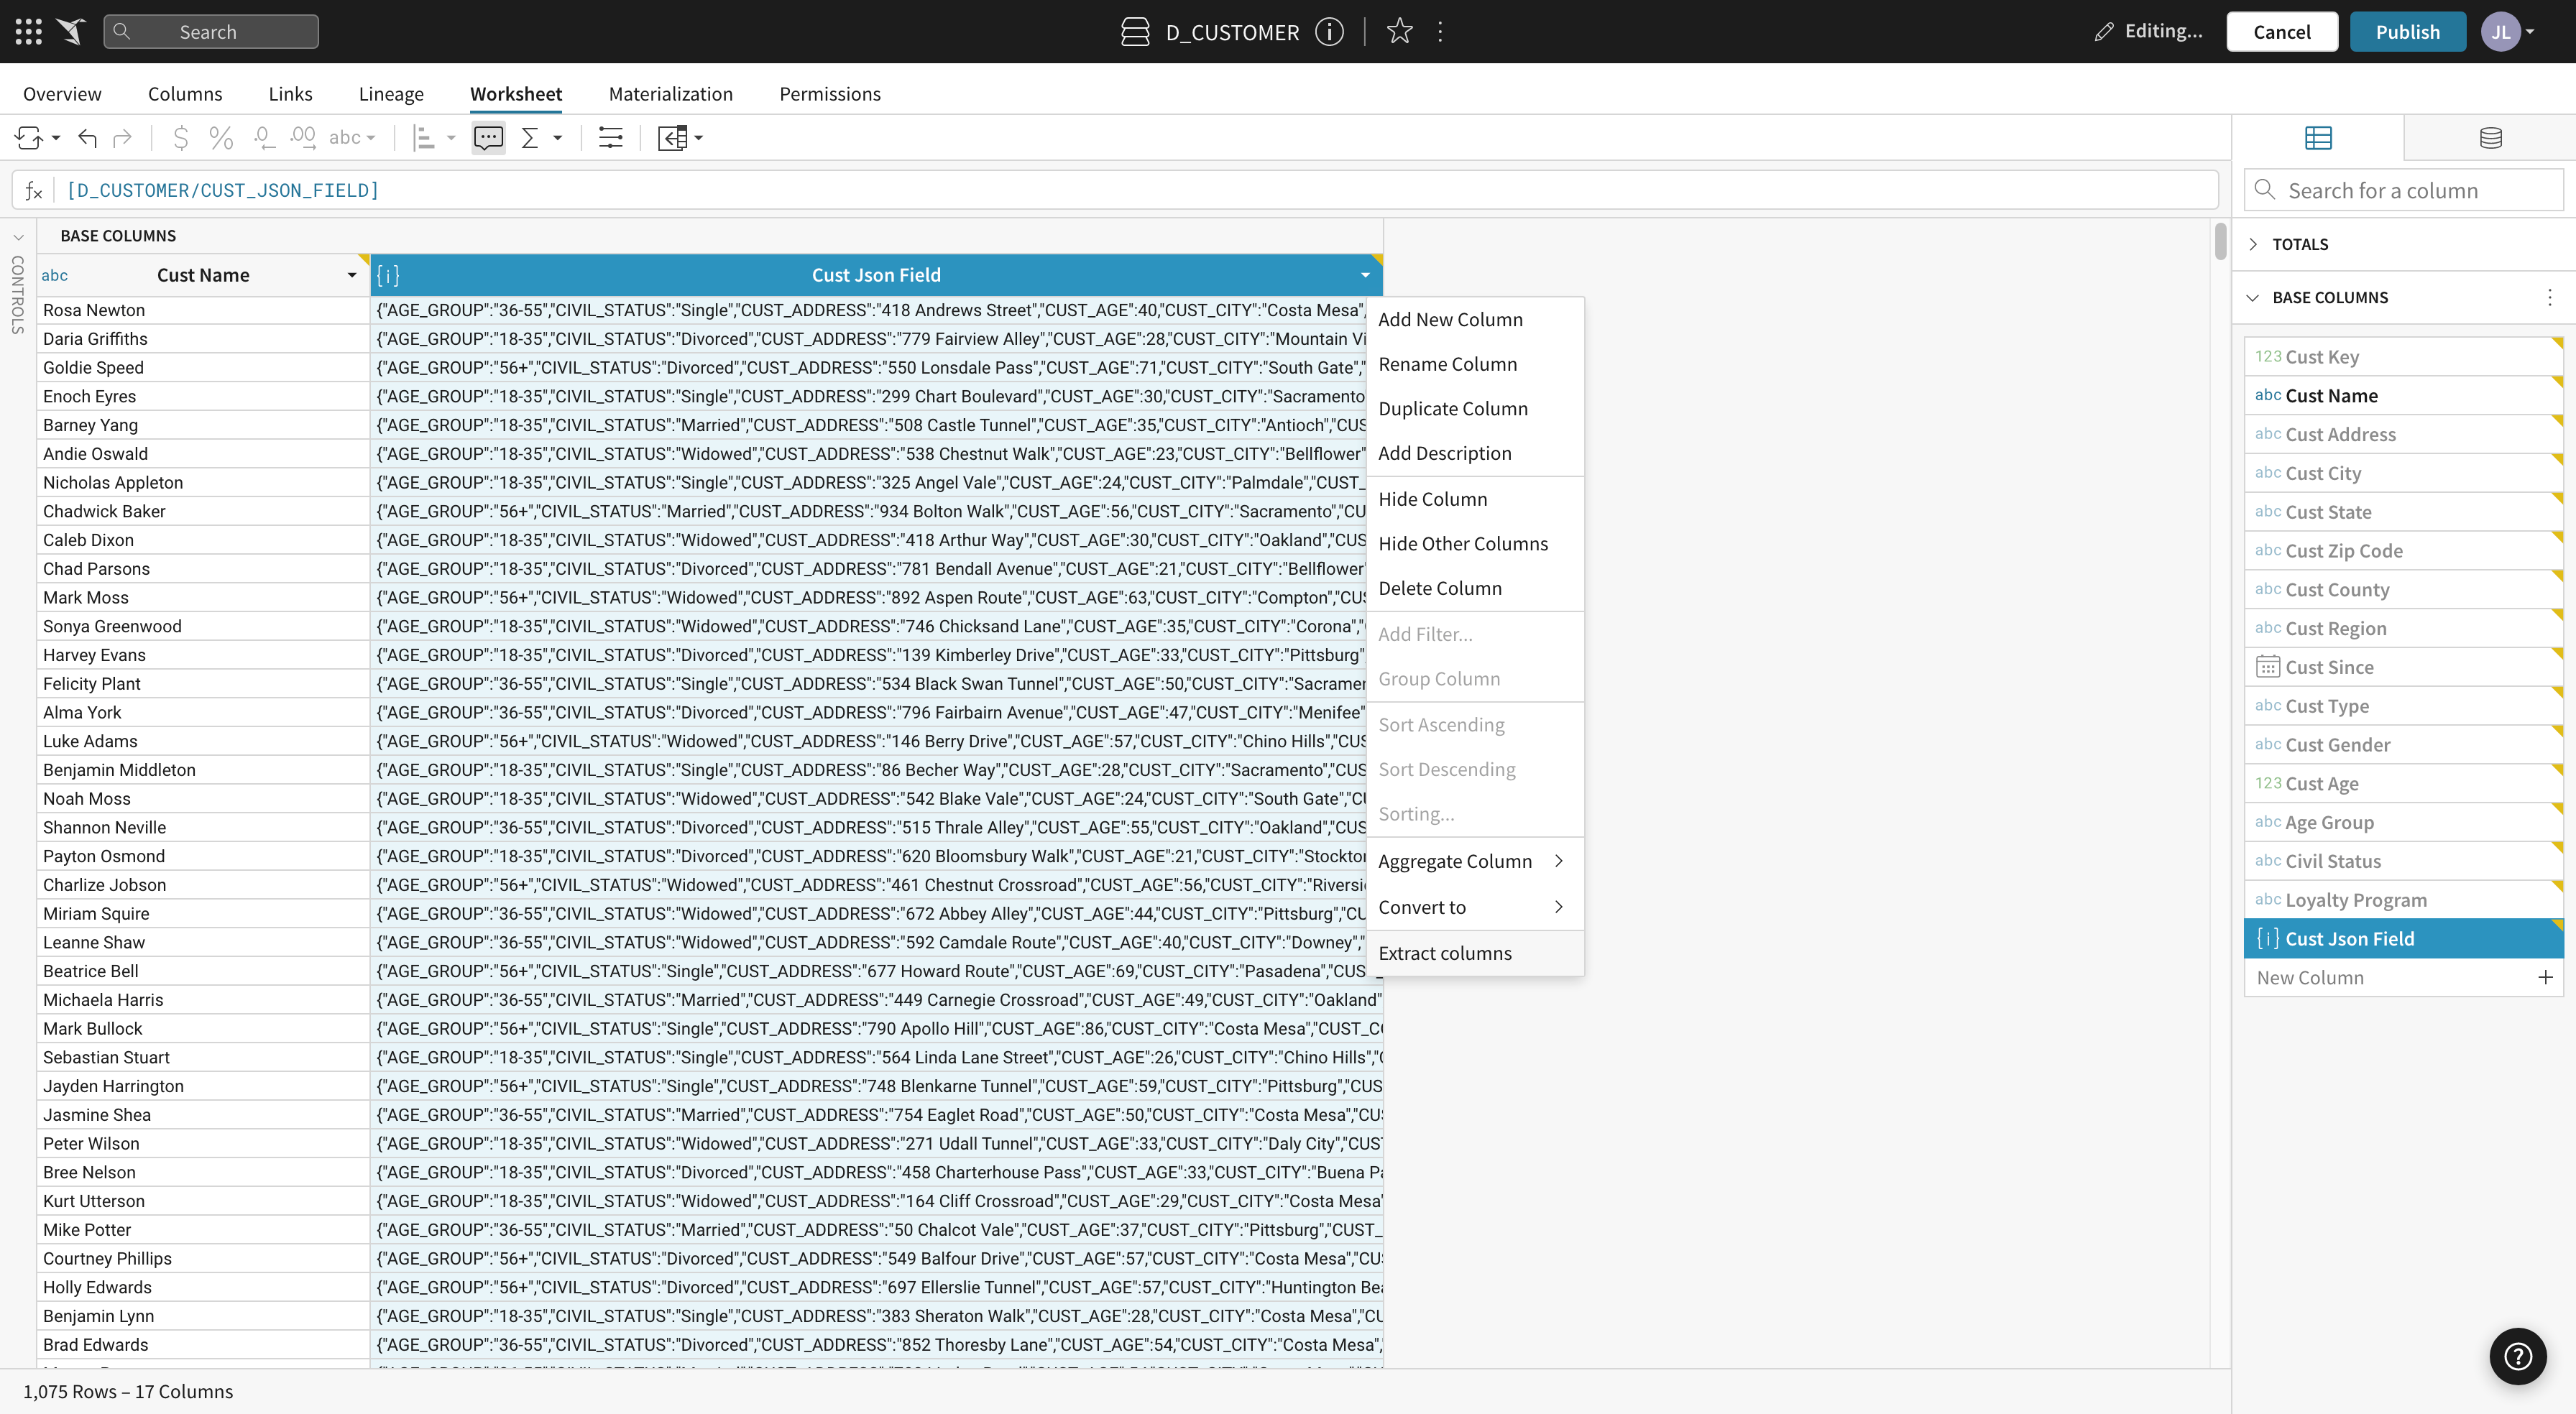
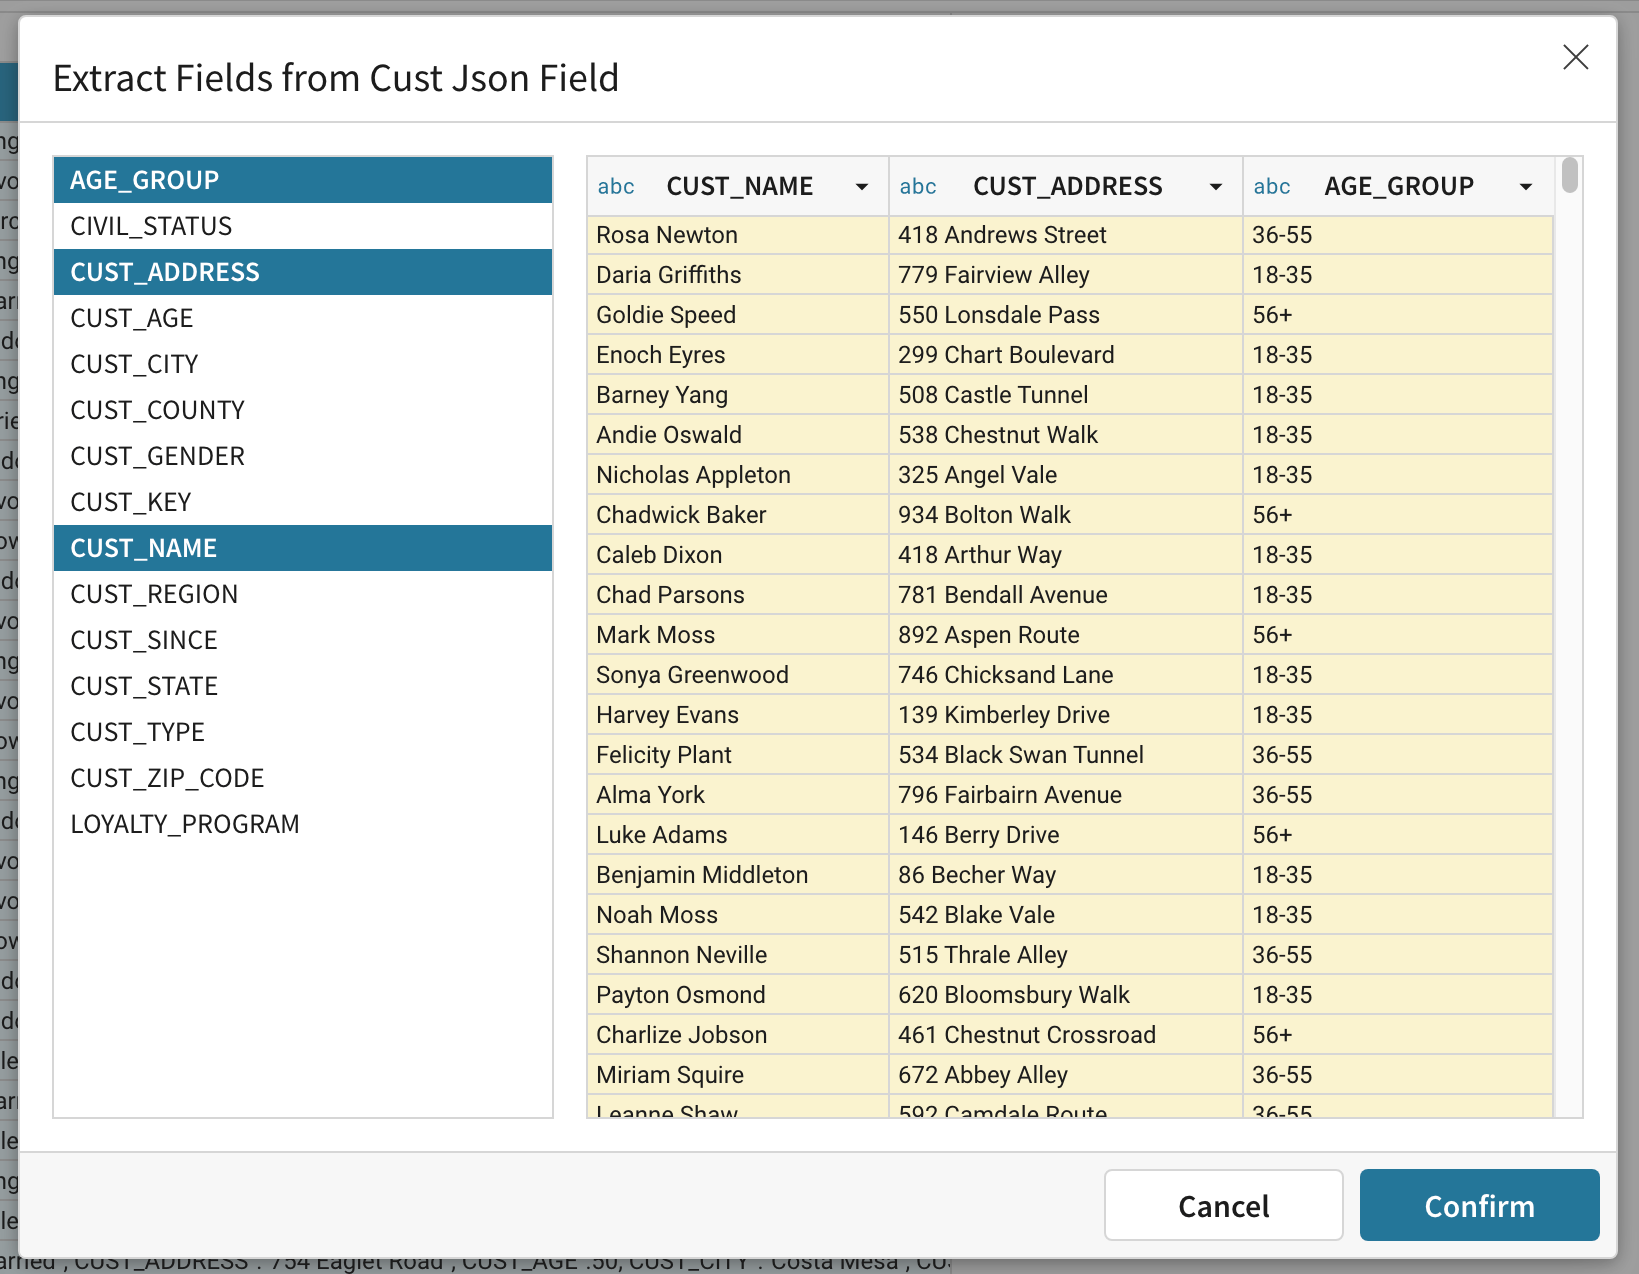
Extract semi-structured data
When Sigma detects JSON or Variant column types, ‘Extract Columns’ becomes and option in the column menu. If your data is semi-structured and you don’t see the ‘Extract Columns’ option, you can use the type function JSON or Variant to change how Sigma interprets the column of data.
Updated 10 months ago