
Examine workbook and data model queries
When you open a workbook or data model, Sigma generates and runs optimized SQL queries to retrieve data from your connected data platform. The query results are returned securely to your web browser.
You can review the query syntax and other details for queries run during your browser session by opening the Query history for a workbook or data model. For details about query history for datasets, see Examine dataset queries.
Query history displays an overview of recent queries performed from the workbook in your user session, including the runtime and current status of the queries. You can dig deeper into individual queries to view the underlying SQL, gather a request ID for troubleshooting, and investigate any errors.
View recent queries
Query history displays recent queries run from the workbook or data model during your existing session. The list of individual queries for the document automatically shows details for each query.
- In the document header, next to the refresh data button, click More options.
- Select Query history.
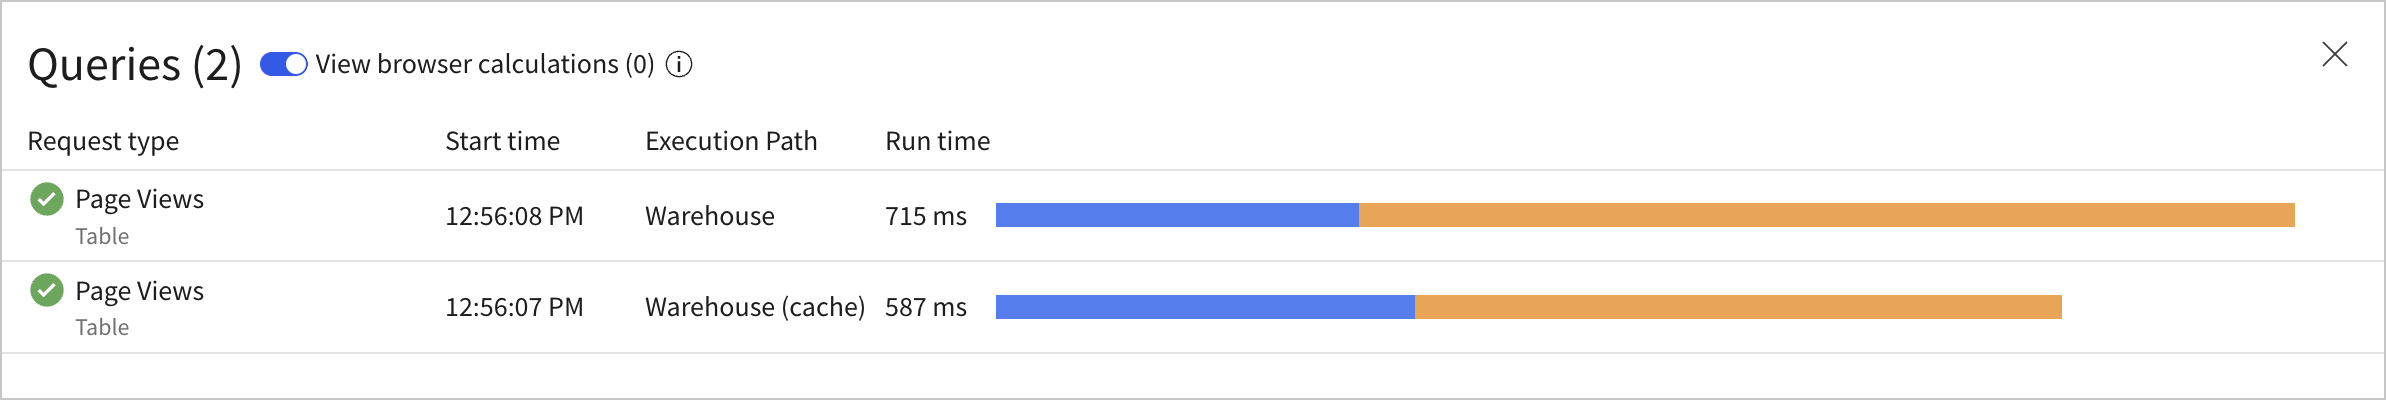
View browser calculations
Some queries return results from your data platform, others from the results cache in your data platform, and other results are returned from your browser cache.
By default, the calculations performed in your browser are hidden from the query history because they are not sent to the data platform. To view the browser calculation history, do the following:
- In the document header, next to the refresh data button, click More options.
- Select Query history.
- At the top of the Query history modal, turn on the View browser calculations toggle.
- Review the Execution Path column for Browser entries.
For more details on browser calculations, see Query execution path details.
View individual query details
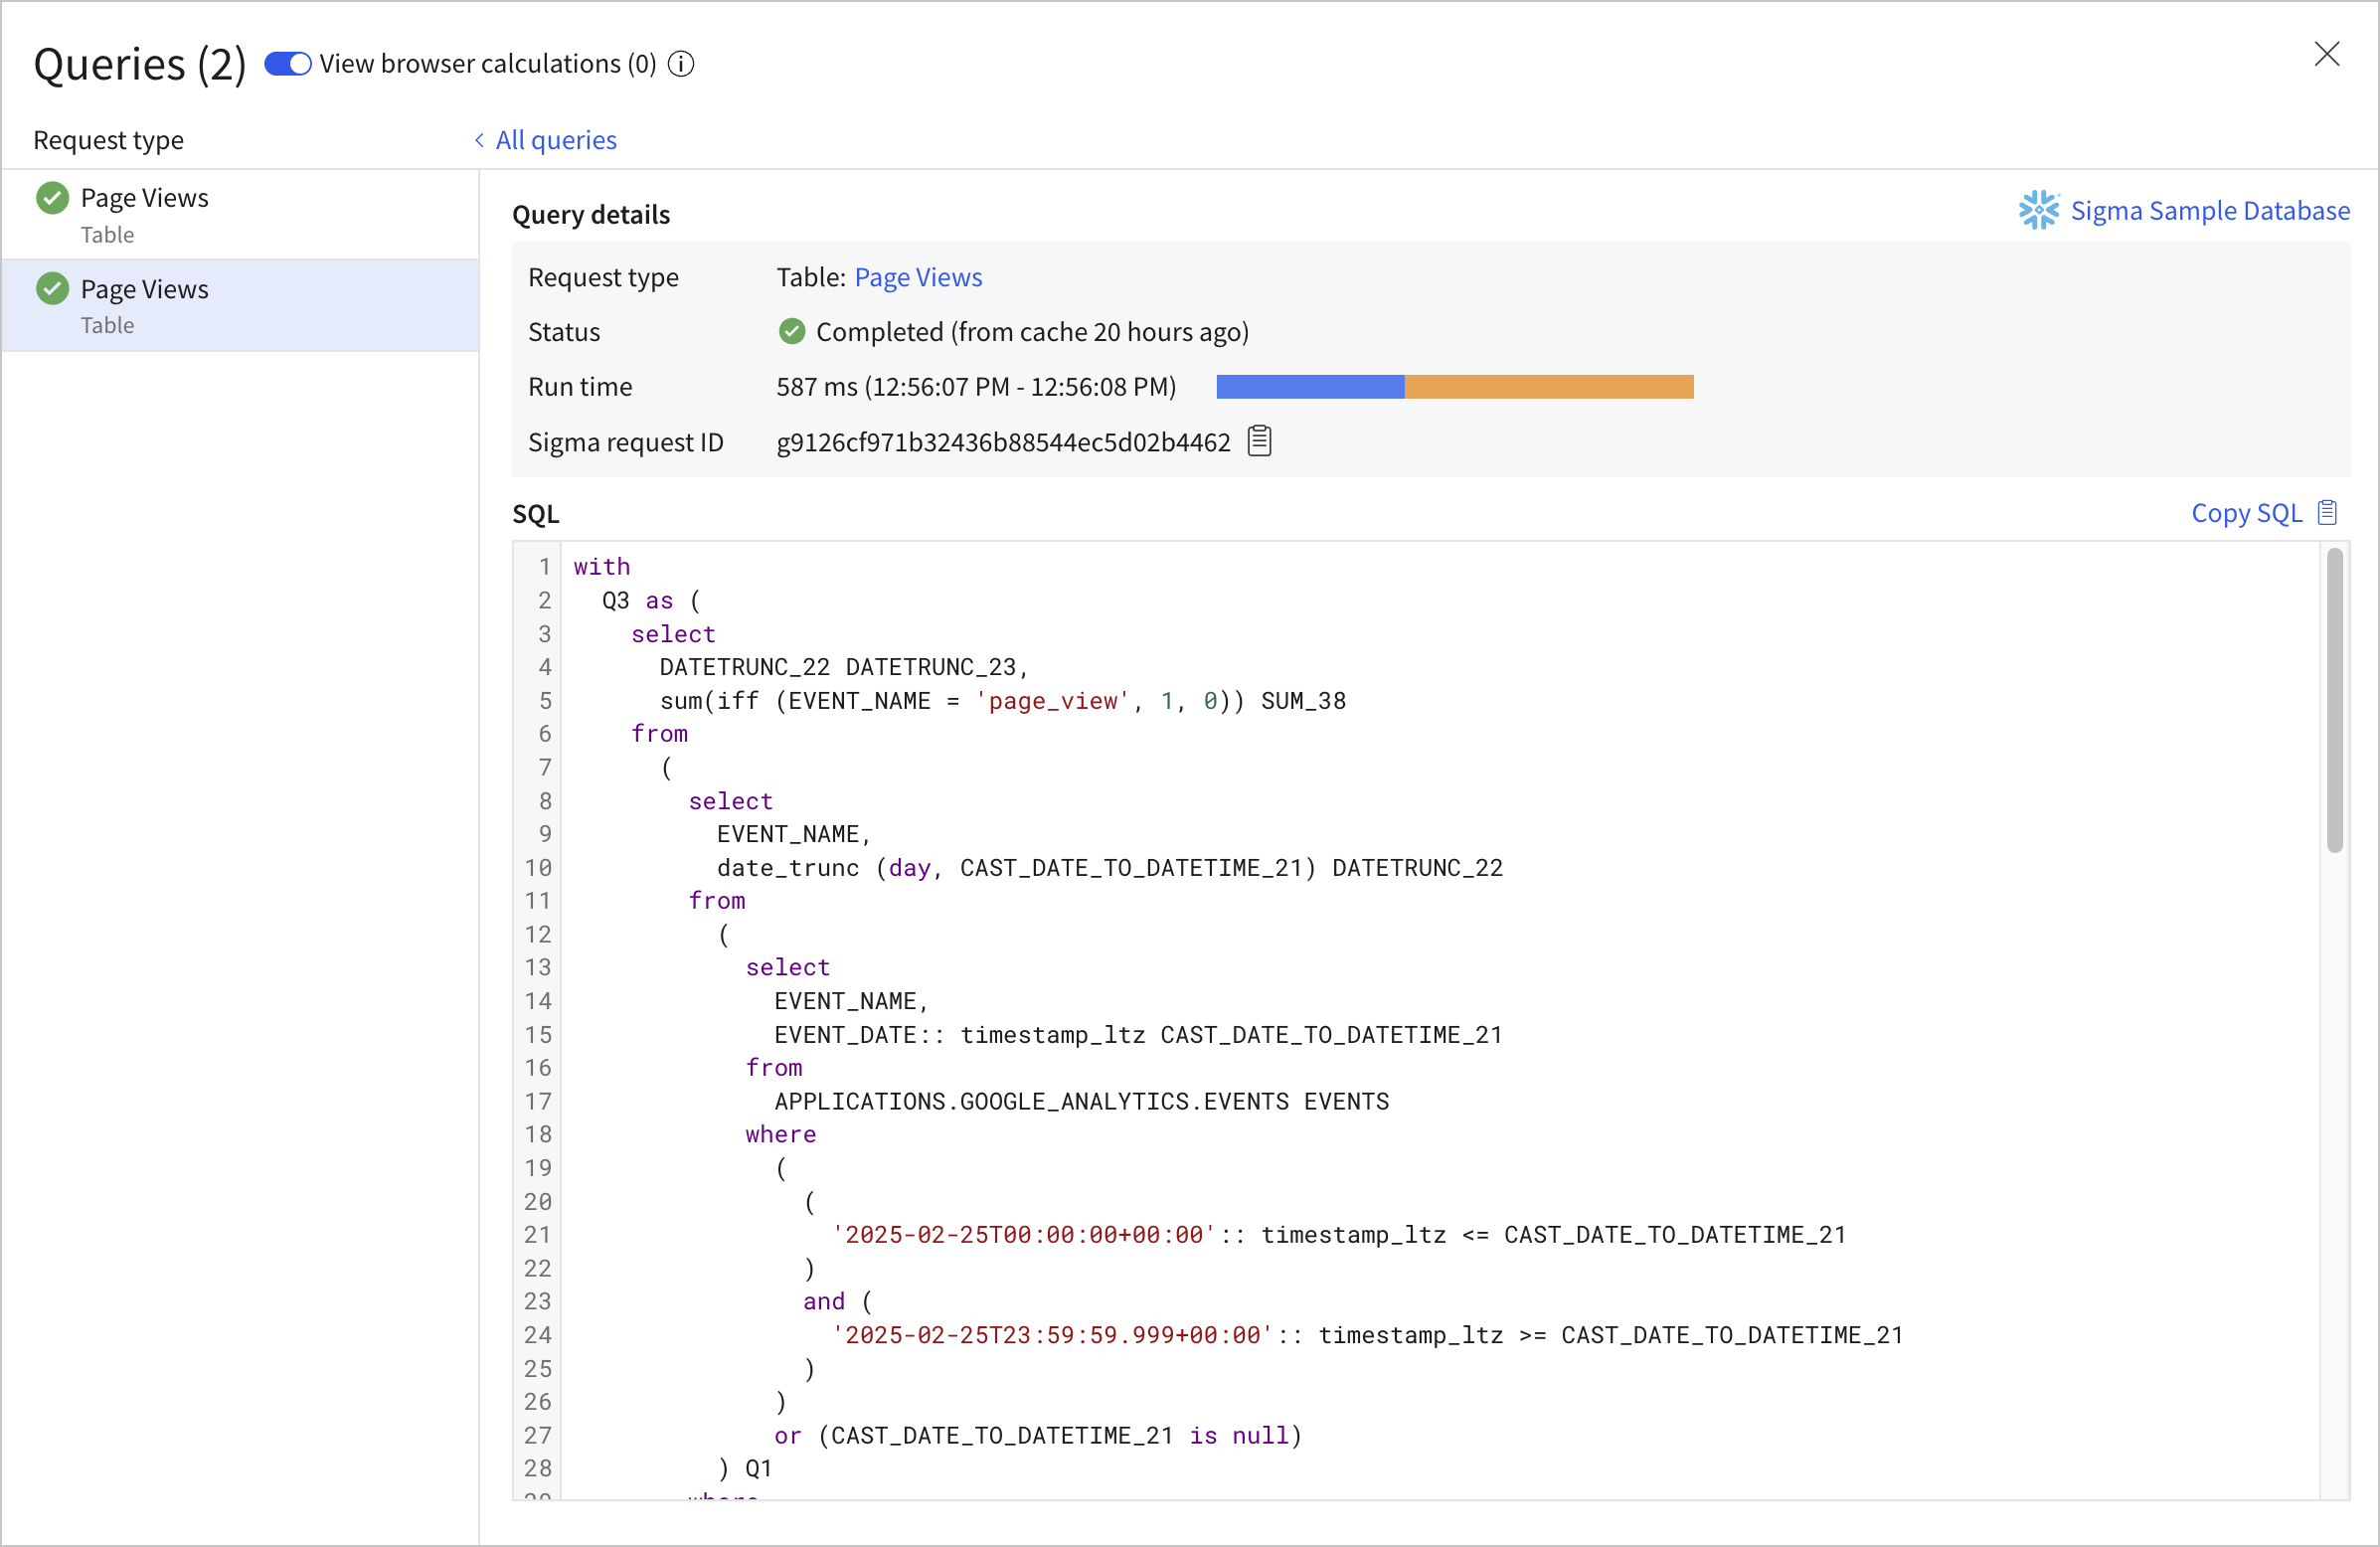
To view details of an individual query, such as the generated SQL, full run time, or a request ID for troubleshooting, do the following:
-
In the document header, next to the refresh data button, click More options.
-
Select Query history.
-
Select the query that you want to examine. Sigma displays details for the selected query:
-
Explore the query detail view:
- Select the element name to open the data element for which the query was run.
- Review the run time and duration.
- View and copy the generated SQL.
- For a failed query, review the error message.
- Copy a request ID to share with Sigma Support when troubleshooting.
For more details, review the Query history reference.
Pause and resume queries
To make changes to your document without automatically running queries against your data platform, pause queries:
-
In the document header, next to the refresh data button, click More options.
-
Select Pause queries.
To resume running queries after pausing queries, select Resume queries.
Query history reference
For more details on statuses, run time, request type, and execution path details, see the following sections:
Query status types
The following query statuses can occur within Sigma:
| Status | Details |
|---|---|
| The query ran successfully. | |
| The query is currently running. By default, Sigma sets query timeouts to 120 seconds (2 minutes). Organization admins can customize the query timeout for each connection. See Query timeouts. Export and download queries are not restricted by this timeout, and instead use a longer timeout. | |
| An error has occurred when running the query. Select the row to view the query details and the error message. | |
| Queries on the document are paused. To resume running queries to retrieve the latest data, click Refresh queries in the document header. | |
| – Canceled | The query was cancelled. This can happen if you change to a different document tab before the query finishes running, or if changes were made to the document before the query finishes running. |
Query run time
A detailed query run time breakdown is available for successfully completed and timed out queries. Query run times can vary due to network traffic, queue delay, or data platform processing time. The run time breakdown lets you review whether and at what stage your query encountered delays.
The run time is broken into three parts:
- Queue duration: The amount of time the query waits in Sigma’s queue before being sent to the data platform. For certain data platforms, the Sigma queue is used to limit the number of concurrent requests sent to the data platform.
- Sigma runtime: The amount of time Sigma takes to process the query, excluding queue duration and data platform time. Failed and cancelled queries attribute all run time to Sigma, even if the query failed due to a timeout in the data platform.
- Warehouse runtime: The amount of time between when Sigma sends a request to your data platform and when it gets a response back, which is roughly equivalent to the amount of time the data platform spent running your query.
- Result fetch time: The amount of time Sigma takes to retrieve the results from the data platform.
- Details unavailable: For some export queries, such as PDF downloads, run time breakdown details are not available.
Incomplete queries and download or export requests do not display a detailed run time breakdown.
If you have concerns with the run time of a specific query, such as a significant amount of queueing time, contact Sigma Support
Query request types
Sigma makes different types of optimized queries to the data platform to retrieve different types of information.
When examining the query history for your document, you might see some of the following request types:
| Request type | Details |
|---|---|
| Data Prefetch Query | Retrieve a data source used by the visible data elements. For example, run a query to retrieve the data source for 10 visible KPI elements, rather than running 10 individual queries to retrieve the data for each KPI element. |
| <Element name> <Element type> For example: EVENTS Visualization: bar | Retrieve the data for the element. |
| SQL Preview | Retrieve the data used to show a data model overview. |
| Filter Top Values | Retrieve top values, such as when viewing column details or opening a list filter for a data element. |
| <Element name> Count Rows | Retrieve the row count for an element, such as when retrieving column details or viewing a collapsed element in a data model overview. |
| <Element name> Column statistics | Retrieve column statistics, such as when viewing column details for a workbook or data model. |
| Export Query | Retrieve the latest data to perform a scheduled or on demand workbook, page, or element export. |
| <Element name> Export Query | Retrieve the latest data to download an element to a raw data format, such as CSV or JSON. |
Query execution path details
Depending on what data is available to Sigma, the execution path of a query might be different:
| Execution path | Details |
|---|---|
| Warehouse | Retrieve data by directly querying the data platform with an optimized SQL query. |
| Warehouse (cache) | Available for specific data platforms, perform a query to retrieve data from the query results cache of the data platform using a query ID. For more details, see Set a query ID cache duration. |
| Warehouse (materialized) | Retrieve data by querying a materialized table. See About materialization. |
| Browser | Retrieve data from the browser cache and perform calculations using alpha query. For more details, see Caching and data freshness. |
For more details, see Caching and data freshness.
Updated 5 months ago