MovingAvg
The MovingAvg function calculates the average of values in a moving window with specified start and end boundaries.
This function must be used with aggregated data in a grouped table. For a detailed video walkthrough that uses this function, see Advanced window functions.
Syntax
MovingAvg(column, above, [below])Function arguments
| column | The column to reference when calculating the moving average. |
| above | The number of rows above the current row to set the start boundary of the moving window. |
| below | [optional] The number of rows below the current row to set the end boundary of the moving window. If undefined, Sigma applies a default of |
Notes
- MovingAvg is a position-based calculation, which determines a moving window based on the relative positions of rows. For stable output, ensure the table contains a sorted column.
- If the above or below argument is a negative integer, the function counts rows in the reverse direction when determining the boundaries of the window.
Examples
A table is sorted in descending order by week and contains a column of weekly sales for the past year. You can use the MovingAvg function to calculate the average of weekly sales based on a defined moving window. The following examples demonstrate different methods of averaging values in the Weekly Sales column.
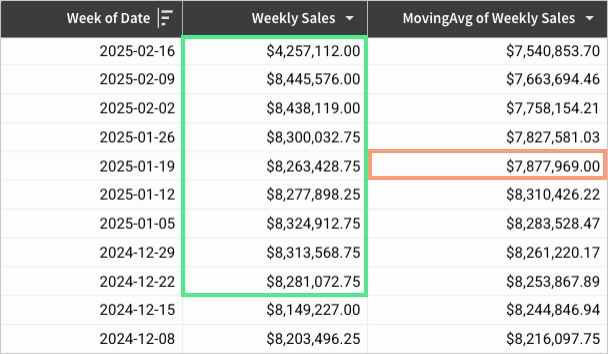
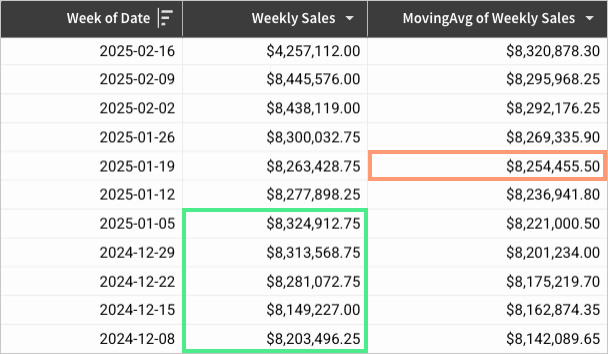
Example 1
MovingAvg([Weekly Sales], 4)Returns the average of values in the current row and four rows above it. Because the optional below argument isn't specified, the function defaults the value to 0 and the calculated window doesn't include any rows below the current row.
This example places more weight on future weeks, and fewer values calculated for the output in the first few rows.
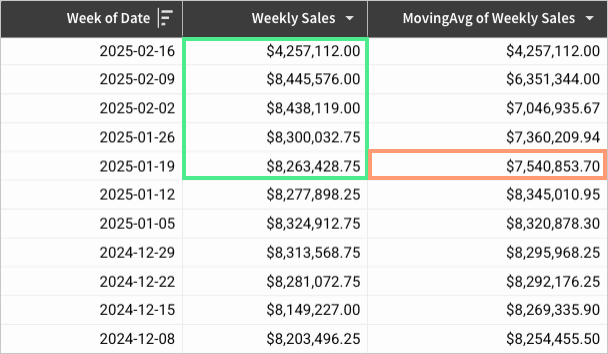
Example 2
MovingAvg([Weekly Sales], 0, 4)Returns the average of values in the current row and four rows below it. Because the above argument is set to 0, the calculated window doesn't include any rows above the current row.
This example places more weight on past weeks (which can be helpful in forecasting), and fewer values are calculated for the output in the last few rows.
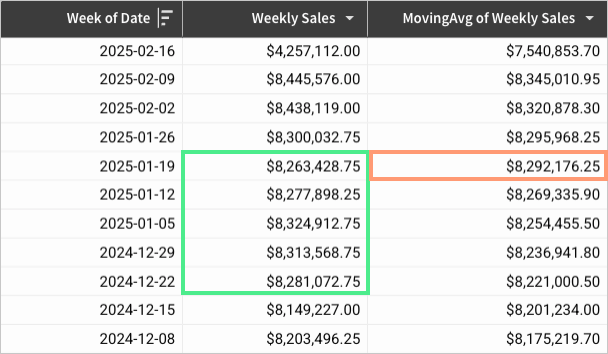
Example 3
MovingAvg([Weekly Sales], 2, 2)Returns the average of values in the current row, two rows above it, and two rows below it.
This example balances past and future weeks, which can smooth out fluctuations to minimize variance.
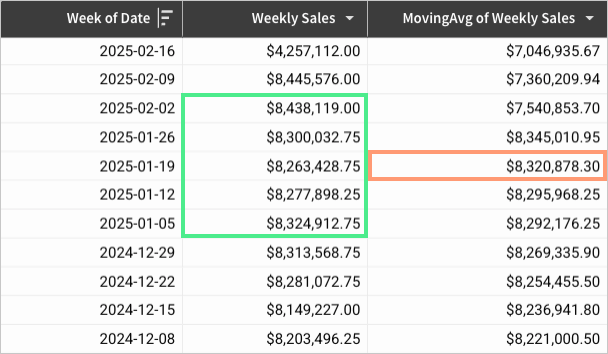
Example 4
MovingAvg([Weekly Sales], -2, 6)Returns the average of values beginning two rows below and ending six rows below the current row. Because the above argument is set to -2, the function counts rows in the reverse direction when determining the start row of the calculated window. As a result, the current row and the row immediately below it are not included.
Example 5
MovingAvg([Weekly Sales], [weeks-after], [weeks-before])Returns the average of values in a window with dynamic start and end boundaries determined by Number input control values that can be adjusted in real time.
This example enables adaptive, context-driven calculations that support flexible scenario analysis. It can be applied to time series analysis to capture trends, seasons, cycles, noise, etc.