
Lead
The Lead function accesses data in subsequent rows in the same result set, without having to join the table to itself. It references the column and returns its values in the offset position, shifting the output up by a fixed number of rows.
The Lead function typically shifts values up, while the Lag function shifts values down.
Syntax
Lead(value, offset, default)
These are the function arguments:
- value
- Required
- The column of values that the function shifts
- offset
- Optional
- The number of rows that the output shifts
- This number must be constant (the same) for all rows
- Must be an integer greater than
0 - Default, if omitted, is
1 - default
- Optional
- The value to return in the row(s) at the beginning of the table, which don't have a valid offset index
- Default, if omitted, is
Null
Examples
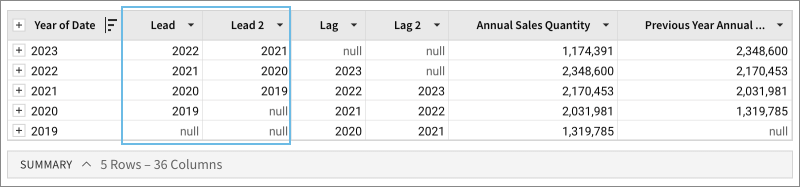
Lead([Year of Date])
Lead([Year of Date],2)
In these examples, the column Lead shows the offset lag as the default of 1 row and the default is null, while column Lead 2 shows the offset lag as 2 rows and the default is null.
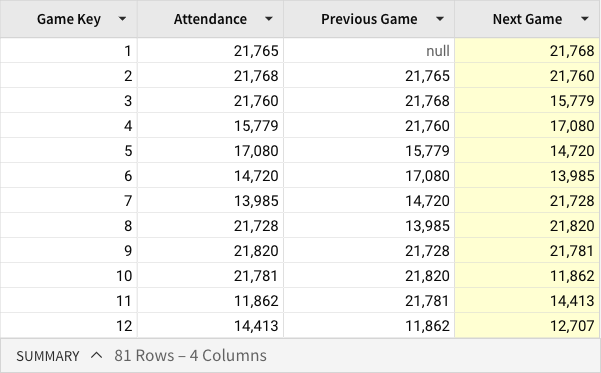
Lead([Attendance], 1)
A table lists the total attendance for each game of an MLB team's 2021 season. You can use the Lead function to compare this value with the number of attendees recorded for the next game.
The formula references the Attendance column and shifts its values up one row. The resulting output in each row of the Next Game column indicates the number of people who attended the game that occurred immediately after the one referenced in the Game Key column.
Updated 10 months ago