
Create and manage tables
Tables are the fundamental way to interact with data in Sigma. You can add tables from connected data warehouses, data models in Sigma, or upload a CSV-formatted file.
If you're familiar with traditional spreadsheet tools, you might be used to working with data and formulas in cells. Sigma tables are very spreadsheet-like, but data is managed at the column level instead of at the cell level. As a result, calculations and formatting changes are applied to every cell in a column.
Managing data at the column level ensures consistency and accuracy, and helps prevent common errors across large sets of data.
In Sigma, you can also group columns in tables , making it easy to perform aggregations at different levels without creating a complex pivot table.
Create a table
To create a table, follow the steps to create a data element. See Create a data element.
After you create a table, you can expand your analysis by adding columns:
- Add a calculated column to a table
- Add a data source column to a table
- Add a column via lookup
- Add a column via period-over-period analysis
- Extract columns from JSON or variant data
Add a calculated column to a table
You can add a calculated column to a table using any of the Sigma functions. You can perform basic calculations, such as creating a Profit Margin column based on Profit and Sales columns, or you can perform more complex tasks such as conditional evaluations using If or data cleaning using Coalesce.
All calculations are performed on the column level using the formula bar. You can view the formula used to calculate a column by selecting the column in a data element and reviewing the formula bar. If you do not select a column, the formula bar is empty.
Prerequisites
- To add a column, you must have either Can edit or Can explore access to the document.
- This action uses the editor panel. If you have not done so already, open the editor panel while customizing or editing a document.
Add a calculated column
To add a column to a table, do the following:
- Select the table, then locate the columns list in the editor panel.
- Next to the Columns header, click
 Add column....
 - Select Add new column to add a new calculated column to the table and change the focus to the formula bar.
- Enter a formula into the formula bar. Suggested function names and column names appear as you type.
- After you finish writing your formula, press Enter or Return on your keyboard, or click the checkmark next to the formula bar to save your formula. The column updates with the result of your formula.
- (Optional) Double click the default column name or open the column menu (
 ) to rename the column.
Add a data source column to a table
When you add a table to a document, such as a workbook or report, you might not have all columns included from your data source. You can add a data source column to the table, or change the granularity of the source table to add more columns.
Only included columns are added to a table by default when you add a data source. Some columns, such as those with names that start with an underscore (_column_name) are available to be added but not included by default.
Prerequisites
- To add a column, you must have either Can edit or Can explore access to the document.
- This action uses the editor panel. If you have not done so already, open the editor panel while customizing or editing a document.
Add a data source column
-
Select the table, then locate the columns list in the editor panel.
-
Next to the Columns header, click
Add column.... -
Select Show source columns to select a column from the data source for the table.
-
Review the full list of columns available from the data source and select the checkbox next to a column name to add it to the table.
If you see a list of Unavailable source columns, your table might be based on a grouped source table, and only grouped columns are included. See Change the granularity of a grouped element data source
Group columns in a table
Group columns in a table to compare rows of data based on shared values within a column. You can use any column in a table to define a grouping and you can define multiple groupings.
A grouping is a structure in a data table that creates groups of rows that all share the same distinct value in the column that you’ve grouped by, and that enables you to create aggregate calculations based on those groups.
For a detailed example of using groupings in a table, see Example: Group website analytics by host name and calculate statistics.
Prerequisites
- To group columns, you must have either Can edit or Can explore access to the document.
- This action uses the editor panel. If you have not done so already, open the editor panel while customizing or editing a document.
Add groupings to a table
To group columns in a table, do the following:
- Select the table, then locate the columns list in the editor panel.
- Next to the Groupings header, select Add grouping... and choose the column you want to group by.
Add calculations to a grouping
To calculate an aggregate for each value in a group, rather than each value in a column, add calculations to a grouping:
- Select the table, then locate the columns list in the editor panel.
- For a grouping, next to the Calculations header, select Add calculation... and choose the column you want to aggregate for the group.
For example, some calculations are only relevant on the group level, such as Unique Users for each Host Name in a group.
Manage groups in a table
After creating a grouping in a table, you can do the following:
- Expand or collapse the grouped data by selecting the + or - next to the group column headers or values.
- Remove columns or calculations from the grouping by selecting the down arrow () to open the column menu and choosing Remove from grouping.
- To remove an entire grouping, next to Group by, select
 More > Remove grouping.
 - Hide collapsed columns. See Hide and show table components .
Show totals in a grouped table
Totals are hidden in a grouped table by default. To show or hide totals in a grouped table, for example to see subtotals for a grouping, do the following:
-
For a column in a grouping, select the down arrow (
) to open the column menu. -
Select <Column Name> totals.
-
Choose which totals to show or hide:
- For a table with one grouping level, choose Show grand total.
- For a table with one or more grouping levels, choose one or both of Show grand total or Show subtotal.
To show subtotals for a grouping, open the column menu for the first group-by column in the higher-level grouping.
You can also show or hide all totals in a grouped table, for example to show totals for all grouping levels. To show all totals, right-click a table cell to open the context menu and select Show all totals to show totals for all grouping levels of the table. If any totals are shown, first select Hide all totals, then select Show all totals to show all.
Example: Group website analytics by host name and calculate statistics
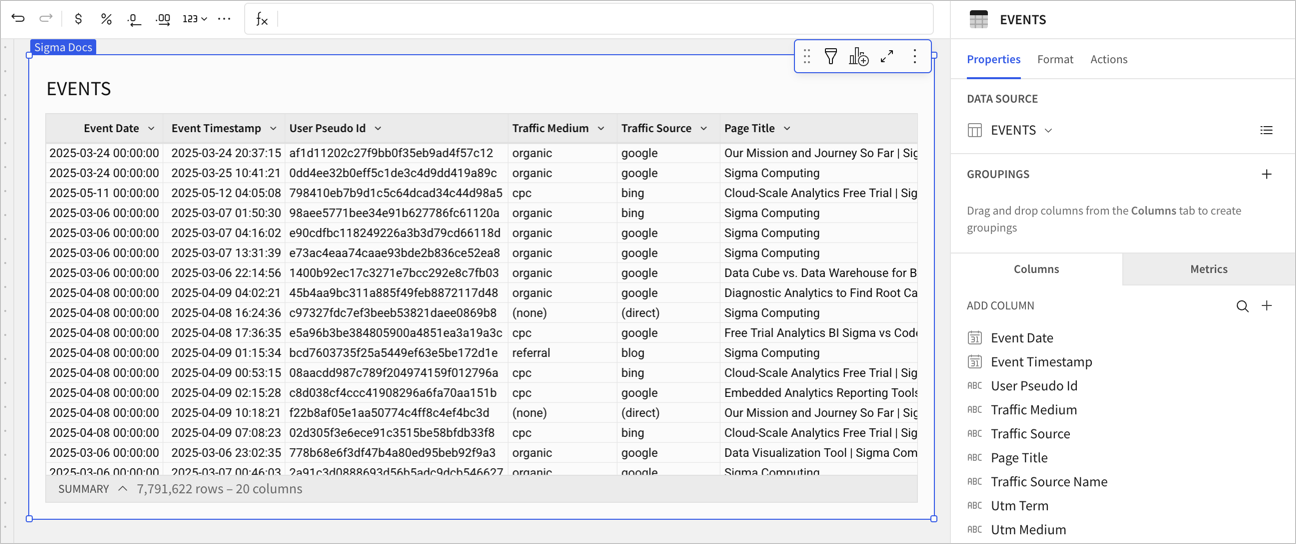
For example, you might want to use a table to view website analytics grouped by host name. In this example, create a host name grouping and add calculated columns within the grouping to calculate total page views and total unique users.
This example uses the Events table from the Sigma Sample Database. The full path to the table isAPPLICATIONS.GOOGLE_ANALYTICS.EVENTS.
-
Create a table with the Events table as the data source:
- In the Add element bar, select Data, then select Table.
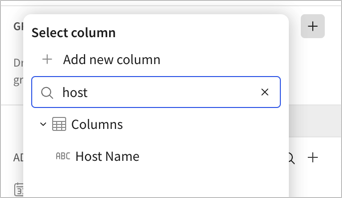
- For Select source, search or browse to the
APPLICATIONS.GOOGLE_ANALYTICS.EVENTStable in the Sigma Sample Database. - Select the data source to add the populated table to your document.
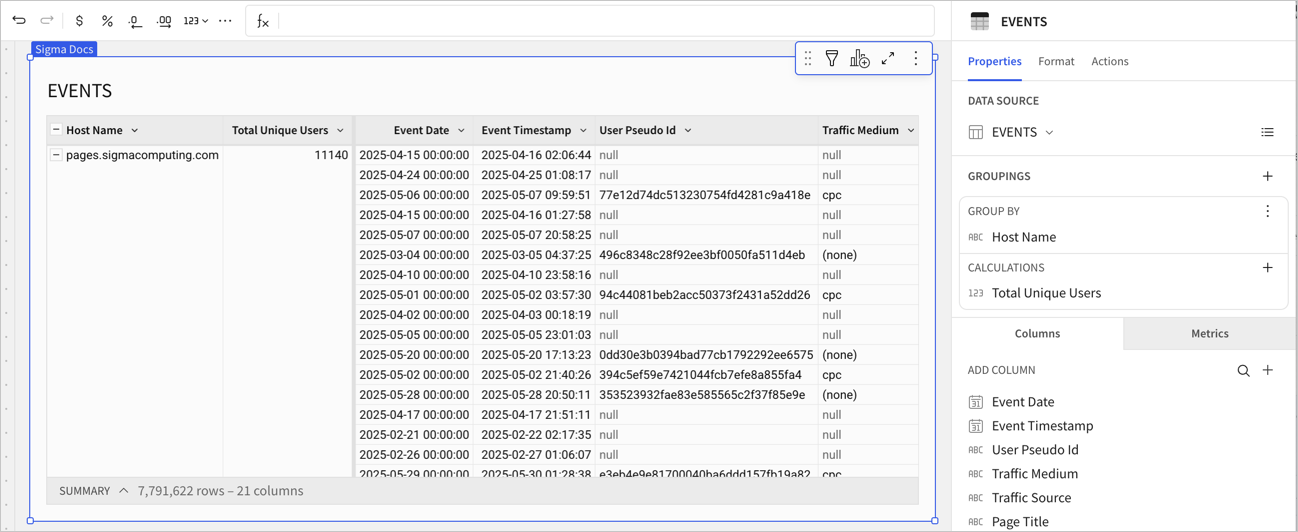
-
Next to Groupings, select
Add grouping..., then choose Host Name.
-
Within the grouping, next to Calculations, select
Add calculation..., then choose User Pseudo Id.
A calculated column is created as Count of User Pseudo Id. To update the column to look at unique users only, change the aggregate to CountDistinct:- In the editor panel, hover over the calculated column name and click the down arrow () to open the column menu.
- Select Set aggregate > CountDistinct. The column updates to CountDistinct of User Pseudo Id.
- Double click the column name to rename it Total Unique Users.
- In the editor panel, hover over the calculated column name and click the down arrow (
-
Within the grouping, next to Calculations, select
Add calculation..., then choose Event Name.
A calculated column is created as a Count of Event Name.
To modify the column to focus only on page views, type a new formula in the formula bar using the CountIf function:-
Select the Count of Event Name column.
-
In the formula bar, modify the formula from
Count([Event Name])to the following:CountIf([Event Name] = "page_view") -
Press enter or return on your keyboard, or click the checkmark to save the formula and update the column. The column name updates to CountIf of Calc.
-
Double click the column name to rename it Total Page Views.
-
-
On the table, next to the Host Name column, select - to collapse the ungrouped rows in the table and view only the grouped data.
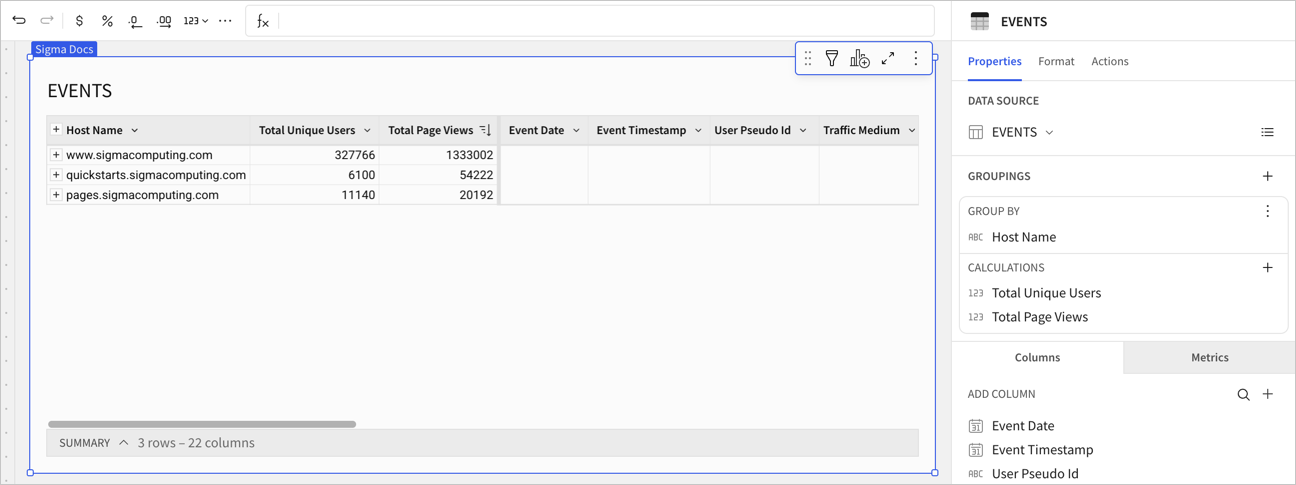
-
To make the table easier to read, you can sort the columns by total page views. For the Total Page Views column, click the down arrow (
) to open the column menu, then choose Sort descending ( ).
).
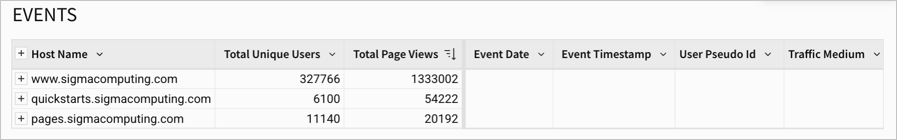
You now have a table with total page views and unique users for each host name, sorted by total page views. You can make more formatting changes, such as hiding the collapsed columns, by formatting the table. See Format and customize tables.
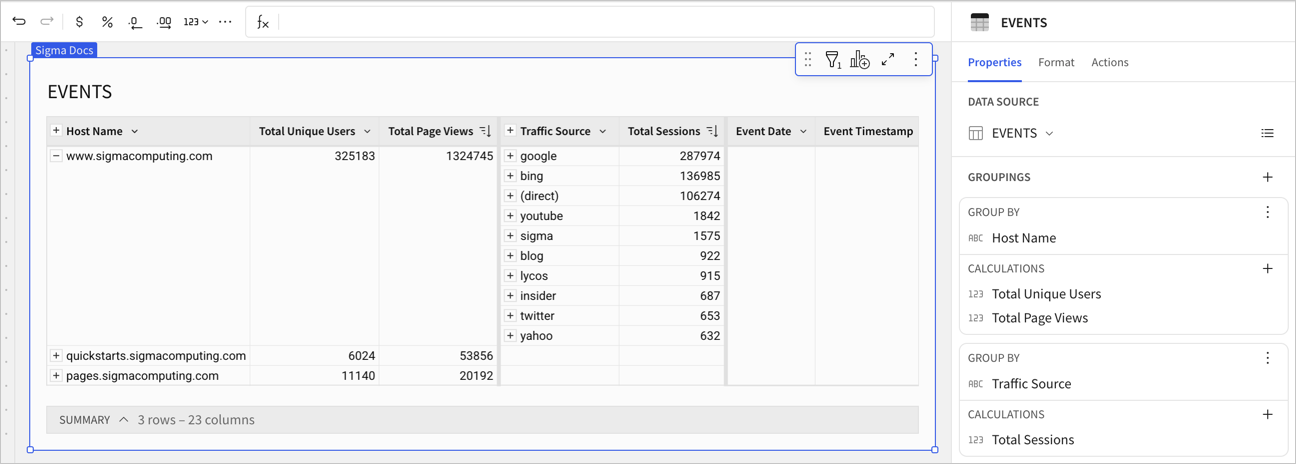
You can modify the table and group by additional columns. For example, if you want to know the top sessions started by traffic source for each host name, repeat these steps to add a second grouping with the Traffic Source column and create a calculation in the grouping with CountIf([Event Name] = "session_start").
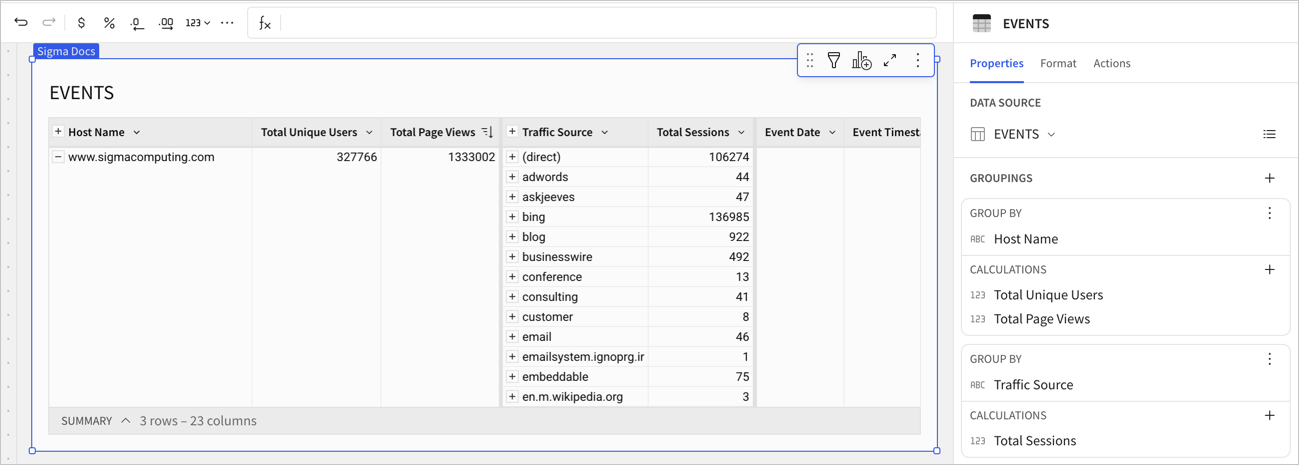
To focus the analysis in the table further, sort the Total Sessions Started column descending, then filter the column using a Top N filter to see only the top 10 sessions started by traffic source for each host name. For more details about filtering tables, see Data element filters.
Video: Introduction to functions and groupings
To watch a guided, step-by-step walkthrough on creating table groupings and writing functions that aggregate grouped data, watch the video below. You can also go to the Sigma training videos page to view the entire series.
Add summary statistics to a table
For any table, you can view summary statistics for each column. Summaries are single value column aggregates that are calculated at the highest aggregation level of the table.
You must be editing or customizing a document to add summaries to a table.
To show summary statistics for a table, do the following:
-
Select the table on the canvas, then select (
 ) Show summaries.
 -
Select
Add summary.... -
Choose a column option:
- Select New summary to calculate a custom summary with a custom formula.
- Select Row count to count the total number of rows.
- Select an existing aggregate column to create a summary for that column. The default aggregation used for the summary depends on the data type of the column, but you can change it.
You can reference a summary statistic in columns by name, like other columns. For example, for a summary statistic Earliest Date with a formula of Min([Event Date], you might calculate a column of Days Since Start with a formula that references the summary:
DateDiff("day", [Earliest Date], [Event Date])Sort table columns
You can sort a table by column values. You can sort by one column ascending, one column descending, or sort by one or more columns with a custom sort order.
- To sort a table by one column ascending, right click or click the down arrow () to open the column menu, then select Sort ascending (
 ).
). - To sort a table by one column descending, right click or click the down arrow () to open the column menu, then select Sort descending (
 ).
). - To customize the sort order of a table, see Customize the sort order of data elements.