
AI
Monitor MCP queries
You can now use the "kind":"mcp" tag to monitor queries sent by the Sigma MCP server. This can be helpful to monitor costs or usage associated with the MCP server.
See Monitor MCP queries for more information.
Sigma Assistant in the workbook: plan and build modes (Beta)
Sigma Assistant can now help you design and build workbooks using natural language prompts.
When editing a workbook, Assistant can explore any data source you have permission to access, enabling you to ask questions, provide instructions, give feedback, and iterate as needed to build a complete dashboard or AI app.
You can use Assistant in plan and build modes to do the following:
- Build dashboards with charts, tables, KPIs, and filters to visualize and explore your data.
- Set up structured data entry with forms, input tables, and actions.
- Accelerate the development of AI-powered apps from idea to working product.
For more information, see Use Sigma Assistant to build dashboards and apps.
When editing a workbook, Assistant is only available to customers who meet certain conditions. For more information, contact your Account Executive.
Upcoming changes to documentation MCP server (Beta)
Starting Monday, July 6, the documentation-specific MCP server will only have one tool available: searchDocs. The searchDocs tool searches the Sigma documentation and returns relevant sections of content and source URLs.
Before the change:
The Sigma documentation MCP server is available at https://help.sigmacomputing.com/mcp and provides multiple tools, including search and fetch for searching and retrieving documentation pages.
After the change:
The Sigma documentation MCP server has only one tool called searchDocs that searches the docs and returns relevant docs sections and source URLs. The existing MCP server URL continues to work. The MCP server will also be available at https://help.sigmacomputing.com/_mcp/server
Admin
Manage tenant attributes from the parent organization (Beta)
If you use Sigma Tenants, you can manage attributes for tenant organizations from the parent organization. Create and assign attributes in tenant organizations from the Tenants section of the Administration portal.
For more details, see Create and manage tenant organizations.
Sigma now supports the Azure Australia region
Sigma is now deployed in Azure Australia (australiaeast). This region, located in New South Wales, gives customers in Australia lower latency and enhanced performance when connecting to Sigma. A disaster recovery region is also available (australiasoutheast).
Workbook elements
Ad hoc calculated column support
Adding ad hoc calculated columns in pivot tables is now supported. This allow you to perform one-off calculations in a pivot table column, without modifying the underlying dataset or restructuring your pivot table.
For more information, see Create ad hoc calculations.
Create tables from an array with unnest (Beta)
You can create a table from an array of values using the Unnest feature. After selecting a data source and identifying a column with array data, Unnest creates a new table element with one row for each item in the array.
For more information, see Create a table from an array.
Responsive segmented controls
When the values for a segmented control are too long to fully display when viewing or editing a document, the control appears as a drop-down menu instead of truncating the text in the control.
| Appearance | Display |
|---|---|
| Before the change | 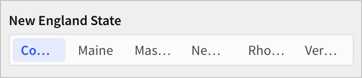 |
| After the change | 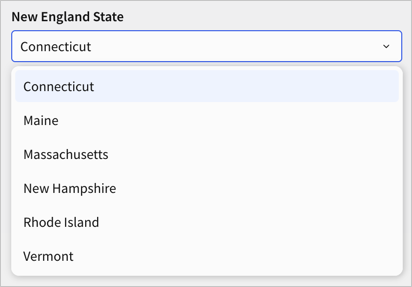 |
For more details, see Create and configure a segmented control.
Bug fixes and improvements
-
Documents containing custom SQL elements failed to deploy when the source swap policy associated with the deployment policy defined specific paths in the connection to swap to or from.
-
Improved the loading time for KPI charts when opening a workbook for the first time.
-
When using warehouse agents with Sigma Assistant, the name and email address of the user is shared with the agent.