
RaggedHierarchy
This function isn't compatible with all data platform connections. To check if your connection supports it, see Supported data platforms and feature compatibility.
The RaggedHierarchy function constructs a parent-child path across two or more columns, where each column represents a level of granularity in a hierarchical structure.
If your data is ragged (does not have a value for every level of the hierarchy), nulls are hidden by default when the hierarchy is visualized in a table.
Some common example hierarchies include:
- Product: type, family, name
- Location: continent, country, region, state, city
- Time: year, quarter, month, week, day
- Organization: department, team, role
You can also create a hierarchy in the column list. See Work with hierarchies.
This function returns an ordered list that forms a hierarchy for each row.
Syntax
RaggedHierarchy(level1, level2, [level3...])Function arguments
| level1 | The top-level value in the hierarchy. |
| level2 | The second-level value of the hierarchy. |
| levelN | Further levels in the hierarchy. |
Notes
- You must specify at least two values to establish a parent-child relationship.
- Values are interpreted in order, with level1 being the highest level (parent) of the hierarchy, and each subsequent value specified is a child of the level immediately preceding it.
- A hierarchy column is most useful in a pivot table, and can also be used in a grouped table.
Example
A table describing a company’s management organizational structure has 5 columns. The columns range from Level 1 to Level 5, with a higher number indicating a more senior position.
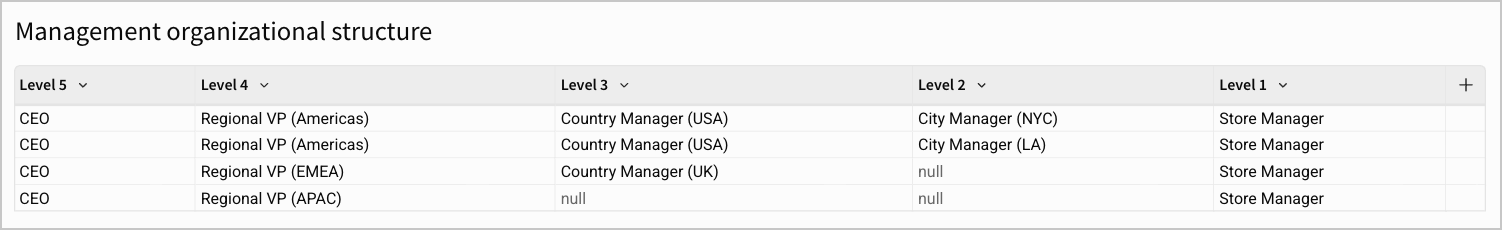
Some of the cells in the table are null, as that territory might not have a specific role filled, even though other territories do. You can use a hierarchy to visualize the organizational structure of this company with the following formula:
RaggedHierarchy([Level 5], [Level 4], [Level 3], [Level 2], [Level 1])This results in a table that looks something like:
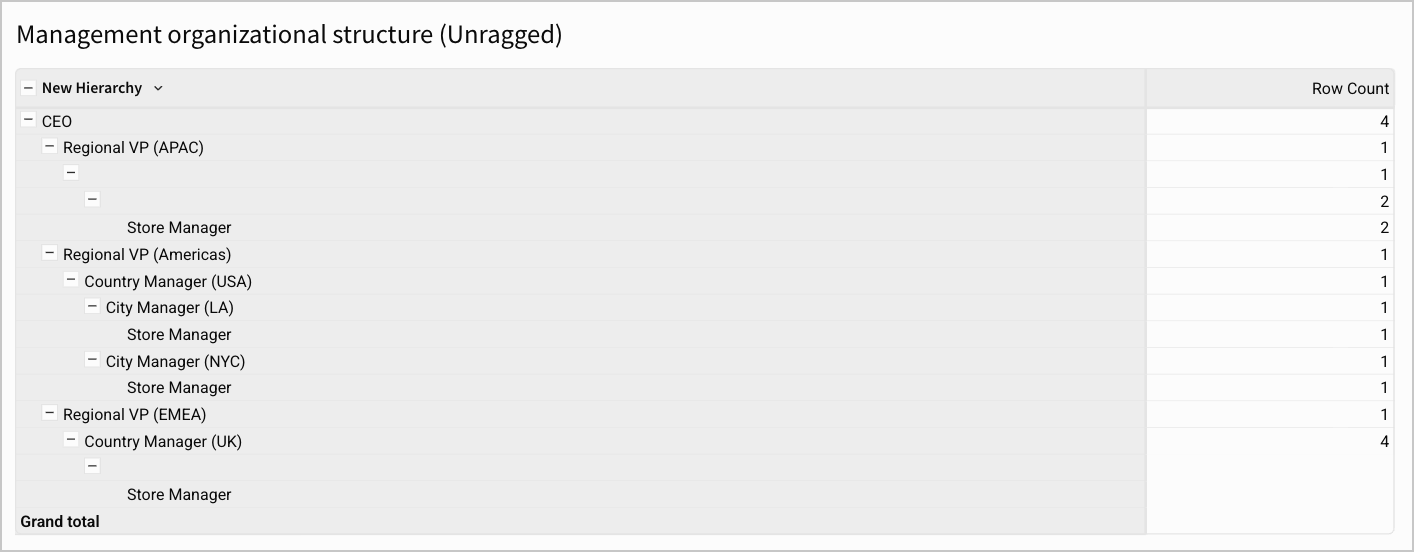
Even though the data is ragged (does not have a value for every level of the hierarchy), Sigma filters out the null values. Instead of seeing gaps where there is no employee in that position, the data is shown in a compact, ragged view.