> For clean Markdown of any page, append .md to the page URL.
> For a complete documentation index, see https://help.sigmacomputing.com/llms.txt.
> For AI client integration (Claude Code, Cursor, etc.), connect to the MCP server at https://help.sigmacomputing.com/_mcp/server.
# View underlying data
When viewing, exploring, or editing a workbook, all [data elements](/docs/create-a-data-element) are minimized by default to display multiple elements in the canvas. You can maximize an individual data element to focus on its details and view the underlying data.
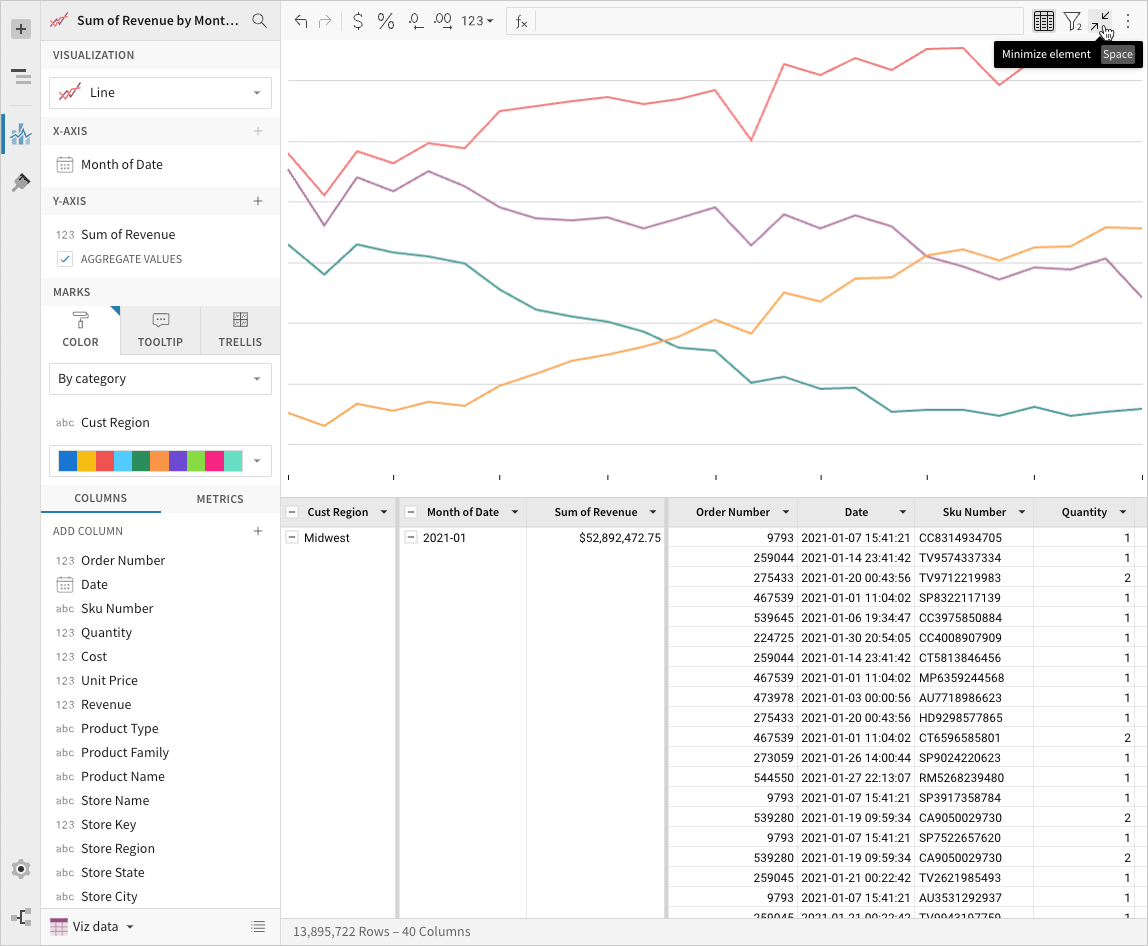
When a [visualization](/docs/intro-to-visualizations) or [pivot table](/docs/working-with-pivot-tables) element is maximized, it expands to the full width of the workbook page and exposes the element's underlying data table. Because the element and underlying data are inherently linked, changes applied to one are automatically reflected in the other.
When a [table](/docs/create-and-manage-tables) element is maximized, it expands to fill the entire workbook page. The underlying data doesn't need to be displayed in an additional table since it's already exposed in the table itself.
Data elements can be maximized in any [workbook mode](/docs/workbook-modes-overview), but changes can be made in Explore and Edit modes only.
## Maximize a data element
1. Hover over or select the data element.
2. In the element toolbar, click  **Maximize element**.\
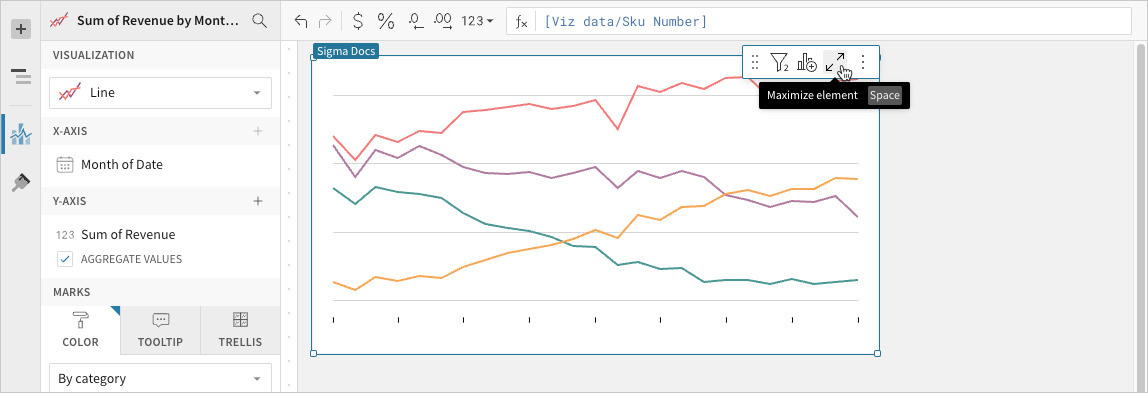
If you are viewing a cartesian chart with **Aggregate values** unchecked, the underlying data will also display as ungrouped, matching the chart.
## Minimize a data element
1. In the page toolbar, click
**Maximize element**.\

If you are viewing a cartesian chart with **Aggregate values** unchecked, the underlying data will also display as ungrouped, matching the chart.
## Minimize a data element
1. In the page toolbar, click  **Minimize element**.\
## Interactive demo
Hover over the embedded bar chart to display the element toolbar in the upper-right corner of the element.
* To maximize the chart and view the underlying data table, click **Maximize element**.
* To return to the full workbook canvas, click **Minimize element**.
## Related resources
* [Intro to data elements](/docs/intro-to-data-elements)
* [Workbook modes overview](/docs/workbook-modes-overview)
**Minimize element**.\

## Interactive demo
Hover over the embedded bar chart to display the element toolbar in the upper-right corner of the element.
* To maximize the chart and view the underlying data table, click **Maximize element**.
* To return to the full workbook canvas, click **Minimize element**.
## Related resources
* [Intro to data elements](/docs/intro-to-data-elements)
* [Workbook modes overview](/docs/workbook-modes-overview)