> For clean Markdown of any page, append .md to the page URL.
> For a complete documentation index, see https://help.sigmacomputing.com/llms.txt.
> For AI client integration (Claude Code, Cursor, etc.), connect to the MCP server at https://help.sigmacomputing.com/_mcp/server.
# Tutorial: Build and export a sales report
In this tutorial, you’ll learn how to build and export a simple, pixel-perfect sales report. The report includes:
* A cover page with a title, introduction, and branding to introduce the report to readers.
* Paginated data about the sales of a specific product category.
* Controls to filter data and support unique email burst exports for different audiences.
Once you complete this tutorial, you’ll have a report that looks something like:
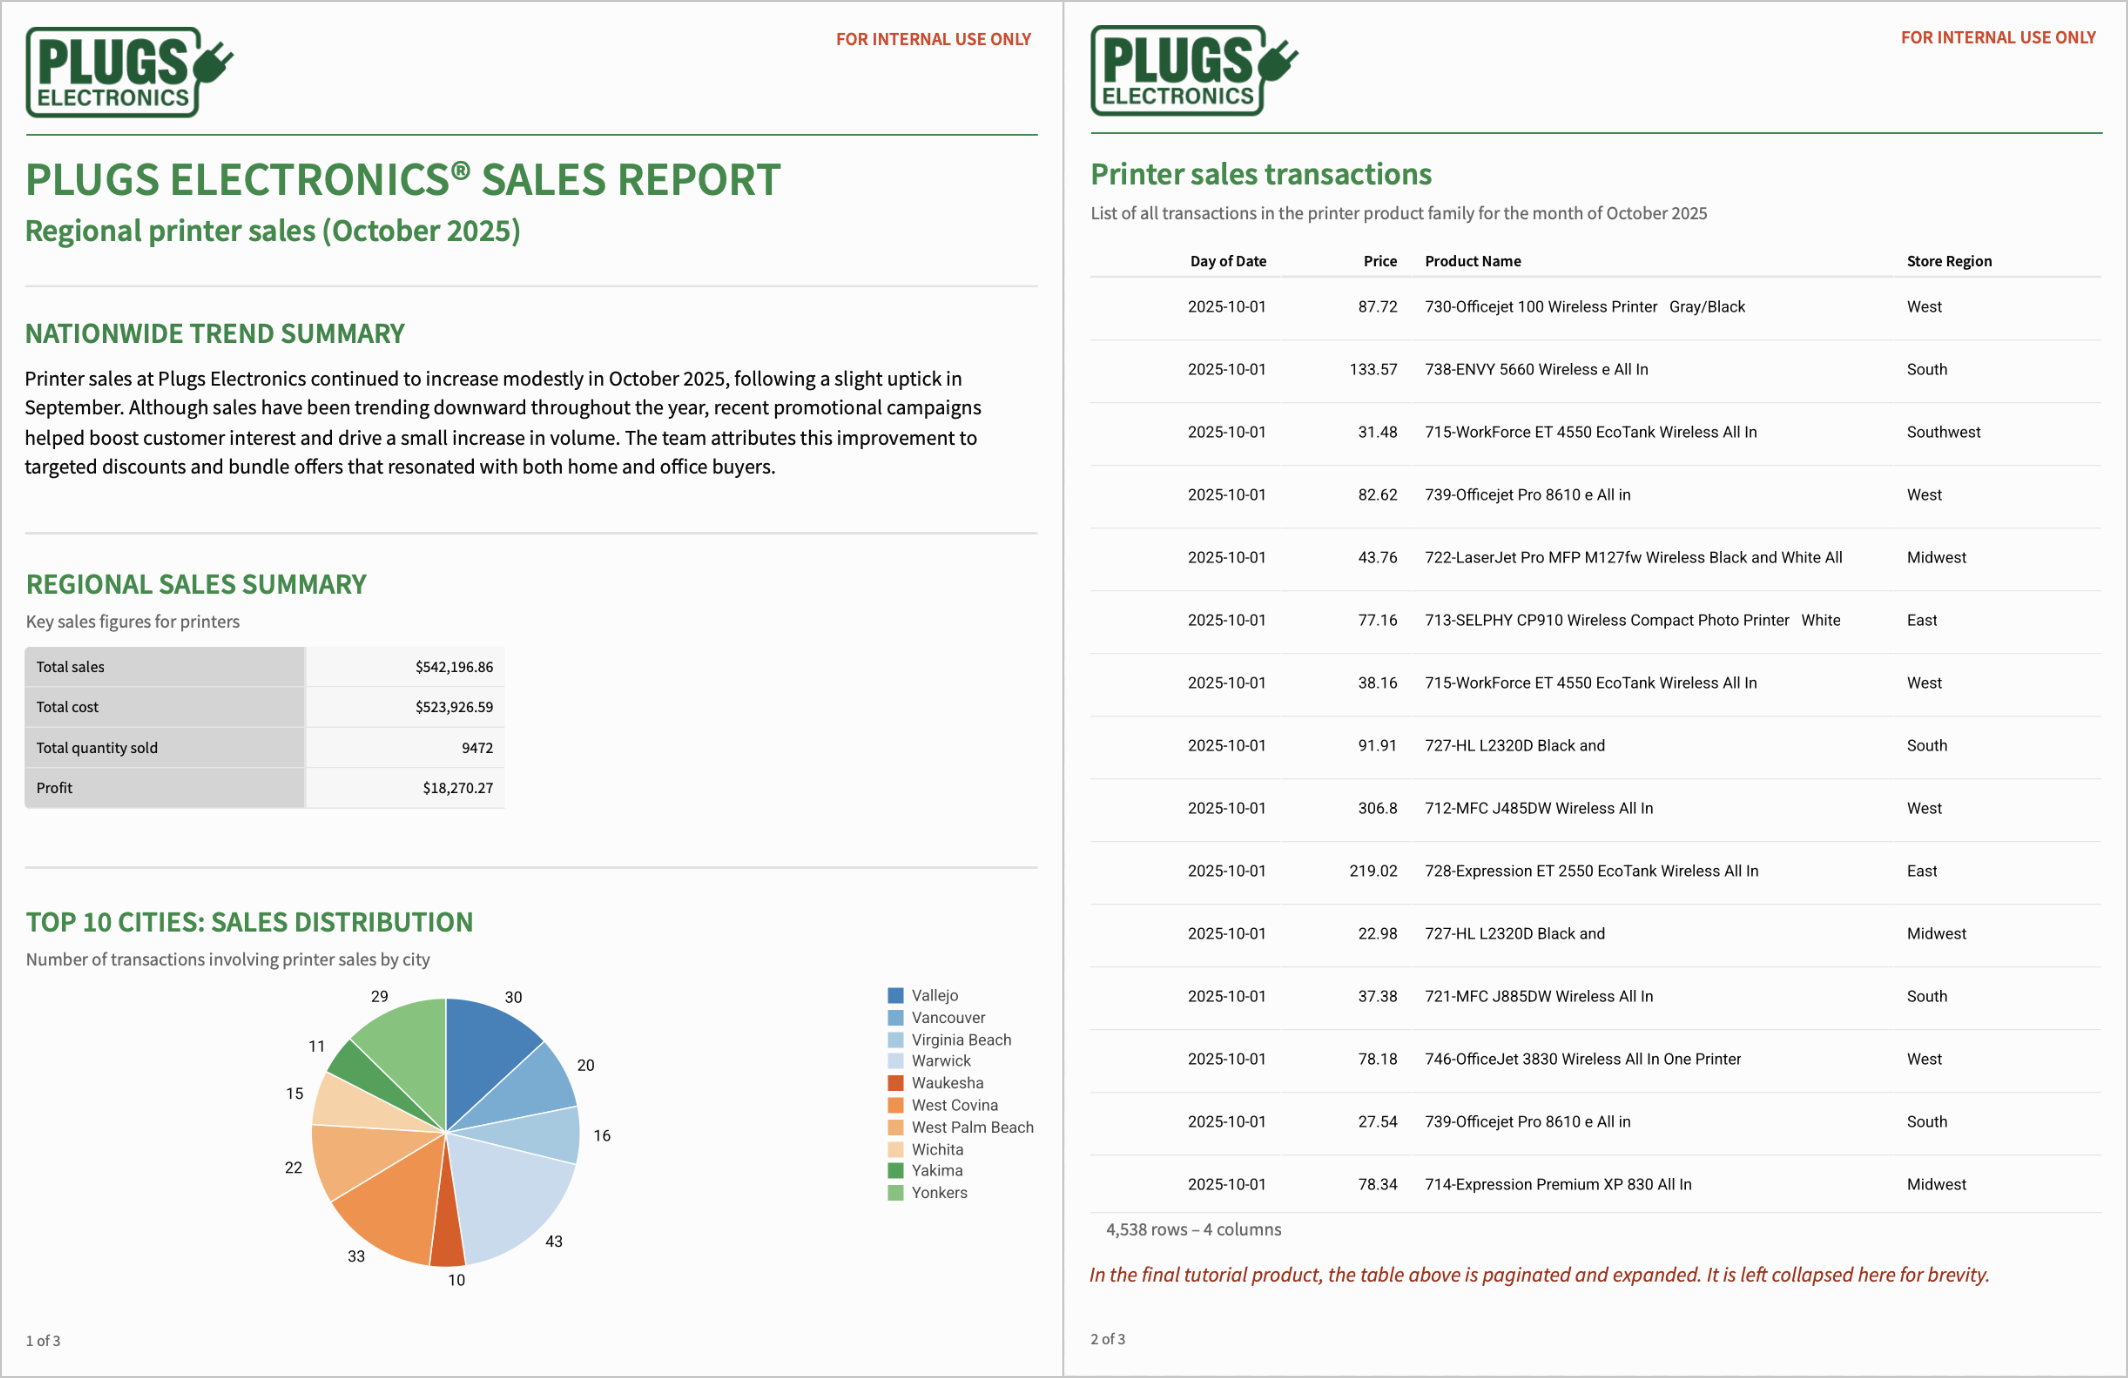
When you successfully complete this tutorial, you’ll have exposure to key parts of building an effective report in Sigma, like:
* Formatting and paginating data in a report.
* Customizing text and UI elements to fit branding guidelines.
* Configuring headers and footers with dynamic text.
* Configuring hidden controls and exporting for external report consumption.
## Required tasks
For the remainder of this tutorial, imagine you are an employee of fictional electronics sales retailer, Plugs Electronics. You have been tasked with creating a report with data on printer sales in the month of October. You are to send each regional manager an email export of printer sales in their region.
To build a sales report, complete the tasks below:
1. [Create a report](#task-1-create-a-report)
2. [Configure page setup, headers, and footers](#task-2-configure-page-setup-headers-and-footers)
3. [Add, format, and paginate data](#task-3-add-filter-and-paginate-data)
4. [Build the report cover page](#task-4-build-out-report-cover-page)
5. [Add text and adjust alignment](#task-5-add-text-and-align-elements)
6. [Configure controls and bursting](#task-6-configure-controls-and-bursting)
## Task 1: Create a report
Reports allow you to customize element formatting and positioning at the pixel level. This ensures that your exports are reliably formatted, helping you fully meet compliance and branding needs. If you have a clear idea of the type of analysis you want to do, and need to export your analysis for external consumers, a report is likely more suitable for your needs than a workbook.
However, some workbook functionality is not available in reports, like configuring interactivity and actions. If you want to use this functionality, have more exploratory or heavy analytics needs, and don’t need your exports to always be precisely formatted, a workbook might be more suitable.
In this case, as the task at hand is to create a reliable, neatly formatted export for stakeholders, a report is used. You first need to create a new report in Sigma to begin building:
1. From the Sigma home page, select **Create new** > **Report**.
2. A new report appears. Select the document menu (where the current report name, **My Report**, is), then select **File** > **Rename**.
3. Rename the report to “Monthly sales report”, then press **Enter** on your keyboard.

Unlike workbooks, there is no concept of “explorations” in reports. You cannot find unsaved reports in the **Explorations** section of **Recents** - instead, filter by the **Report** document type to find your report.
Once you have created a new report, you can begin exploring page setup and formatting options. As you work in a report, your changes and settings are automatically saved.
## Task 2: Configure page setup, headers, and footers
Next, configure our desired page setup options, and incorporate headers and footers with image and text elements.
While you can change the page, margin, header, and footer sizes at any time, adjusting these settings impacts the space available for you to design your report body. Configuring these at the start makes it easier for you to build your report without having to work around changes in canvas size or proportion.
### 2.1 Configure page margins
Let’s briefly orient ourselves in the report builder interface. By default, the editor panel on the right shows us a variety of report page layout settings. For more information on settings, see [Edit report page setup, headers, and footers](/docs/edit-report-page-setup-headers-and-footers).
We can see the report **Page** size is set to **Letter** and **Orientation** set to **Portrait**. Let’s leave those as is, but edit our margins:
1. In the Margins field, enter `20`. Margin lines appear at the top, bottom, and sides of the report. Once these are added, you won’t be able to drag elements into the margins, or resize them to be larger than the margins.
Next, let’s add a header.
### 2.2 Add header and logo
To create a header containing the company logo and other text elements:
1. In the **Header** section, turn on the **Enable header** toggle.
2. In the **Height** field, enter `95`.
Now, let’s add some branding.
3. Right-click on the image below and select **Save as…** to download the Plugs logo.

4. From the **Add element** bar, select **UI**, then select **Image**. An empty image element appears.
5. Select **Add image** and then select the file you just downloaded.
6. Drag and drop the image element into the header.
7. From the **Format** tab of the editor panel, resize the element. In the **Width** field enter `160`, and in the **Height** field `70`.
The **Size** tab is unique to reports and allows users complete control over element size, down to the pixel level. You can also resize images by dragging the handles at the element borders, but if you have specific measurements in mind, entering them is likely faster.
8. In the **Position** section, in the **X** field, enter `0`. In the **Y** field, enter `0`.
The **Position** tab, which is also unique to reports, allows you to guarantee predictable positioning when exporting data. The coordinates take into account margins, so a `0,0` position is at the upper left bound of the margin, not the entire page size. For more about positioning and size, see [Customize element size, position, and layering](/docs/customize-element-size-position-and-layering).
As this is an internal report, let’s include a notice to make sure recipients don’t circulate it.
9. Add a text element by going to **Add element bar** > **UI** > **Text**. In the empty text element that appears, type `FOR INTERNAL USE ONLY`.
10. Use the toolbar above to format this text:
1. From the text preset dropdown (where **Medium paragraph** is selected by default), select **Small paragraph** instead.
2. Highlight the text, then select **Bold**.
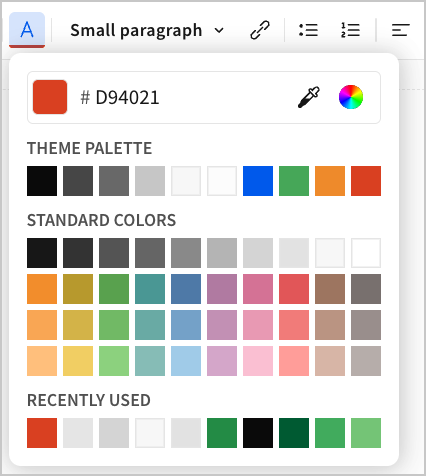
3. Change the color of the text to be more eye-catching. Select  **Text color** icon, then enter the hex code `D94021`.
4. Select
**Text color** icon, then enter the hex code `D94021`.
4. Select  **Right align**.
**When should I implement detailed formatting choices?**
In this tutorial, since we are working off of an existing model, formatting information is provided as we build out each section of the report because we have a clear idea of what we want our final report to look like. If your company has specific branding guidelines and standards, you may also want to format as you build every component. However, if you are exploring and building from scratch, you may want to implement more granular formatting choices after configuring all your main report functionality, to make consistent design choices easier.
11. Drag and drop the text element into the header, and format its position at an **X** of `590` and **Y** of `0`.
Let’s also add a divider so that it is clearer where our header ends:
12. From the **Add element** bar, select **UI** > **Divider**. A new divider element appears. Let’s change its formatting in the **Properties** tab of the editor panel.
1. In **Style**, select **2px** to make the divider thicker.
2. Match it to the Plugs Electronics green brand color by selecting **Color** and entering the hex code `238B46`.
13. Drag and drop the element into the header.
**Layering and overlapping elements**
You might notice that the element is layered on top of the logo because the header doesn’t have space to contain all the elements. Layering isn’t available in workbooks, but it is in reports, to allow for more customizable and exact formatting. See [Customize element size, position, and layering](/docs/customize-element-size-position-and-layering).
14. Resize the divider to a width of `776` px (as wide as our page size and margins allow), and a height of `25` px.
15. Position the divider at the bottom of the header. Your header should look something like:

Next, configure footers and page numbers.
### 2.3 Add a footer and page number
Let’s add a footer:
1. Select the background of the report to return to report settings. In the **Footer** section, select **Enable** footer.
2. Set the footer **Height** to `40` px.
We can then add in elements like page number:
3. From the **Add element** bar, select **UI** > **Page number**. A page number element appears.
The page number element is a dynamic text element that automatically updates with the correct page numbers as we build more pages of the report. As we only have 1 page created so far, it reads `1 of 1`.
4. Select and drag the page number element into the footer.
Let’s say we want the page number element to be smaller than the **Internal use only** text that we added. When configuring that text element, we used the **Small heading** preset - there is no smaller preset text. This is when we can use the **Break style** functionality available in the report builder, which allows you to make granular edits to your text font, size, alignment, and more.
5. Select
**Right align**.

**When should I implement detailed formatting choices?**
In this tutorial, since we are working off of an existing model, formatting information is provided as we build out each section of the report because we have a clear idea of what we want our final report to look like. If your company has specific branding guidelines and standards, you may also want to format as you build every component. However, if you are exploring and building from scratch, you may want to implement more granular formatting choices after configuring all your main report functionality, to make consistent design choices easier.
11. Drag and drop the text element into the header, and format its position at an **X** of `590` and **Y** of `0`.
Let’s also add a divider so that it is clearer where our header ends:
12. From the **Add element** bar, select **UI** > **Divider**. A new divider element appears. Let’s change its formatting in the **Properties** tab of the editor panel.
1. In **Style**, select **2px** to make the divider thicker.
2. Match it to the Plugs Electronics green brand color by selecting **Color** and entering the hex code `238B46`.
13. Drag and drop the element into the header.
**Layering and overlapping elements**
You might notice that the element is layered on top of the logo because the header doesn’t have space to contain all the elements. Layering isn’t available in workbooks, but it is in reports, to allow for more customizable and exact formatting. See [Customize element size, position, and layering](/docs/customize-element-size-position-and-layering).
14. Resize the divider to a width of `776` px (as wide as our page size and margins allow), and a height of `25` px.
15. Position the divider at the bottom of the header. Your header should look something like:

Next, configure footers and page numbers.
### 2.3 Add a footer and page number
Let’s add a footer:
1. Select the background of the report to return to report settings. In the **Footer** section, select **Enable** footer.
2. Set the footer **Height** to `40` px.
We can then add in elements like page number:
3. From the **Add element** bar, select **UI** > **Page number**. A page number element appears.
The page number element is a dynamic text element that automatically updates with the correct page numbers as we build more pages of the report. As we only have 1 page created so far, it reads `1 of 1`.
4. Select and drag the page number element into the footer.
Let’s say we want the page number element to be smaller than the **Internal use only** text that we added. When configuring that text element, we used the **Small heading** preset - there is no smaller preset text. This is when we can use the **Break style** functionality available in the report builder, which allows you to make granular edits to your text font, size, alignment, and more.
5. Select  **Break style**. Configure the following:
1. In the font selection dropdown, select **Source Sans Pro**.
2. In the font size field, enter `12`.
3. Change the text color to `0A0A0A.`
6. Drag and drop your page number element into the bottom left of your footer. This should look something like:

## Task 3: Add, filter, and paginate data
With your page setup details defined, you can now start building out the body of your report. The data we are going to use in this sample report is available in the Sigma Sample Database.
### 3.1 Add data table
To add the sample data set:
1. Create a new page for our table. In the **Pages** section, select **More options** from our existing page, then **Add new page**. Drag and drop this to be the second page in the report.
2. From the **Add element** bar, select **Data** > **Table**.
3. From the **Select source** modal, search for and select `PLUGS_ELECTRONICS_HANDS_ON_LAB_DATA`. The data table appears on the report page:
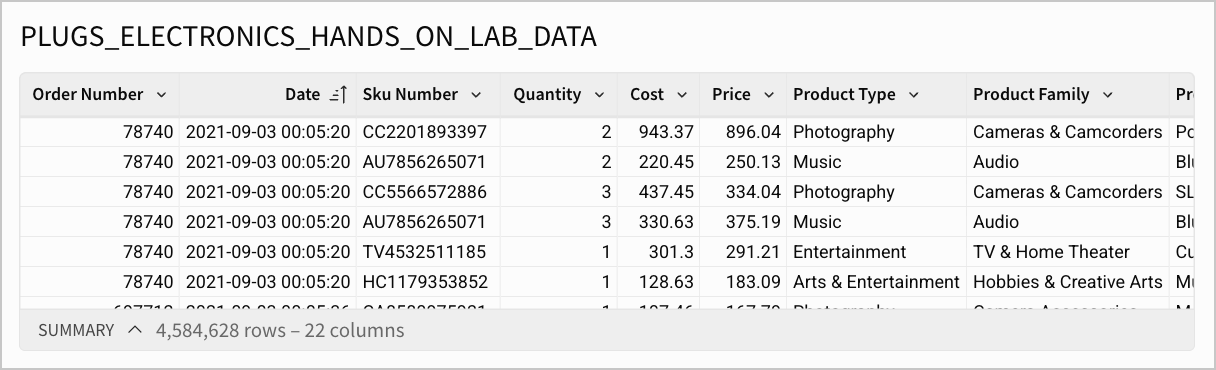
**What data is this?**
Let’s take a moment to familiarize ourselves with our data. `PLUGS_ELECTRONICS_HANDS_ON_LAB_DATA` contains detailed information about each transaction from the fictional electronics retailer Plugs Electronics over the course of several years. For example, it contains details about:
* The products being purchased (such as product family, line, and brand)
* The customer who purchased them (name, biographical information)
* Transaction details (when the transaction occurred, order number, and store location).
Each row in the `PLUGS_ELECTRONICS_HANDS_ON_LAB_DATA` dataset represents a single product in an order (duplicate order numbers are present when there are multiple products in an order). The dataset is continuously updated, so if specific numbers in your data do not match the ones shown in this tutorial, that is expected.
### 3.2 Surface relevant data
For this report, your stakeholders are only interested in printer sales from October 2025: when they occurred, product names, price, and the region the sale took place in. You can filter the data set and hide extra columns:
1. Add a new *Day of Date* column to the table:
1. Select the down arrow (ICON) next to the *Date* column and select **Add new column**.
2. In the formula bar, enter `DateTrunc("day", [Date])`.
2. Filter the columns to only show printer category transactions that occurred in October 2025:
1. Select the table, then select
**Break style**. Configure the following:
1. In the font selection dropdown, select **Source Sans Pro**.
2. In the font size field, enter `12`.
3. Change the text color to `0A0A0A.`
6. Drag and drop your page number element into the bottom left of your footer. This should look something like:

## Task 3: Add, filter, and paginate data
With your page setup details defined, you can now start building out the body of your report. The data we are going to use in this sample report is available in the Sigma Sample Database.
### 3.1 Add data table
To add the sample data set:
1. Create a new page for our table. In the **Pages** section, select **More options** from our existing page, then **Add new page**. Drag and drop this to be the second page in the report.
2. From the **Add element** bar, select **Data** > **Table**.
3. From the **Select source** modal, search for and select `PLUGS_ELECTRONICS_HANDS_ON_LAB_DATA`. The data table appears on the report page:

**What data is this?**
Let’s take a moment to familiarize ourselves with our data. `PLUGS_ELECTRONICS_HANDS_ON_LAB_DATA` contains detailed information about each transaction from the fictional electronics retailer Plugs Electronics over the course of several years. For example, it contains details about:
* The products being purchased (such as product family, line, and brand)
* The customer who purchased them (name, biographical information)
* Transaction details (when the transaction occurred, order number, and store location).
Each row in the `PLUGS_ELECTRONICS_HANDS_ON_LAB_DATA` dataset represents a single product in an order (duplicate order numbers are present when there are multiple products in an order). The dataset is continuously updated, so if specific numbers in your data do not match the ones shown in this tutorial, that is expected.
### 3.2 Surface relevant data
For this report, your stakeholders are only interested in printer sales from October 2025: when they occurred, product names, price, and the region the sale took place in. You can filter the data set and hide extra columns:
1. Add a new *Day of Date* column to the table:
1. Select the down arrow (ICON) next to the *Date* column and select **Add new column**.
2. In the formula bar, enter `DateTrunc("day", [Date])`.
2. Filter the columns to only show printer category transactions that occurred in October 2025:
1. Select the table, then select  **Filters** > **+ Add filter**. Search for and select the **Day of Date** column, then select **Oct 1 2025** as the beginning date and **Oct 31 2025** as the end date.
2. Add another filter for the printer category by selecting **+ Add filter**, the *Product Line* column, then **Printers**.
3. Select the table. In the editor panel, under **Columns**, you can see all columns in the table. Drag and drop the *Day of Date*, *Price*, *Product Name*, and *Store Region* columns to the top for easy access.
4. Hide the remaining columns from view in our table by selecting the
**Filters** > **+ Add filter**. Search for and select the **Day of Date** column, then select **Oct 1 2025** as the beginning date and **Oct 31 2025** as the end date.
2. Add another filter for the printer category by selecting **+ Add filter**, the *Product Line* column, then **Printers**.
3. Select the table. In the editor panel, under **Columns**, you can see all columns in the table. Drag and drop the *Day of Date*, *Price*, *Product Name*, and *Store Region* columns to the top for easy access.
4. Hide the remaining columns from view in our table by selecting the  down arrow, then selecting **Hide column**. You can select and hide multiple columns at once (press the
 Shift key and click on the desired range of columns).
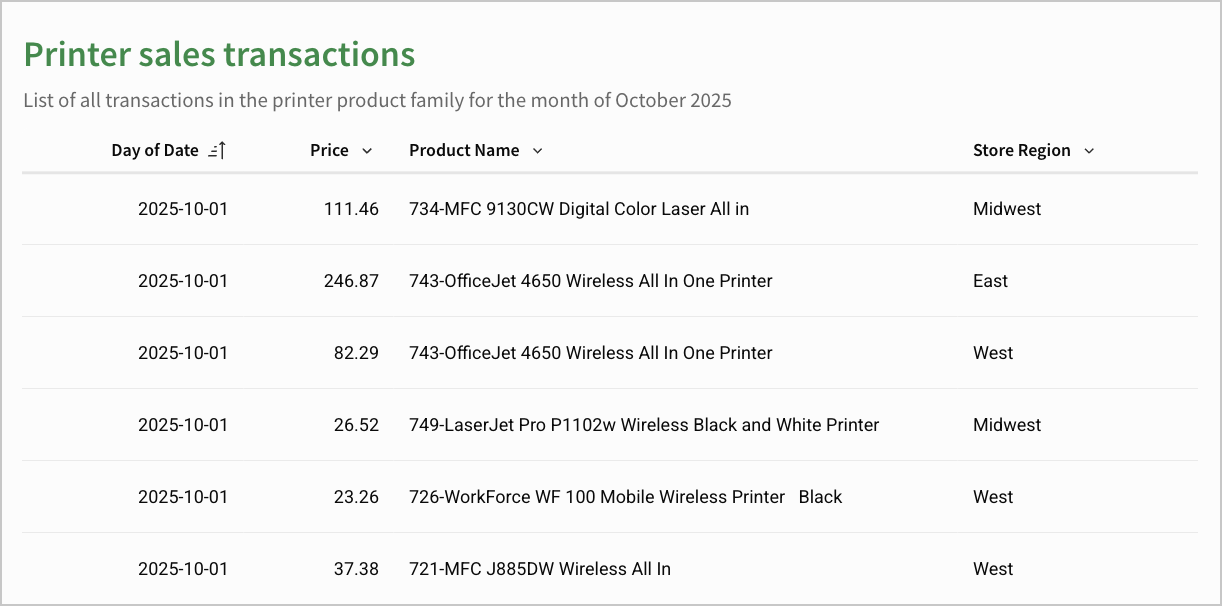
5. Rename the table to `Printer sales transactions`:
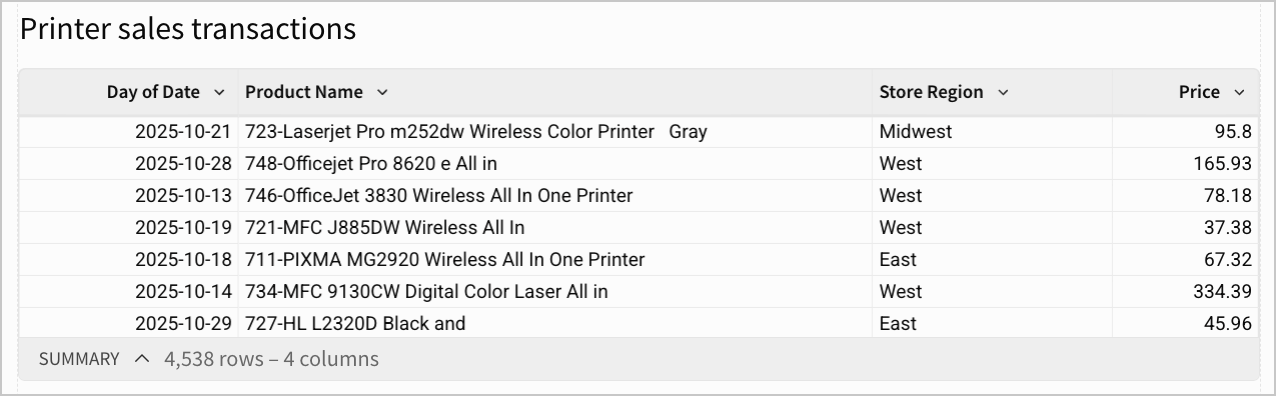
Pagination for tables and input tables in reports is supported up to 10,000 rows of data. This limitation applies only to how many rows are rendered in the report. All operations (like filtering, formulas, summaries, and any child element interactions) are performed on the entire dataset.
### 3.3 Paginate the table
Most of the transaction data is hidden from view - to see all of it, you need to paginate the table:
1. Select the table. In the lower right corner, select the **Expand table** button.
The table is now paginated vertically. When editing a report, only the first and last page of the table is shown to make navigation easier and avoid the need for excessive scrolling. To see the full set of paginated data rest, select **Open preview**, or **Publish** the report and view the published version.
You can also paginate a table from the editor panel by selecting the **Format** tab, opening the **Size** section, and selecting **Expand table rows**, but selecting the **Expand table** button is quicker.
### 3.4 Format the table
To make the table less visually dense and to match Plugs branding, make some formatting changes:
1. Select the table, and select the **Format** tab of the editor panel.
2. In the **Title** section:
1. Bold the title text, set the text color to `238B45`, and set the font size to 24.
2. Add a description to clarify what information the table contains. Turn on the **Show description** toggle, then enter `List of all transactions in the printer product family for the month of October 2025`.
3. In the **Table style** section:
1. Change the **Preset** to **Presentation.**
2. Change the **Cell spacing** to **Large**.
Your table might look something like:
## Task 4: Build out report cover page
Now that we have our data filtered and prepared, we can build a cover page with summary statistics, explanatory text and charts. This provides more context for the report readers and orients them to the information they receive.
### 4.1 Add and format a summary table
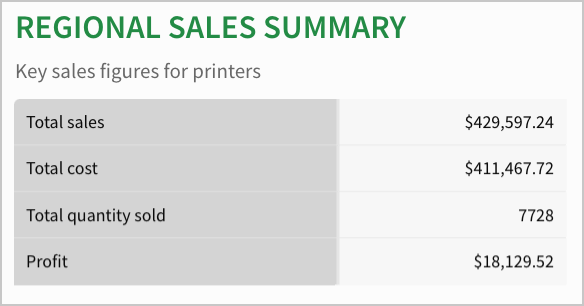
To want to highlight some other key sales figures (total sales amount, total cost, total quantity, and profit) quickly to readers, we can build a summary table:
1. Select the first page of the report,
2. Go to **Add element** bar > **Data** > **Pivot table**.
3. In the **Select source** modal, select the **Printer sales transactions** table. A new empty pivot table appears. You might have to scroll to the bottom of the report to see it.
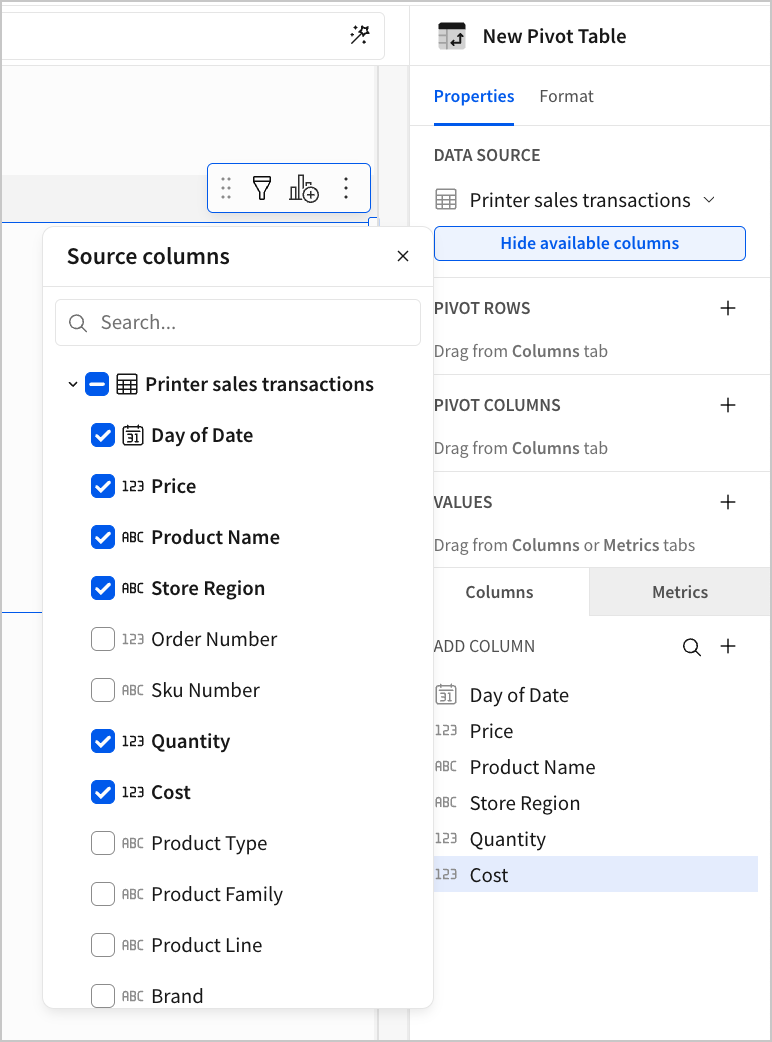
4. Make some additional columns in our original dataset available for the calculations we are about to do by selecting **Show available columns**. Select the checkboxes next to **Quantity** and **Cost** so we can use them in our calculations. This won’t make the columns show in our formatted **Printer sales transactions** table, but makes them available for use in the pivot table.
5. Add a new calculated column:
1. In the **Values** section, select **+ Add calculation** > **+ Add new column**.
2. In the formula bar enter `Sum([Price])`. This reflects the total sales amount.
3. Double click the *Sum of Price* column in values to rename it as *Total sales*.
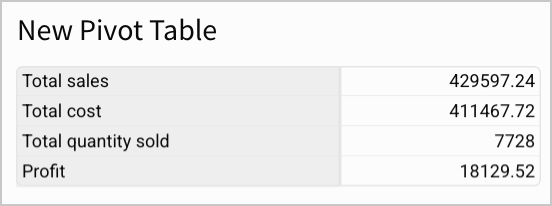
6. Repeat the process to add three more calculated columns with the following formulas and names:
1. `Sum([Cost])`, *Total cost*
2. `Sum([Quantity])`, *Total quantity*
3. `([Total sales] - [Total cost])`, *Profit*
Your table might look something like:

7. Change the orientation of the table. Under **Pivot Columns**, select and drag and drop the **Values** bar to **Pivot Rows**. Your table now looks like:
8. Change the formatting of the *Total sales*, *Total Cost* and *Profit* columns to currency: In the Values section, select the down arrow next to **Column** > **Format** > **Currency**.
9. Configure additional formatting for the table:
1. In the **Element style** section,
1. Turn the **Padding** toggle off.
2. In the **Title** section,
1. Enter `REGIONAL SALES SUMMARY` as the title. Change the title font size to 22, and change text color to hex code `238B45`.
2. Turn the **Show description** toggle on, and enter `Key sales figures for printers`. Ensure your **Description display** is set to **Subtitle**.
We choose **Subtitle** here as tooltip descriptions won’t show up in an export.
3. Under Table styles:
1. Set **Preset** to **Presentation**\
2\. **Cell spacing** to **Medium.**\
3\. In the **Subheader** tab, change the **Row header** font to **Source Sans Pro**, and the **Background** **color** to `D4D4D4`.\
4\. In the **Cell** tab, change the font to **Source Sans Pro**, and the **Background** **color** to `F7F7F7`.
Your table might look like:
### 4.2 Add chart element
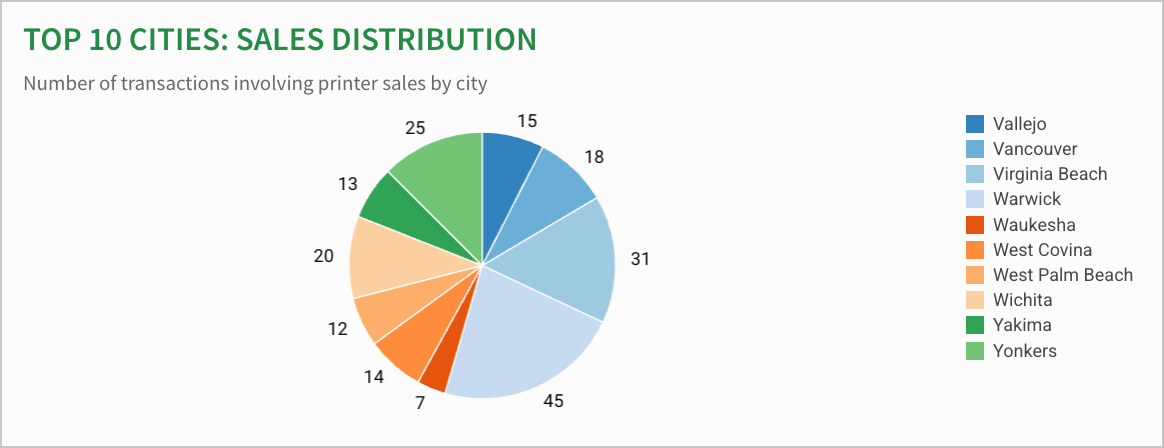
Next, build a pie chart of the top to showcase sales distribution in the 10 cities with the highest printer sales. Adding visual aids like this allow data to be surfaced clearly and in a digestible way for the report readers.
1. From the **Add element** bar, select **Charts** > **Pie**. Select the **Printer sales transactions** table as the data source.
2. Make the *Store City* column available to use by going to **Data Source** > **Show available columns** > **Add Store City.**
3. Drag the *Store City* column to the **Color** section. Under **Value**, select **Add new column** > **Row count**. Your chart might look something like:
4. Add a filter to show only the top 10 cities:
1. Select **Filter** > **+ Add Filter** > *Store city*.
2. Select the **More** menu, then select **Change filter type** > **Top N**. Enter `10`.
5. Configure formatting in the **Format** tab of the editor panel:
1. In the **Title section**, enter a descriptive title like `Top 10 cities: Sales distribution`. Bold the text, change the font size to `22`, and change the text color to `238B45`. Left align the text.
2. Turn on the **Show description** toggle and enter "Number of transactions involving printer sales by city".
3. Open the **Data labels** section and turn the **Show data labels** toggle on.
6. In the **Properties** tab, under **Color**, open the menu and then select **Palette**. Select the 5th option.
7. At this point, part of the chart legend is cut off. Resize the element to show the whole legend (the element size in the embedded report is of **Width** `776` px and **Height** `300`). Your chart might look like:
## Task 5: Adding text and aligning items
At this point, your report is starting to look more complete, and might look similar to:
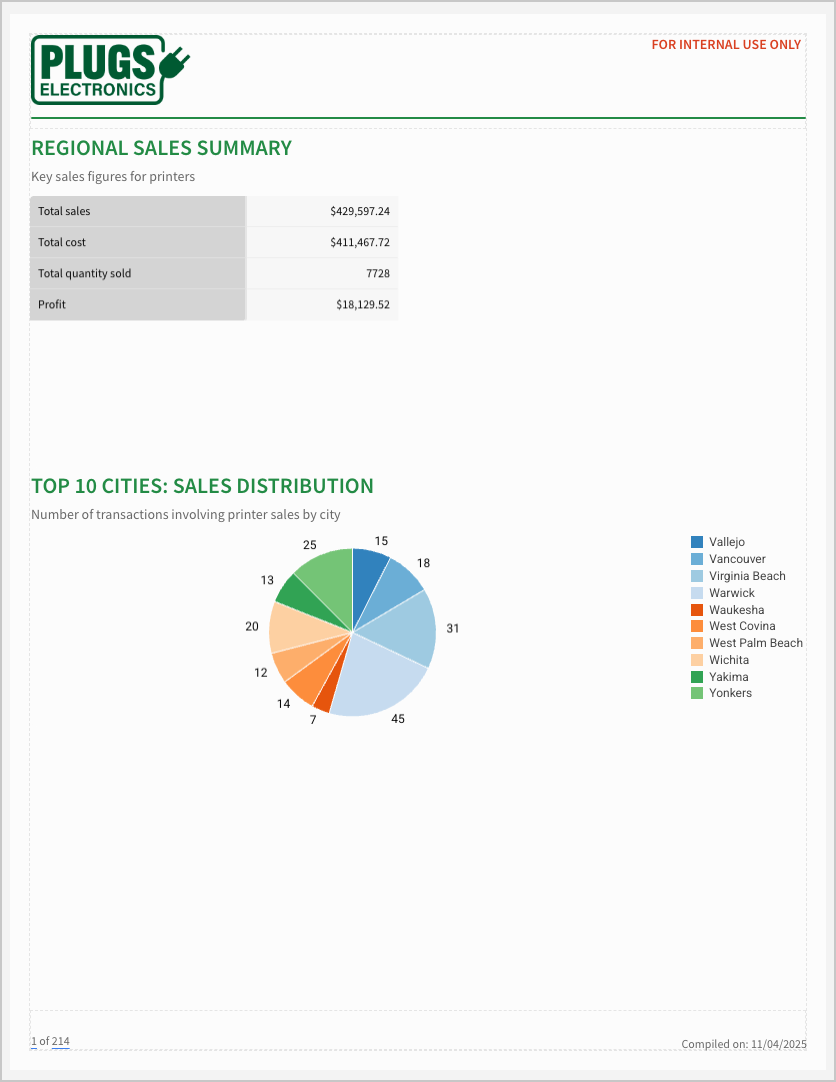
Let’s add in a report title, additional text, dividers, and work on aligning the elements in this page properly so it is ready for others to look at.
You might want to turn the **Show ruler** toggle on for to make aligning elements easier. This adds ruler guides (**Pixel**, **Inches**, **Centimeters**) in your chosen unit to the sides of the report builder interface.
### Task 5.1 Add a title and overview
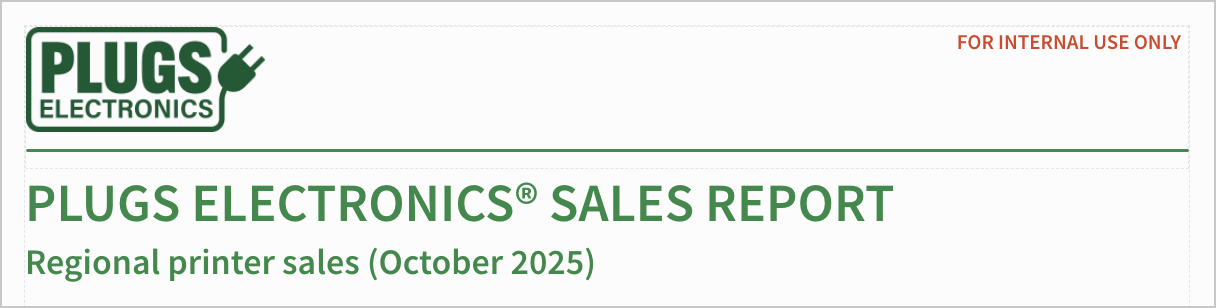
8. Let’s add a title to the report. Create 2 text elements:
1. One with the words “PLUGS ELECTRONICS® SALES REPORT”. Format this as a **Medium heading**. Bold the heading and use the color `218A45`.
2. One with the words “Regional printer sales (October 2025)”. Format this as a **Small heading** with color `218A45`.
3. Select both elements and drag them to the top of the page, right below the header, and move any overlapping elements lower onto the page.
If your elements are not aligned neatly, you can select all of them, then click **More options** and use the available alignment options. Here, you might want to use **Align left** to ensure all our heading text is aligned neatly to the left.
The top of your page might look something like:
9. Next, we want to include a national trend summary to provide context for the rest of our report:
1. Create a new text element with the text “NATIONWIDE TREND SUMMARY”. Break the preset style for this element and format the text as size `22`, with the **Source sans pro** font, and color `218A45`.
2. Create another element with the text: “Printer sales at Plugs Electronics continued to increase modestly in October 2025, following a slight uptick in September. Although sales have been trending downward throughout the year, recent promotional campaigns helped boost customer interest and drive a small increase in volume. The team attributes this improvement to targeted discounts and bundle offers that resonated with both home and office buyers.” Leave this as the default **Medium paragraph** style preset, but resize it until it is the width of our page (`776` px).
3. Select both boxes and drag them below the title and subheading:
### Task 5.2 Add dividers and align
To make our report look more polished, we can add additional UI elements like dividers, and align our elements.
1. Create a divider element by going to the **Add element** bar > **UI** > **Divider**.
2. In the **Properties** tab, change the **Style** to **2px** and color to `E2E2E2`. Resize the divider until it reaches both sides of the page margins (`776` px).
3. Duplicate the divider by selecting **More** > **Duplicate**. Repeat until you have three divider elements.
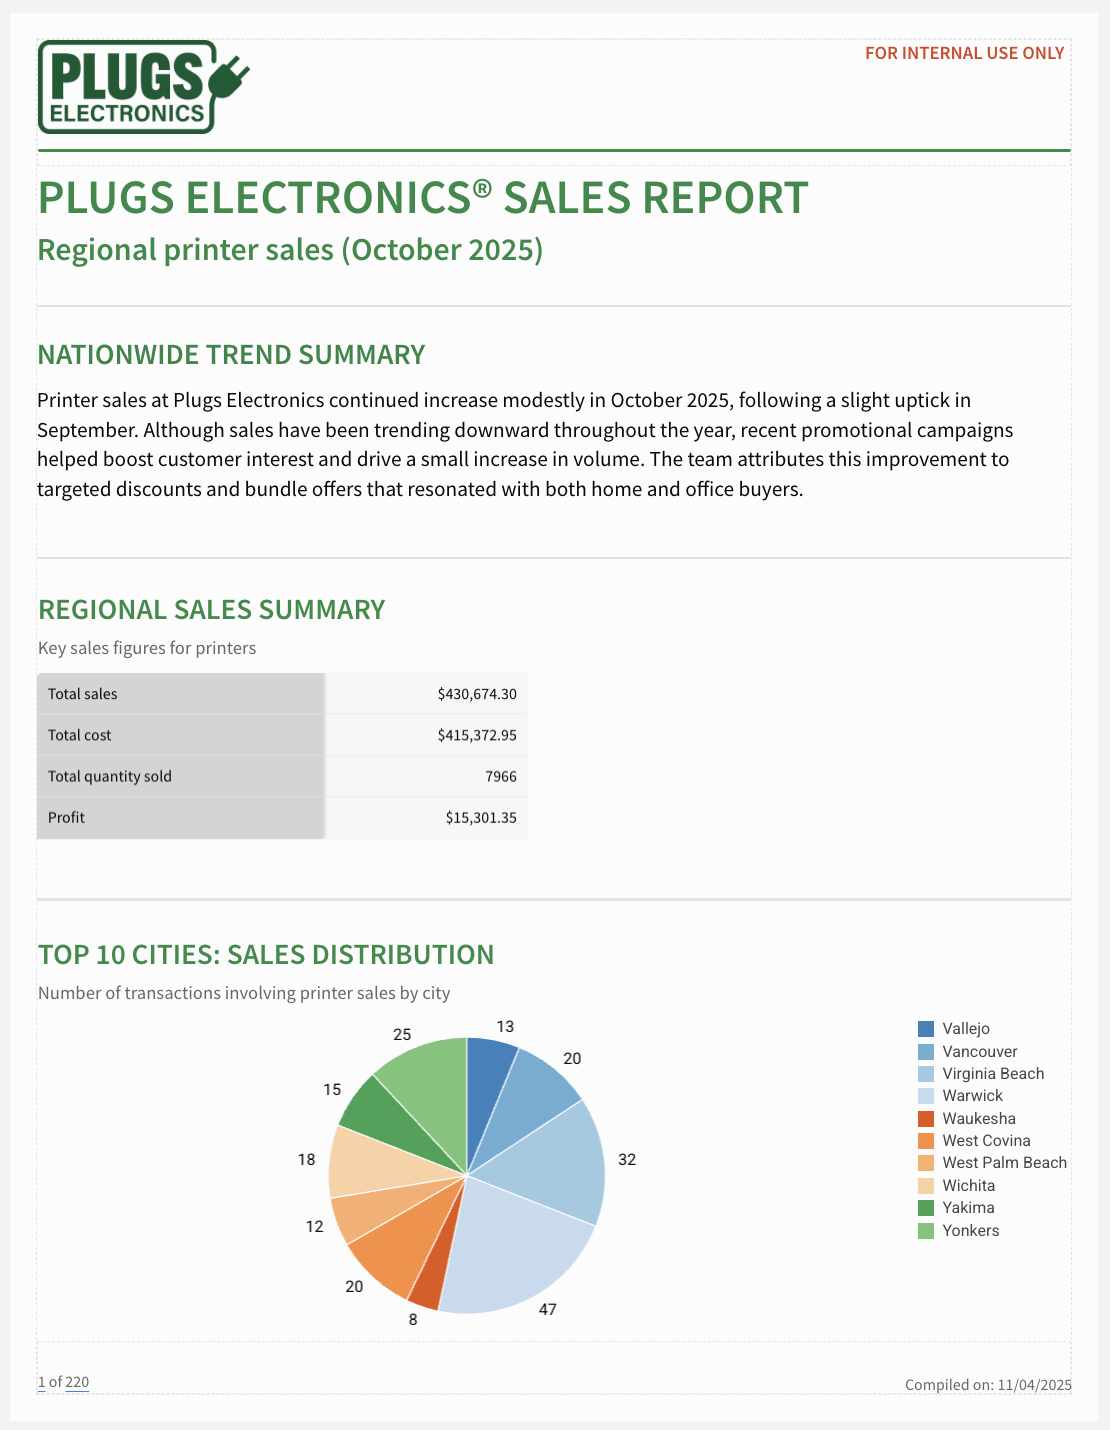
4. Distribute the dividers evenly throughout each section so that it matches the first page of the model report:
**Spacing tips**
* One way to ensure even spacing between the dividers and each section heading is to ensure all the dividers have the same **Height** (the ones in the model report are `40`px), and drag them until they are just touching the top of the other element. A red guideline appears when they overlap:

* When you have many elements on a page, overlaps between elements may make formatting harder, as you might unintentionally select the wrong element. If you are having a hard time selecting an element, you can bring it to the top layer of the report by selecting **More menu** > **Order** > **Bring to front**. See [Customize element size, position, and layering](/docs/customize-element-size-position-and-layering) for more information on layering in reports.
## Task 6: Configure controls and bursting
Our report is almost complete, and we can now think about how to best deliver it to our stakeholders. Remember that our task is to send each regional manager an email export of printer sales in their region. To do this, set up a hidden page with a control to filter to each region’s data, and set up an email burst export.
### 6.1: Create a hidden page
We want to configure our control and bursting setup on a page that isn’t visible in the published version of the report, so that we don’t distract report consumers from the main content of the report. To create a hidden page:
1. From the **Pages** section, select **More** > **+ Add new page**. Drag and drop this page so it is the last page in your report.
2. From our new page, select **More** > **Hide page**. In the **Pages** section, your page might look like:
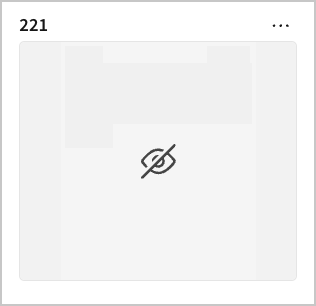
Hidden pages, which are only viewable when editing a report, can be used to hide additional data sources, input tables, controls and other inner workings of a report that we don’t need consumers to see.
### 6.2: Create an input table
Create an input table so that we have the contact information for each regional manager and their corresponding region. We will use this table in the control and email burst setup later:
1. From the **Add element** bar, select **Input** > **Empty**. Select the **Sigma Sample Database** in the **Select source** modal.
2. Rename the input table to `Emails by sales region`.
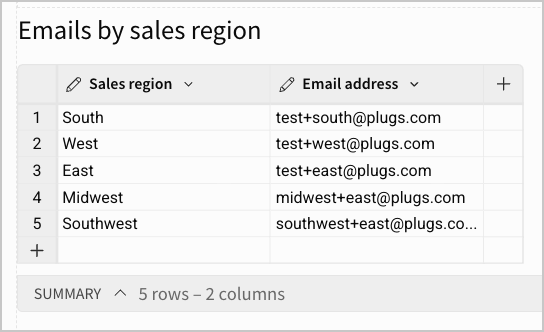
3. Rename the first column as *Sales region*, and add the regions South, West, East, Midwest, Southwest in separate rows.
4. Add a second column named `Email address`. As this is a fictional scenario and you may not have additional emails to test, you can append `+[region]` to any email address that you have access to. For example, if your email is `test@plugs.com`, you can enter `test+south@plugs.com` for the South region. Your table might look something like:
### 6.3: Set up control and targets
Next, we will set up a region control to appropriately filter our data and link it to the correct email address:
1. From the **Add element** bar, select **Controls** > **List values** control.
We are using a **List values** control as that is the only type of control email bursting exports support. See [Export as email burst](/docs/export-as-email-burst).
2. Rename the control to *Region*.
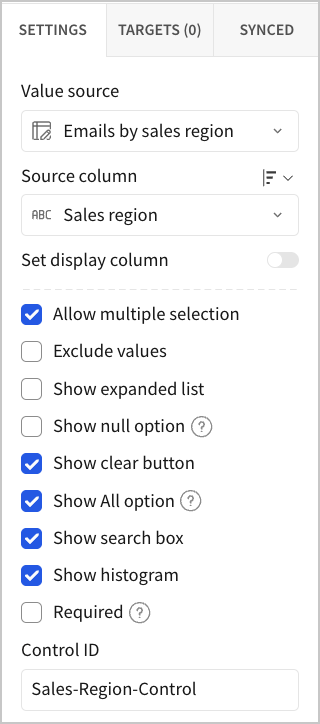
3. Configure control in the Settings tab of the editor panel:
1. In **Value Source**, select the **Emails by sales region** input table.
2. Unselect the **Show null option** checkbox, as we are not interested in transactions with null region values.
3. Rename the **Control ID** `Sales-Region-Control`.
Although we only have one control in this workbook, keeping clear, descriptive names for each control is a best practice. This is helpful when dealing with reports of greater complexity, with several controls.
4. Configure our desired control **Targets**:
1. Select **+ Add filter target** and select the **Top 10 cities** pie chart.
2. Add another filter targeting the **Printer sales transactions** table.
3. Add another filter targeting the **Emails by sales region** input table.
Setting these as our control targets filters all 3 of these to the right data when we select a control value.
### 6.4 Set up email burst export
Setting up an email burst allows us to use the control we just configured to send the correct subset of data to each regional manager:
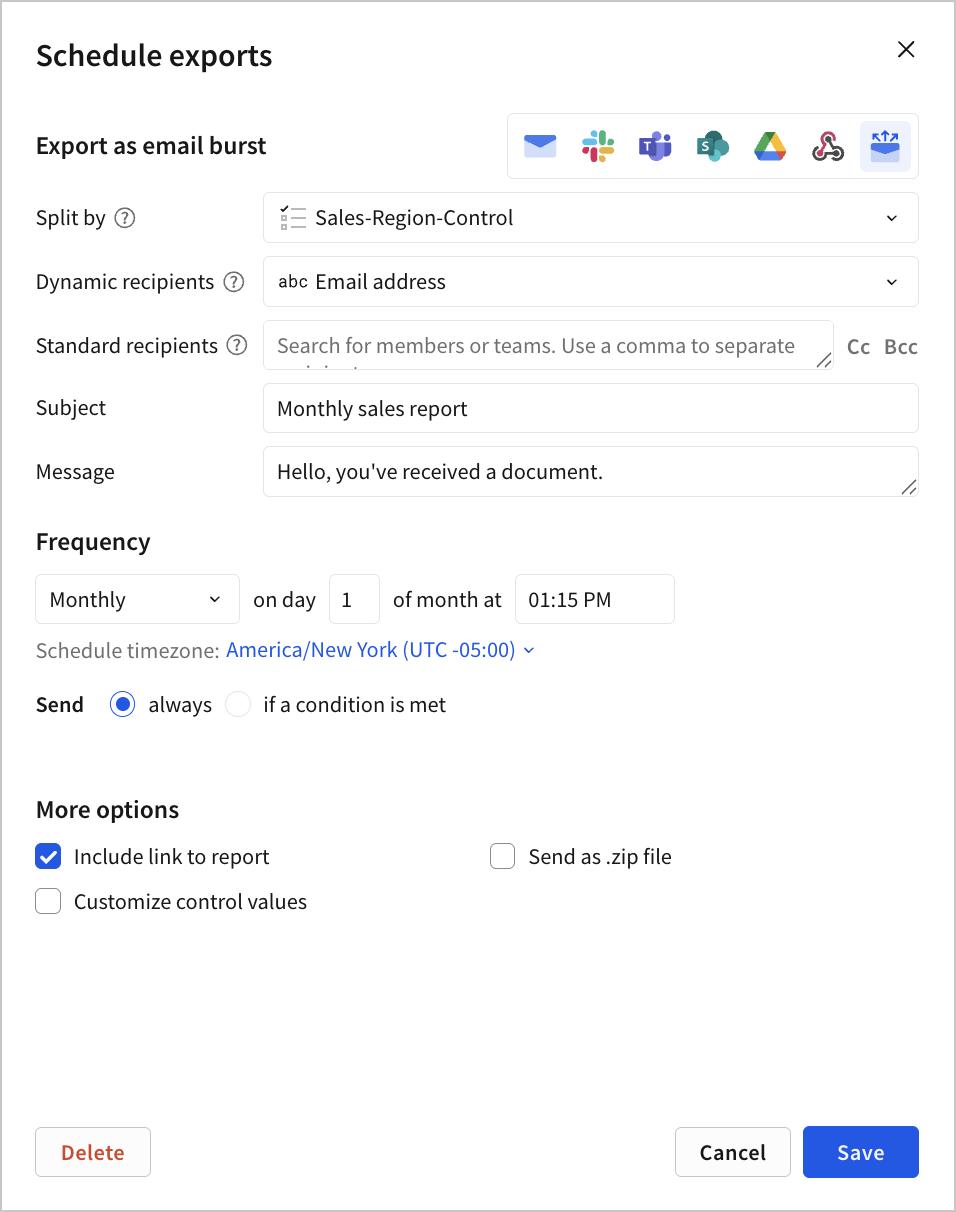
1. Go to the document menu > **Share and export** > **Schedule exports**.
2. Select **Create new schedule**.
3. In the **Scheduled exports** modal, select **Export as email burst**.
4. In **Split by**, select the `Sales-region-control`.
5. In **Dynamic recipients**, select **Email address**.
6. Select a **Frequency** with a time near now, so that you can immediately verify if the control and export works as intended.
The **Schedule exports** modal should look something like:
7. Select **Create**.
At the time of your scheduled export, verify that the report received appears as expected, with each region’s email address only receiving data for that region (you can verify this in the *Store Region* column of the **Printer sales transactions** table).
## Conclusion
This is the end of the tutorial. You have created a report with clear and consistent branding, paginated data, and text and visual aids for the report consumer. You have learned how to control formatting, layering, and positioning to generate cleanly formatted reports, and how to configure controls to cater to different report audiences. You can apply these fundamentals to building reports for your organization and use cases.