> For clean Markdown of any page, append .md to the page URL.
> For a complete documentation index, see https://help.sigmacomputing.com/llms.txt.
> For AI client integration (Claude Code, Cursor, etc.), connect to the MCP server at https://help.sigmacomputing.com/_mcp/server.
# Transpose a table
> Transpose Sigma tables from rows to columns or columns to rows for easier analysis, reporting, and presentation.
Sigma supports transposing a table from rows to columns, or columns to rows. Transposing data can be useful for data analysis, as it allows you to pivot or unpivot your data according to your individual use case.
For example, the table below shows a record of parking lot entries and exits, with each row showing the entry and exit date for each car.
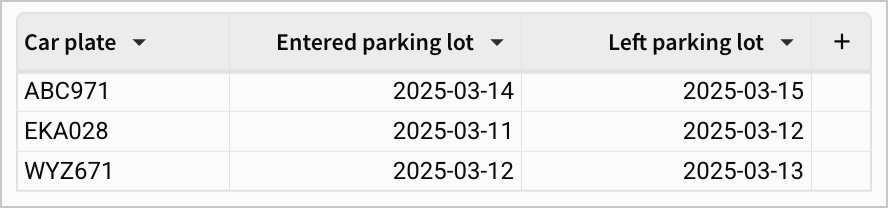
To shape the data such that all the date values are in a single row, a row to column transpose can be performed, resulting in the table transforming into something like this:
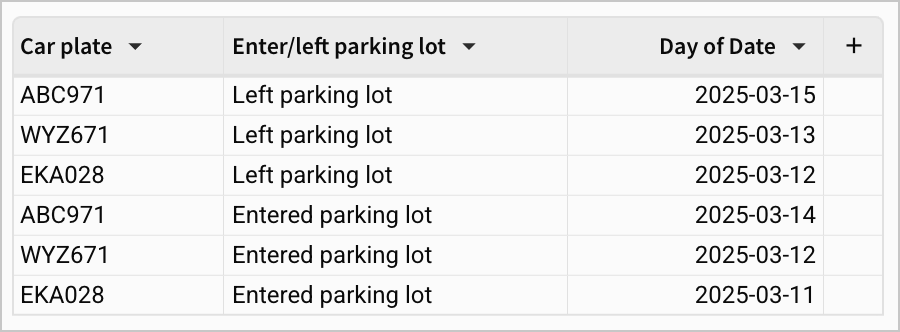
This can be especially useful for visualizations, as you may want to reshape your data to suit specific chart types –such as needing date values oriented in a single column for line charts).
This document explains how to transpose your data from [rows to columns](/docs/transpose-a-table#transpose-row-to-columns), or [columns to rows](/docs/transpose-a-table#transpose-columns-to-rows), and includes examples of each.
## System and user requirements
You must be the workbook owner or be granted **Can explore** or **Can edit** access to the workbook.
## Limitations
The following is not supported:
* Transposing input tables.
* Transposing calculated columns. If you transpose a table with calculated columns, any existing filtering, sorting or grouping is not reflected in the transposed output. This is because transposing is performed on the data from your data platform, not the data element in your workbook.
In addition, the following limitation applies:
* When transposing rows to columns, a limit of 200 unique row values can be transposed from a single column, resulting in a maximum of 200 columns. There is no limit when transposing columns to rows.
## Notes
* The columns in a row-to-column transposed table do not dynamically update based on changes to the connected data source. Changing the data source of a row-to-column transposed table does not change the available columns, and might result in data from the original data source being displayed as a column, even if that data is not present on the current data source.
* For example, if a `PROD` version of a workbook contains a row-to-column transposed table, and the `DEV` version changes the data source of that table, the column names reflect the rows from the data source in the `PROD` version, not the `DEV` version.
## Transpose row to columns
You can transpose table rows to columns to use the values of a given column as the column headers for a table. For example, transpose the rows of a *Store Region* column to use the values of the *Store Region* column (East, Midwest, South, and so on) as column headers and view aggregate values for those region values.
To transpose rows to columns:
1. From your desired table, select  **More**.
2. From **Element source**, select **Transpose**.
3. In the **Transpose Table** modal, select **Row to column**.
4. Select your desired **Column to transpose**. When transposed, the data in this column is rearranged such that each unique value becomes a new column.
If your selected column has more than 200 unique values, resulting in more than 200 columns in a transposed table, an error appears.
5. Select your **Value column**. This is the column that is used for the calculation that you select in **Aggregate**.
6. Select your preferred **Aggregate** method. The aggregation methods shown vary based on the data type of the selected **Value column**.
7. Select the checkboxes next to your desired **Output columns**. These are the columns you want included in the transposed output, and do not impact any other calculations in the transpose. A preview of your transposed table is available under **Output preview**.
* The order you select the columns in is the order they appear in the table, from left to right.
* Any remaining source columns from the original source table are used to group the transpose. For an example of these groupings, see [Example: Counting games won and lost](#example-counting-games-won-and-lost). For more information on groupings in general, see [Group columns in a table in Create and manage tables](/docs/create-and-manage-tables#group-columns-in-a-table).
8. Select **Submit**.
### Example: Counting games won and lost
For example, you might have a table of baseball games that your team has played at home, with one row of data for each game played and columns for opponent, result, and division rank after the game.
If you want to calculate the total games that your team has won or lost at each division rank, you can transpose the table by division rank.
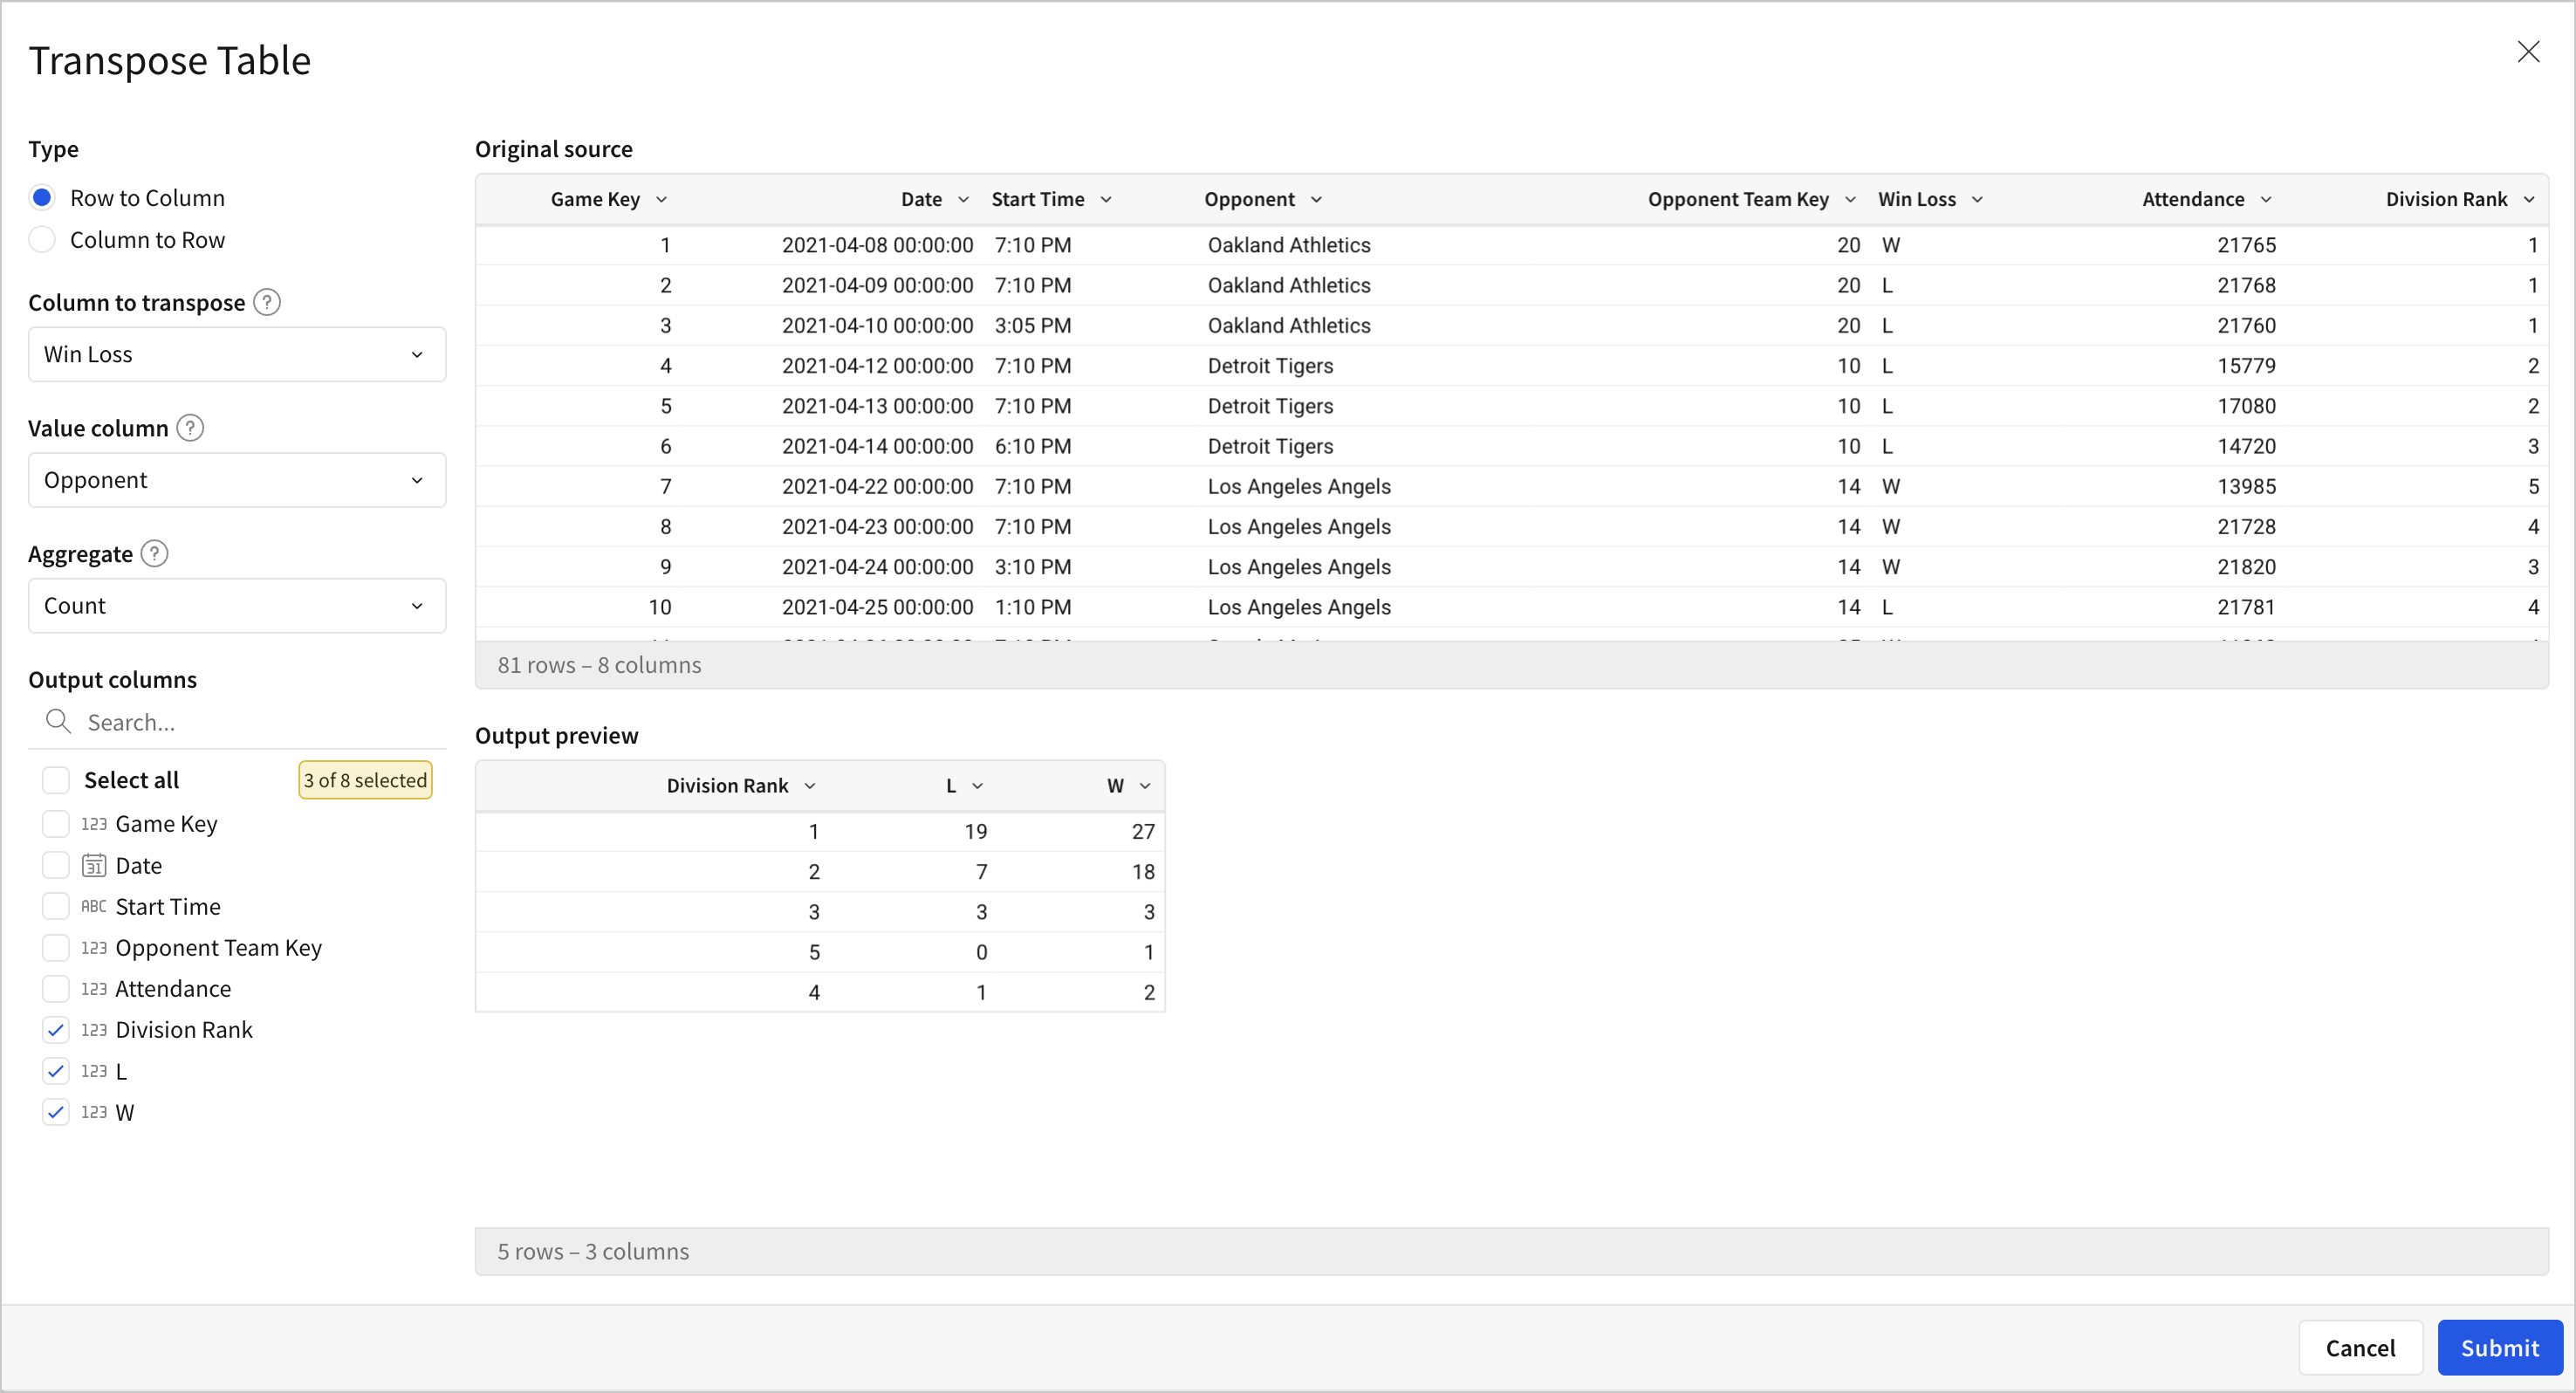
To obtain this count:
1. Select **Row to column** transpose.
2. To set **L** (Loss) and **W** (Win) as the column headers for the transposed table, select **Win Loss** as the **Column to transpose**. The **L** (Loss) and **W** (Win) values appear as new columns in the transposed table.
3. To calculate the number of wins or losses for a given opponent, select Opponent as the **Value Column**.
4. To calculate the number of non-null and non-empty values, select **Count** for the **Aggregate**.
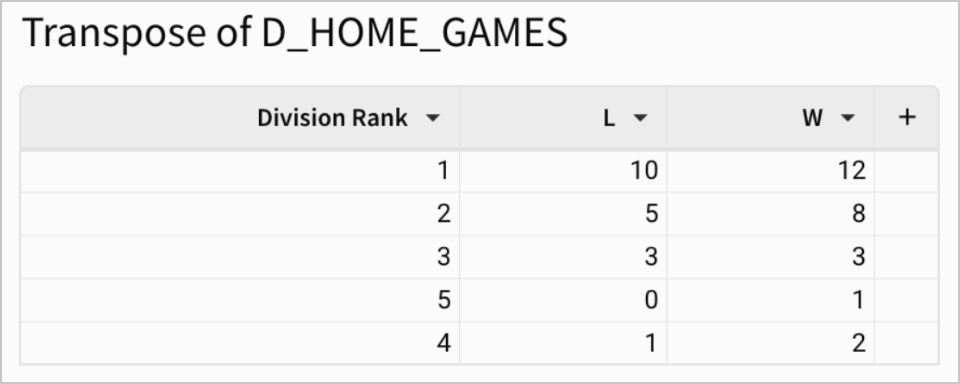
5. Select **Division Rank**, **L** and **W** as **Output columns**. The table output is automatically grouped by **Division Rank**, as that is the only remaining source column. This sums the total **Count** of wins and losses at each division rank.
You might want the output to be additionally grouped by another column, like **Start Time**. To do this:
1. In **Output columns**, select **Start Time** (keeping the existing selections of **Division Rank**, **L** and **W**). For each game start time, the transpose shows the number of wins and losses, at each division rank. Note that not all start times show all four division ranks, as no wins and losses were recorded at those times.
2. \[optional] To make the output easier to understand, you can also sort the **Start Time** column to ascending, so that the data is sorted from earliest to latest game in the day. In the **Start Time** column, right click or click the down arrow (
**More**.
2. From **Element source**, select **Transpose**.
3. In the **Transpose Table** modal, select **Row to column**.
4. Select your desired **Column to transpose**. When transposed, the data in this column is rearranged such that each unique value becomes a new column.
If your selected column has more than 200 unique values, resulting in more than 200 columns in a transposed table, an error appears.
5. Select your **Value column**. This is the column that is used for the calculation that you select in **Aggregate**.
6. Select your preferred **Aggregate** method. The aggregation methods shown vary based on the data type of the selected **Value column**.
7. Select the checkboxes next to your desired **Output columns**. These are the columns you want included in the transposed output, and do not impact any other calculations in the transpose. A preview of your transposed table is available under **Output preview**.
* The order you select the columns in is the order they appear in the table, from left to right.
* Any remaining source columns from the original source table are used to group the transpose. For an example of these groupings, see [Example: Counting games won and lost](#example-counting-games-won-and-lost). For more information on groupings in general, see [Group columns in a table in Create and manage tables](/docs/create-and-manage-tables#group-columns-in-a-table).
8. Select **Submit**.
### Example: Counting games won and lost
For example, you might have a table of baseball games that your team has played at home, with one row of data for each game played and columns for opponent, result, and division rank after the game.
If you want to calculate the total games that your team has won or lost at each division rank, you can transpose the table by division rank.

To obtain this count:
1. Select **Row to column** transpose.
2. To set **L** (Loss) and **W** (Win) as the column headers for the transposed table, select **Win Loss** as the **Column to transpose**. The **L** (Loss) and **W** (Win) values appear as new columns in the transposed table.
3. To calculate the number of wins or losses for a given opponent, select Opponent as the **Value Column**.
4. To calculate the number of non-null and non-empty values, select **Count** for the **Aggregate**.
5. Select **Division Rank**, **L** and **W** as **Output columns**. The table output is automatically grouped by **Division Rank**, as that is the only remaining source column. This sums the total **Count** of wins and losses at each division rank.
You might want the output to be additionally grouped by another column, like **Start Time**. To do this:
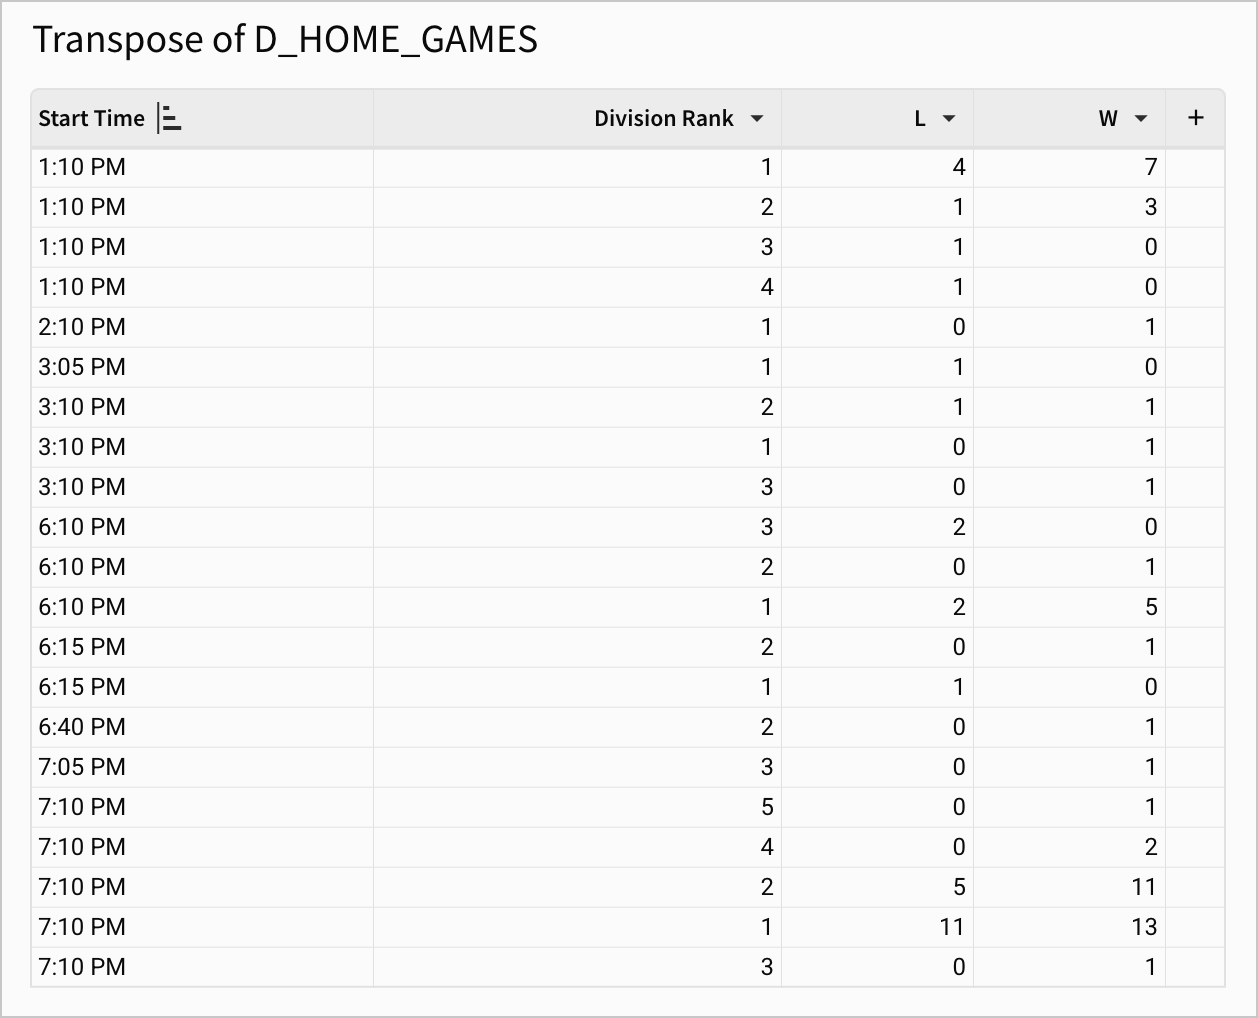
1. In **Output columns**, select **Start Time** (keeping the existing selections of **Division Rank**, **L** and **W**). For each game start time, the transpose shows the number of wins and losses, at each division rank. Note that not all start times show all four division ranks, as no wins and losses were recorded at those times.
2. \[optional] To make the output easier to understand, you can also sort the **Start Time** column to ascending, so that the data is sorted from earliest to latest game in the day. In the **Start Time** column, right click or click the down arrow ( ) to open the column menu, then select **Sort ascending**. Once sorted, the output will look something like:
You might also want to find out the number of unique opponents that your team has won or lost against at each division rank. To obtain this:
* Change the **Aggregate** method to **CountDistinct**. **CountDistinct** provides the number of unique values within the **Opponent** column. The values represent the number of different opponents the team has beaten at each division rank. Your output will look something like:
## Transpose columns to rows
1. From your desired table, select **More**.
2. From **Element source**, select **Transpose**.
3. In the **Transpose Table** modal, select **Column to row**.
4. Select your **Columns to merge**.
5. Enter a **Column label for merged columns**. This label is the column header of the new column that contains the previous header values of the merged columns.
6. Enter a **Column label for values**. This is your column headers for the new column containing the values of your merged columns.
7. Select the checkboxes next to your desired **Output columns**. These are the columns you want included in the transposed output, and do not impact any other calculations in the transpose. A preview of your transposed table is available under **Output preview**.
8. Select **Submit**.
### Example: Merging audit log event times
For example, you might have a table of audit log events. Each row details one unique table sync, with information like connector ID, table name, write to table start/end, sync start/end, and unique table sync key.
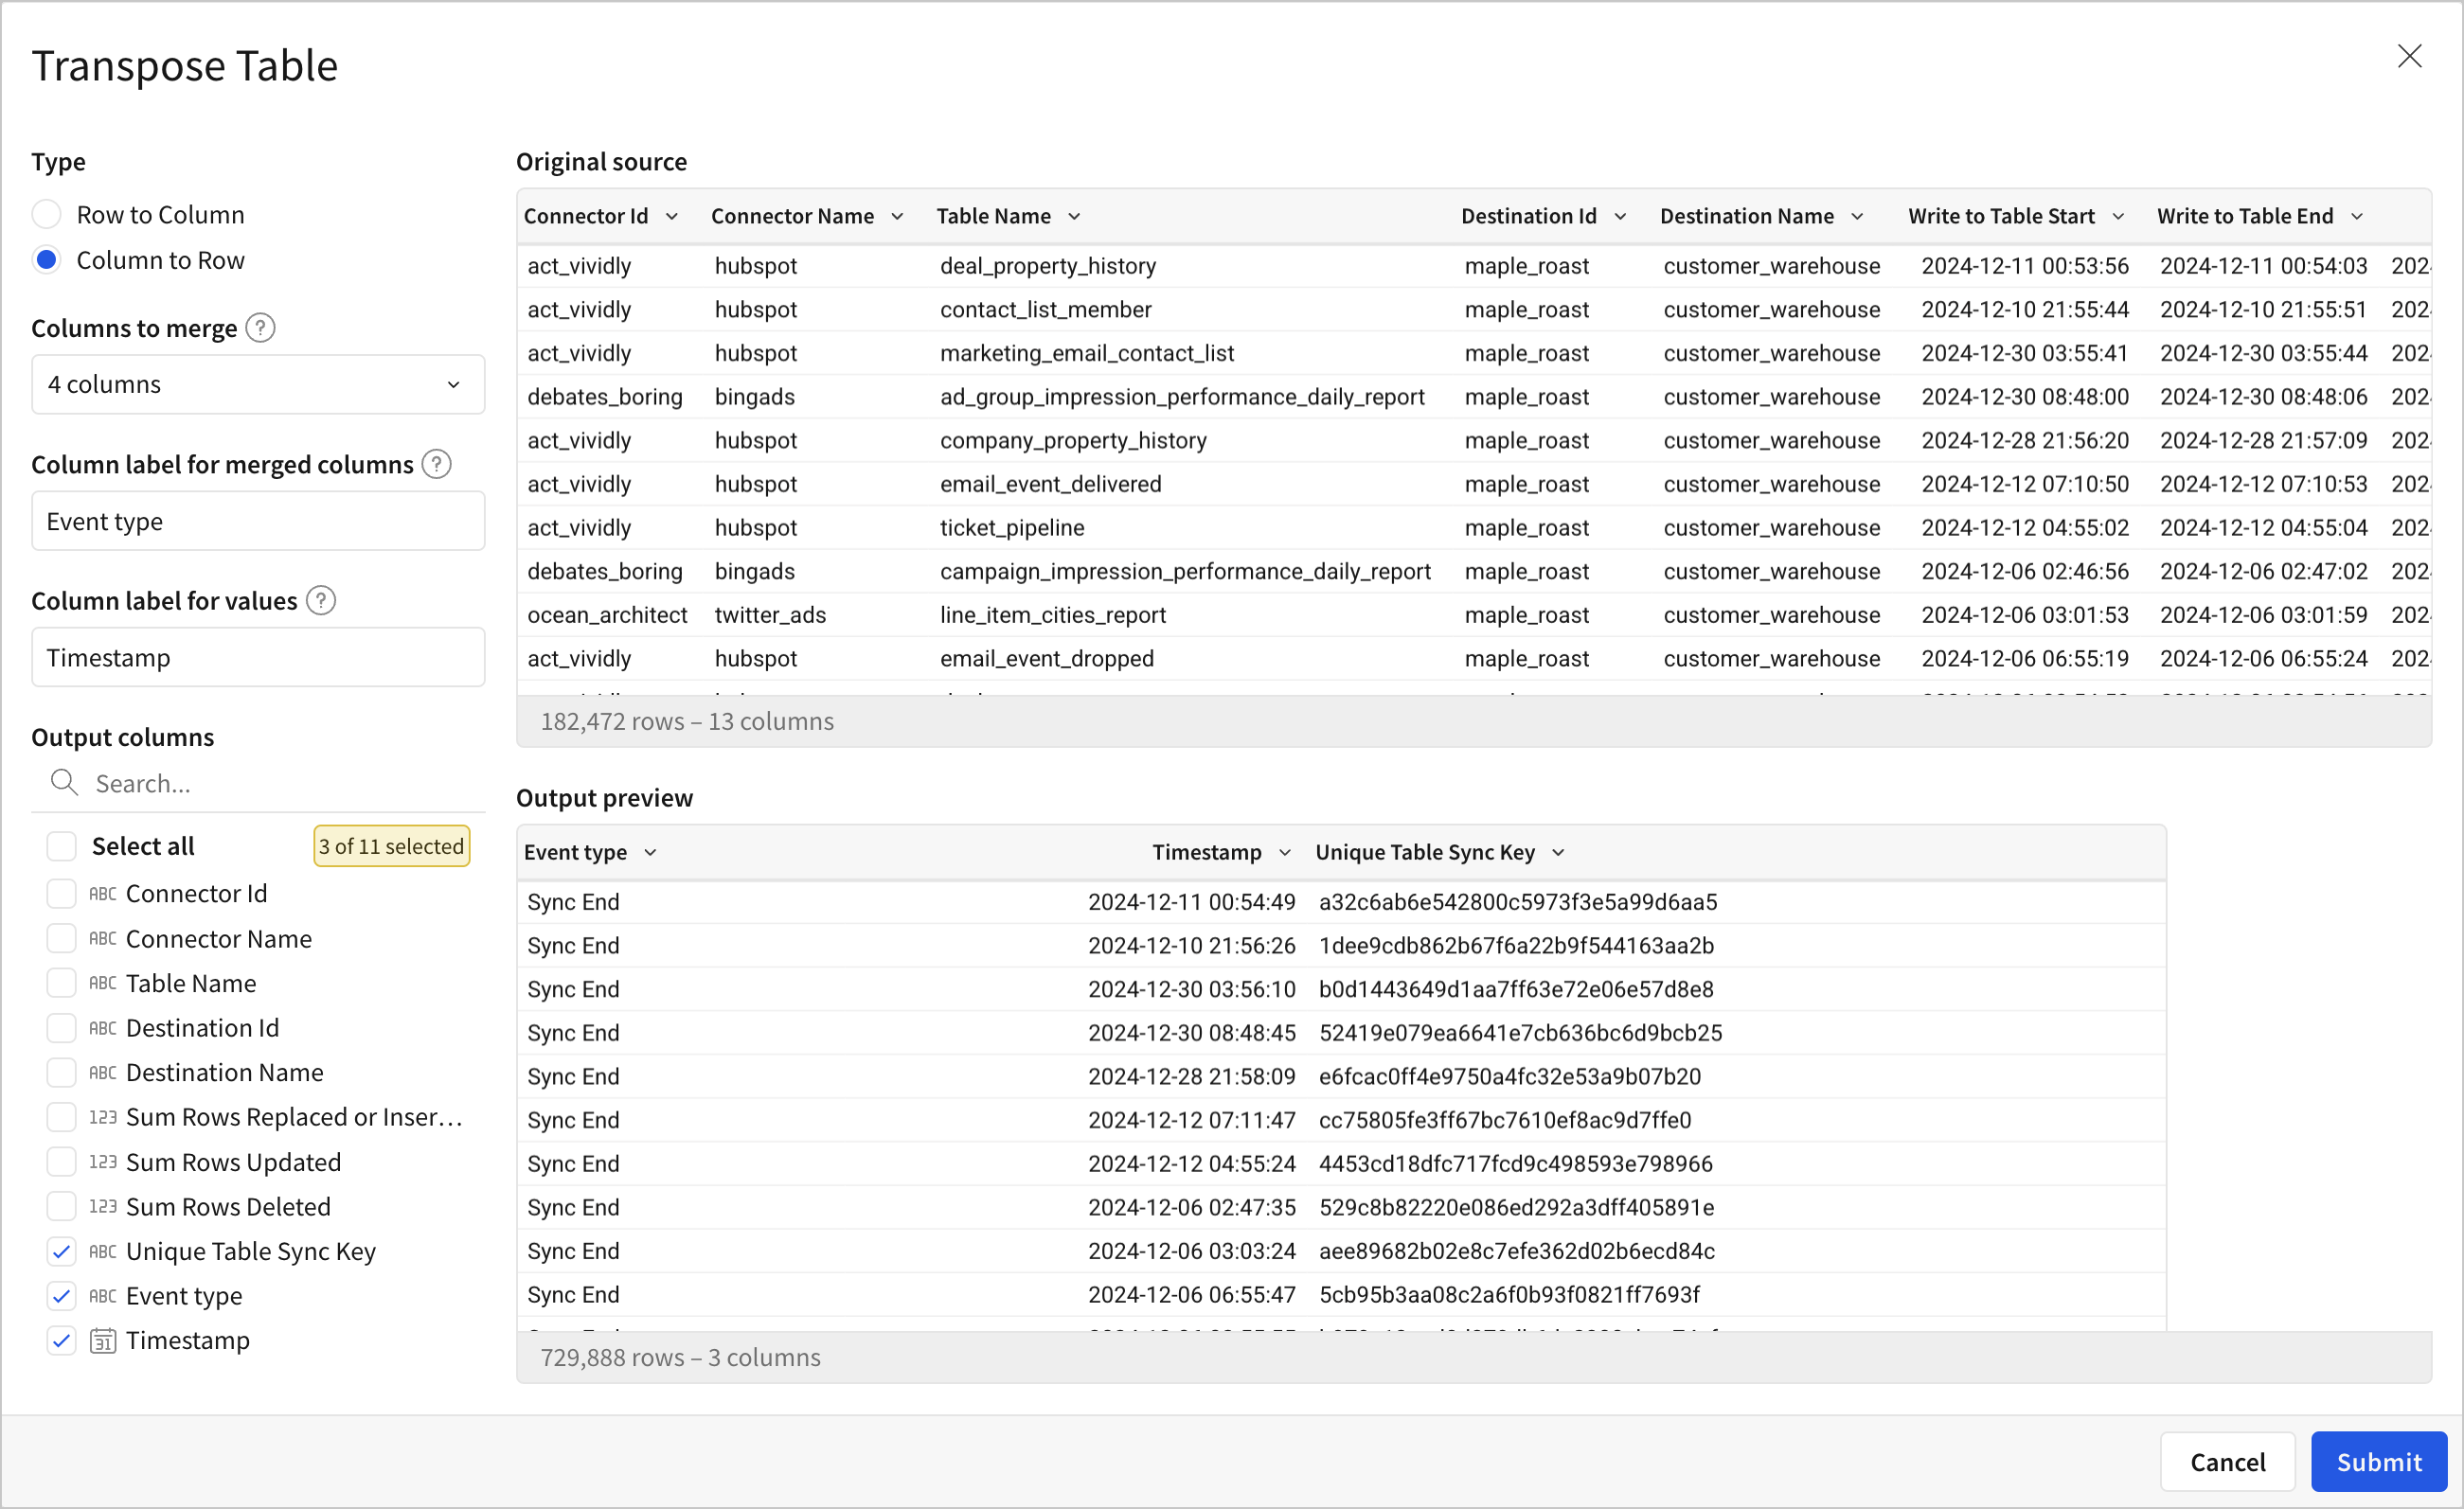
If you want a table with rows for every table event and its timestamp, you can transpose the table and merge these columns. To obtain this new table:
1. Select **Column to row** transpose.
2. For **Columns to merge**, select **Write to Table Start**, **Write to Table End**, **Sync Start** and **Sync End**. These are all merged into one column.
3. For **Column label for merged columns**, enter **Event Type** as the name for the merged column.
4. For **Column label for values**, enter **Timestamp**.
5. Select the rows you want represented in the table: **Unique Table Sync Key** (so it is clear which table the event is linked to), and the new columns, **Event type** and **Timestamp**.
6. \[optional] To make the output easier to understand, you can also sort the **Unique Table Sync Key** column to ascending, so that the events for each table are in ordered rows. To sort a table by one column ascending, right-click or click the down arrow () to open the column menu, then select **Sort ascending**.
## Undo a transpose
The most effective way to undo a transpose is to change the source of your element to the original data source. For details, see [Change the data source for a workbook, data model, or element](/docs/change-the-data-source-for-a-workbook-data-model-or-element).
) to open the column menu, then select **Sort ascending**. Once sorted, the output will look something like:

You might also want to find out the number of unique opponents that your team has won or lost against at each division rank. To obtain this:
* Change the **Aggregate** method to **CountDistinct**. **CountDistinct** provides the number of unique values within the **Opponent** column. The values represent the number of different opponents the team has beaten at each division rank. Your output will look something like:

## Transpose columns to rows
1. From your desired table, select **More**.
2. From **Element source**, select **Transpose**.
3. In the **Transpose Table** modal, select **Column to row**.
4. Select your **Columns to merge**.
5. Enter a **Column label for merged columns**. This label is the column header of the new column that contains the previous header values of the merged columns.
6. Enter a **Column label for values**. This is your column headers for the new column containing the values of your merged columns.
7. Select the checkboxes next to your desired **Output columns**. These are the columns you want included in the transposed output, and do not impact any other calculations in the transpose. A preview of your transposed table is available under **Output preview**.
8. Select **Submit**.
### Example: Merging audit log event times
For example, you might have a table of audit log events. Each row details one unique table sync, with information like connector ID, table name, write to table start/end, sync start/end, and unique table sync key.
If you want a table with rows for every table event and its timestamp, you can transpose the table and merge these columns. To obtain this new table:

1. Select **Column to row** transpose.
2. For **Columns to merge**, select **Write to Table Start**, **Write to Table End**, **Sync Start** and **Sync End**. These are all merged into one column.
3. For **Column label for merged columns**, enter **Event Type** as the name for the merged column.
4. For **Column label for values**, enter **Timestamp**.
5. Select the rows you want represented in the table: **Unique Table Sync Key** (so it is clear which table the event is linked to), and the new columns, **Event type** and **Timestamp**.
6. \[optional] To make the output easier to understand, you can also sort the **Unique Table Sync Key** column to ascending, so that the events for each table are in ordered rows. To sort a table by one column ascending, right-click or click the down arrow () to open the column menu, then select **Sort ascending**.
## Undo a transpose
The most effective way to undo a transpose is to change the source of your element to the original data source. For details, see [Change the data source for a workbook, data model, or element](/docs/change-the-data-source-for-a-workbook-data-model-or-element).