> For clean Markdown of any page, append .md to the page URL.
> For a complete documentation index, see https://help.sigmacomputing.com/llms.txt.
> For AI client integration (Claude Code, Cursor, etc.), connect to the MCP server at https://help.sigmacomputing.com/_mcp/server.
# Sparkline
The **Sparkline** function creates sparkline charts from an array of JSON objects. If you want to create sparklines without JSON data, see [SparklineAgg](/docs/sparklineagg).
## Syntax
```
Sparkline(JSON)
```
### Function arguments
| | |
| :------- | :----------------------------------------------------------------------------------------------------------------------------------------------------------------------------------------------------------------------------------------------------------------------------------------------------------------------------------------------------------------------------------------------------------------------------------------- |
| **JSON** | The column containing JSON values, to be used for the sparkline.
|
## Notes
* To create meaningful sparklines, add a grouping to your table. Groupings ensure multiple values are available for use in the sparkline. For more information on groupings, see [Group columns in a table](/docs/create-and-manage-tables#group-columns-in-a-table).
* **Sparkline** charts the values provided in the JSON column and returns variant data that renders as a sparkline chart in the table. You cannot copy from the chart canvas.
* To format the chart output of **Sparkline** (color, chart type, interpolation, etc), see [Format sparklines](/docs/create-sparklines-in-a-table#format-sparklines) in [Create sparklines in a table](/docs/create-sparklines-in-a-table).
## Example
A table, **PLUGS\_ELECTRONICS\_HANDS\_ON\_LAB\_DATA**, contains information on an electronic retailer’s sales, including columns such as:
* *Product Name*: Name of the electronic product sold.
* *Month and Quantity Sold*: JSON data formatted as `{x: [Date when an item was sold truncated to month], y: [Sum of quantity sold]}`. For example:
```json
[ { "x": "2021-06-01 00:00:00.000 -0700", "y": 132}, { "x": "2021-07-01 00:00:00.000 -0700", "y": 167 }]
```
The table is grouped by *Product Name*, so the *Month and Quantity Sold* reflects the sum of each product sold per month.
To see how the sales of each product have changed month to month, you can use **Sparkline**:
```
Sparkline([Month and Quantity Sold])
```
Your table may look something like:
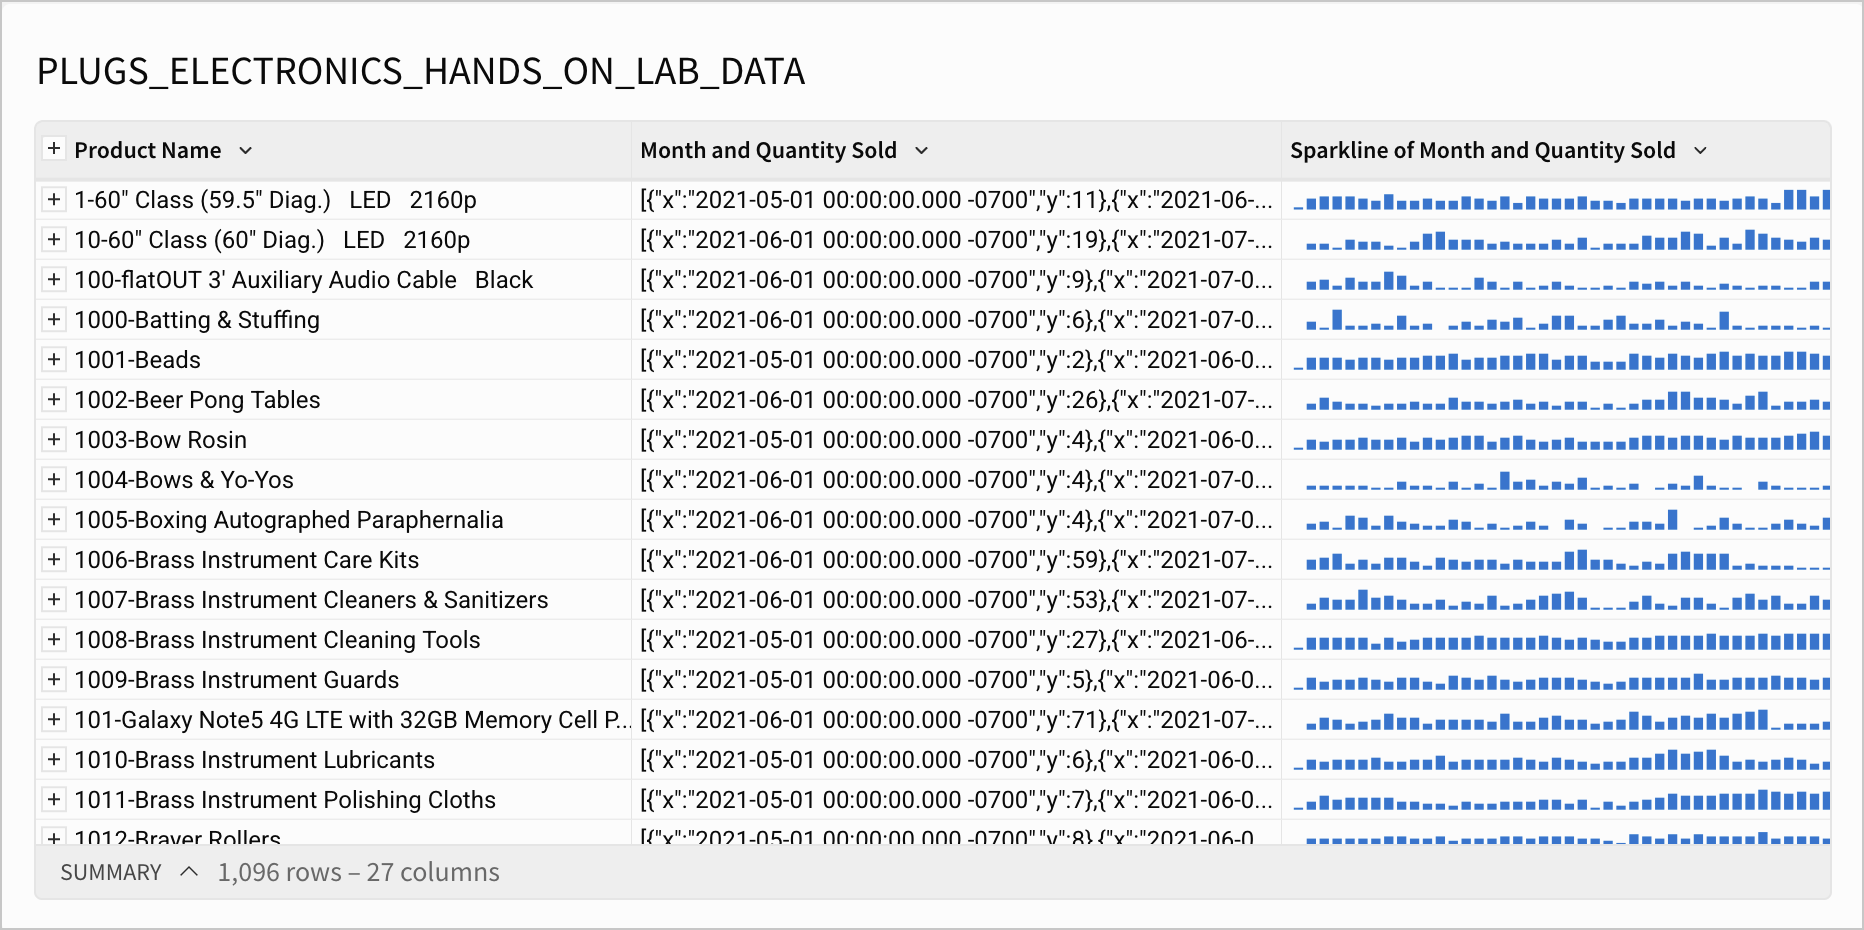
The sparklines here represent changes in the quantity of each product sold by month.
If you want to change the format (e.g. chart type, color, interpolation) of your sparklines, see [Format sparklines](/docs/create-sparklines-in-a-table#format-sparklines) in [Create sparklines in a table](/docs/create-sparklines-in-a-table).