> For clean Markdown of any page, append .md to the page URL.
> For a complete documentation index, see https://help.sigmacomputing.com/llms.txt.
> For AI client integration (Claude Code, Cursor, etc.), connect to the MCP server at https://help.sigmacomputing.com/_mcp/server.

# Maps

You can create three different types of map in Sigma - region, point, and geography. These allow you to create interactive maps for a variety of use cases.

Use a map when you want to:

* Visualize differences in one or more measures by region.
* Chart locations based on latitude and longitude coordinates.
* Map GeoJSON data or [Geography](/docs/data-types-and-formats#geography) data.

## User requirements

The ability to create maps and other charts requires the following:

* You must be assigned an [account type](/docs/account-type-and-license-overview) with the **Create, edit, and publish workbooks** and/or **Explore workbooks permission** enabled.
* You must be the workbook owner or be granted **Can explore** or **Can edit** [access to the workbook](/docs/folder-and-document-permissions).

If you’re granted **Can explore** access to the workbook, you can create and modify chart properties and formatting while exploring, but you cannot publish your changes.

## Considerations

* To map geography data, you must use valid longitude and latitude coordinates. This applies to all geospatial objects, including points, lines, and polygons.

## Create a map

You can create a map in one of two ways:

* In the **Add element** bar, select **Chart**, and then select one of **Region**, **Point**, or **Geography**.
* From an existing data element, select <img src="https://sigma-docs-screenshots.s3.us-west-2.amazonaws.com/Icons/add-dependent.svg" alt="" /> **Create child element** > **Chart**. In the editor panel, set the **Chart** type to one of **Map - Region**, **Map - Point**, or **Map - Geography**.

Once created, you can configure the map by adding data to the required fields:

* For **Map - Region** charts, select <img src="https://sigma-docs-screenshots.s3.us-west-2.amazonaws.com/Icons/add.svg" alt="" /> **Add column...** in the **Region** section of the editor panel, and add a text column. See [Map - Region](#map---region) for more information.
* For **Map - Point** charts, select <img src="https://sigma-docs-screenshots.s3.us-west-2.amazonaws.com/Icons/add.svg" alt="" /> **Add column...** in the **Latitude** and **Longitude** sections of the editor panel, and add a number column to each. See [Map - Point](#map---point) for more information.
* For **Map - Geography** charts, select <img src="https://sigma-docs-screenshots.s3.us-west-2.amazonaws.com/Icons/add.svg" alt="" /> **Add column...** in the **Geography** section of the editor panel, and add a properly formatted variant column. See [Map - Geography](#map---geography) for more information.

## Map types

Workbooks support three distinct map types: Region, Point and Geography. Choose your map type based on your data and use case.

For example, if you have a dataset of sales orders with a `State` column, and want to visualize sales by state, you can create a region map that sums the sales for each state and displays the results on a map with a color gradient.

See example visuals and use cases for each map type below:

* [Map - Region](#map---region)
* [Map - Point](#map---point)
* [Map - Geography](#map---geography)

### Map - Region

Region maps allow you to visualize one or more measures by region. The example below uses a `State` column to separate sales records by US state, and color-code the states on the map according to the quantity of sales orders.
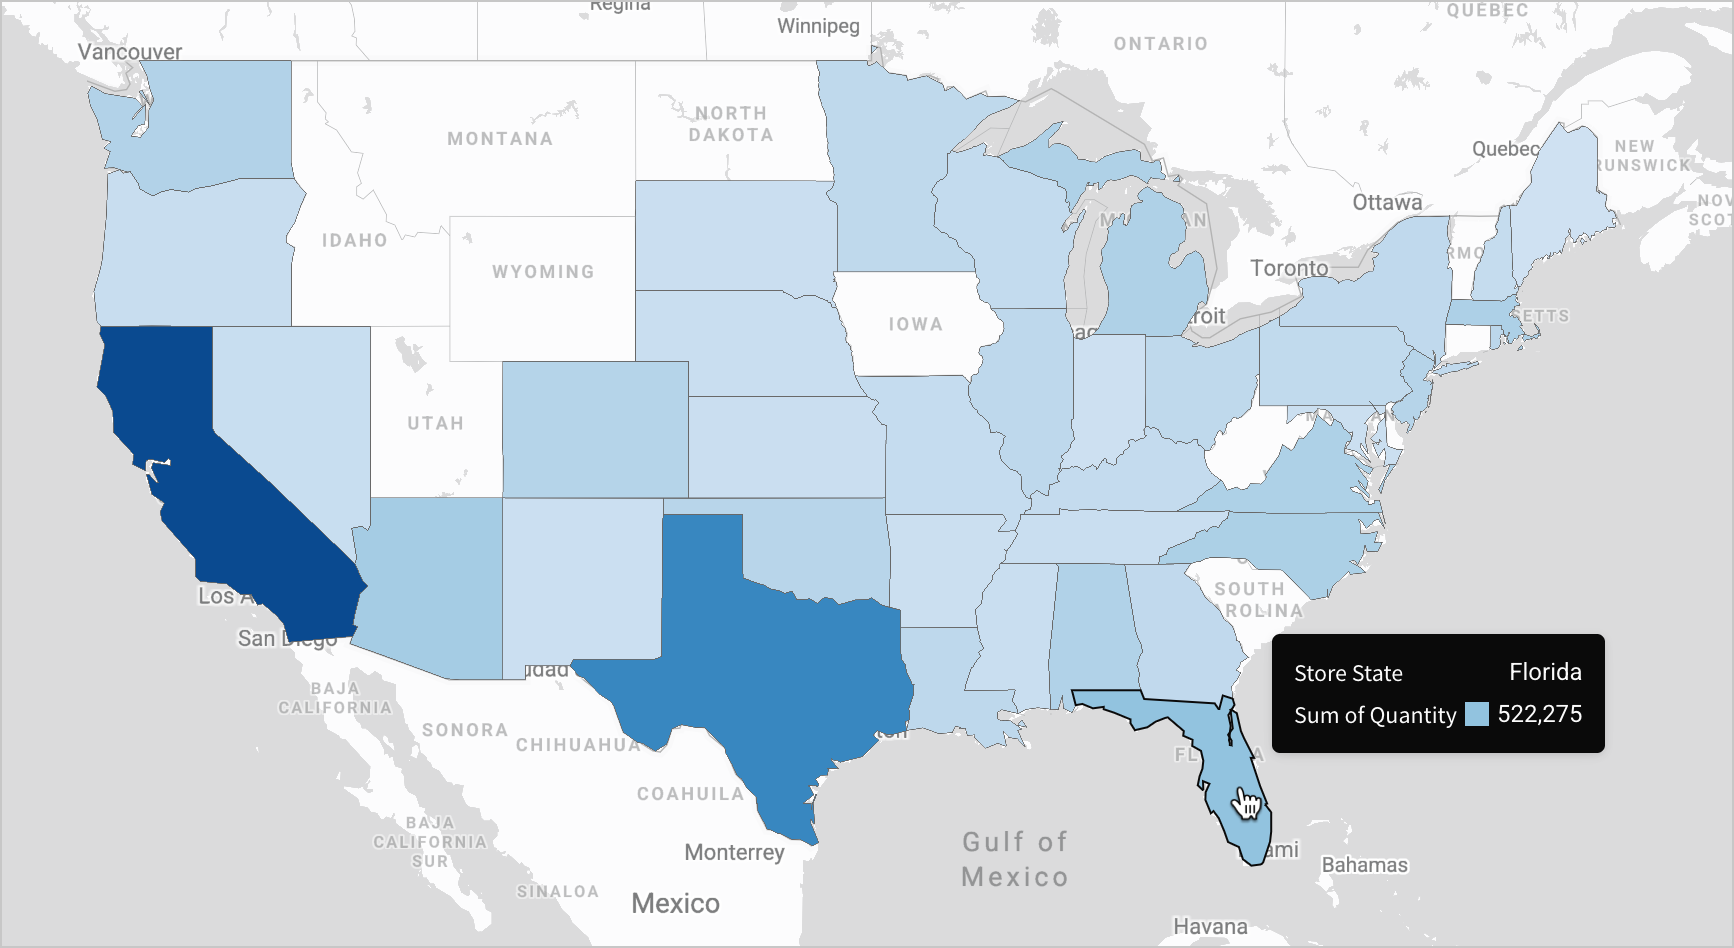
![An example of a region map shows color-coded sales quantities for a store by US state. An on-hover tooltip shows a little over 500,000 sales in Florida.](https://files.buildwithfern.com/sigma.docs.buildwithfern.com/4bbf7365ac49dd59d5583dd83c953099bea4680b489d7abbb07892fdf16e733a/assets/docs-images/ed0d0bc706de11af2cc2d807330cf29c69a8a78e0780b9943f2514306c0b8382-Region_map_example.png)

Region maps require a single [text column](/docs/data-types-and-formats) in the **Region** property. Column values must match one of the following region types and be consistent within the column.

You can download a list of valid [country names](https://sigma-docs-screenshots.s3.us-west-2.amazonaws.com/downloads/map_countries.txt) and [US county names](https://sigma-docs-screenshots.s3.us-west-2.amazonaws.com/downloads/county.txt) that Sigma supports for region maps.

<table>
  <thead>
    <tr>
      <th>
         Region type
      </th>

      <th>
        Supported identifiers
      </th>
    </tr>
  </thead>

  <tbody>
    <tr>
      <td>
        Canadian provinces
      </td>

      <td>
        <ul><li>Name (e.g., `Ontario`, `Alberta`, `British Columbia`)</li><li>Abbreviation (e.g., `ON`, `AB`, `BC`)</li></ul>
      </td>
    </tr>

    <tr>
      <td>
        Countries
      </td>

      <td>
        <ul><li>Name (e.g., `United States`, `United States of America`, `Australia`, `United Kingdom`)</li><li>Initialism (e.g., `U.S.A.`, `AUS`, `U.K.`)</li><li>ISO 3166-1 alpha-2 code (e.g., `US`, `AU`, `GB`)</li><li>ISO 3166-1 alpha-3 code (e.g.,`USA`, `AUS`, `GBR`)</li><li>ISO 3166-1 numeric-3 code (e.g., `840`, `826`, `036`)</li></ul>
      </td>
    </tr>

    <tr>
      <td>
        US CBSA/MSA
      </td>

      <td>
        <ul><li>CBSA/MSA code (e.g., `San Francisco-Oakland-Hayward, CA`, `New York-Newark-Jersey City, NY-NJ-PA`, `Denver-Aurora-Lakewood, CO`)</li></ul>
      </td>
    </tr>

    <tr>
      <td>
        US counties
      </td>

      <td>
        <ul><li>County name, state name (e.g., `Alameda, California`, `Kings, New York`, `Denver, Colorado`)</li><li>FIPS code (e.g., `06001`, `36047`, `08031`)</li></ul>

        <p>County names must not include the words "County" or "Parish."</p>
      </td>
    </tr>

    <tr>
      <td>
        US postal places 

        *(cities)*
      </td>

      <td>
        <ul><li>City name, state abbreviation (e.g., `Oakland, CA`, `New York, NY`, `Denver, CO`)</li></ul>
      </td>
    </tr>

    <tr>
      <td>
        US states
      </td>

      <td>
        <ul><li>Name (e.g., `California`, `New York`, `Colorado`)</li><li>Abbreviation (e.g., `CA`, `NY`, `CO`)</li></ul>
      </td>
    </tr>

    <tr>
      <td>
        US zip codes
      </td>

      <td>
        <ul><li>5 digit zip codes (e.g., `94601`, `11226`, `80219`)</li><li>3 digit zip codes (e.g., `281`, `790`, `802`)</li></ul>
      </td>
    </tr>
  </tbody>
</table>

Region values are not case sensitive. For example, the value for the state of California can be `California`, `california`, `CA`, `Ca`, or `ca`. However, all values in the column should use the same supported identifier and capitalization for data consistency.

### Map - Point

Point maps allow you to visualize one or more locations using points on a world map, and optionally use the color and size of the points to indicate how the locations vary. The example below shows airports in the United States, with larger, redder dots indicating airports with a higher average delay for departing flights.

![An example of a point map shows the location of several US airports. Points appear larger and redder based on how delayed flights are in leaving each airport.](https://files.buildwithfern.com/sigma.docs.buildwithfern.com/4bc4df49bbdc3871f3f81cf55e3136a4e8f7e88da279bae5d08790c7e0ef80d1/assets/docs-images/adf9bc4c9ba80d181b64c0ffcba7265bc12c05c1128755e7529f061a33d56746-Point_Map_Example.png)

Point maps require a [number column](/docs/data-types-and-formats#number) for the map's **Latitude** and **Longitude** settings.

### Map - Geography

In the **Map - Geography** chart, you can use either GeoJSON data or the [Geography data type](/docs/data-types-and-formats#geography), which allow for more complex geographical data than region or point maps.

For example, the chart below shows the GeoJSON point `{"type": "Feature", "geometry": {"type":"Point","coordinates":[-122.4194,37.7749]}}` as a dot on the map.

![An example of a point map shows a single dot on the map representing a point in San Francisco.](https://files.buildwithfern.com/sigma.docs.buildwithfern.com/9f31633dbd80c61cf1336a6d42f8691908a2f8ea33d67104c9a643f5894003c1/assets/docs-images/700021a0cbc9ec95b5e85cebcc0f9e45c4de053b23dff121644690b794bf14e5-Point_from_JSON.png)

You can alternatively format the data in this example as:

* `{"geometry": {"type":"Point","coordinates":[-122.4194,37.7749]}}`
* `{"type":"Point","coordinates":[-122.4194,37.7749]}`
* `MakePoint(-122.4194, 37.7749)` (using the [MakePoint](/docs/makepoint) function, which returns the Geography data type)

The **Map - Geography** chart type supports a [Geography](/docs/data-types-and-formats#geography), [Variant](/docs/data-types-and-formats#variant), or [Text](/docs/data-types-and-formats#text) data column on the map's **Geography** field. If you use Variant or Text data, it must be in GeoJSON format. If your Text data is in WKT format instead, convert it to the Geography data type first using the [Geography](/docs/geography) function.

For more information on advanced settings, see [Build a geography map](/docs/build-a-geography-map).

## Related resources

* [Intro to charts](/docs/intro-to-visualizations)
* [Build a geography map](/docs/build-a-geography-map)
* [Display chart data labels](/docs/display-chart-data-labels)
