> For clean Markdown of any page, append .md to the page URL.
> For a complete documentation index, see https://help.sigmacomputing.com/llms.txt.
> For AI client integration (Claude Code, Cursor, etc.), connect to the MCP server at https://help.sigmacomputing.com/_mcp/server.
# Lesson five: Controls and actions
> Sigma Fundamentals for Builders: lesson five covers controls and actions with hands-on workbook exercises.
Welcome to lesson five: Controls and actions.
In the last lesson, we built our first charts and visualizations, and our dashboard began to take shape. We also learned more about lineage in Sigma to help simplify our development process.
Now, we’ll make our dashboard interactive for end users by configuring controls and actions. At the end of this lesson, our dashboard will have several customizable controls that filter our parent data table and update our visualizations.
This lesson covers the following Sigma features:
* Controls
* Converting filters to controls
* Placing filters on parent elements
* Actions
* Conditional actions
## Creating basic interaction with controls
[Controls](/docs/intro-to-control-elements) are Sigma elements that allow you to define specific interactions a user can have with your workbook. This might include filters for tables and charts or input fields for user data entry. There are [many different types of controls](/docs/intro-to-control-elements#types-of-controls), each of which offers different functionality.
To start, let’s configure a few basic controls to let users filter data on the dashboard pages. We can use controls to filter our parent table, which then updates any child chart elements to reflect the filtered dataset.
There are two main methods for creating a filter control:
* Creating a control from the **Add element** bar and then configuring it to target a table
* Creating a filter on a table and then converting it to a page control
This lesson covers both of these methods.
### Creating a control from the Add element bar
Let’s start by creating a control from the **Add element** bar, and targeting our parent table.
1. Open your workbook for editing, and navigate to the **Departure Delay vs Arrival Delay** page.
2. In the **Add element bar**, select **Controls** > **Date range**.
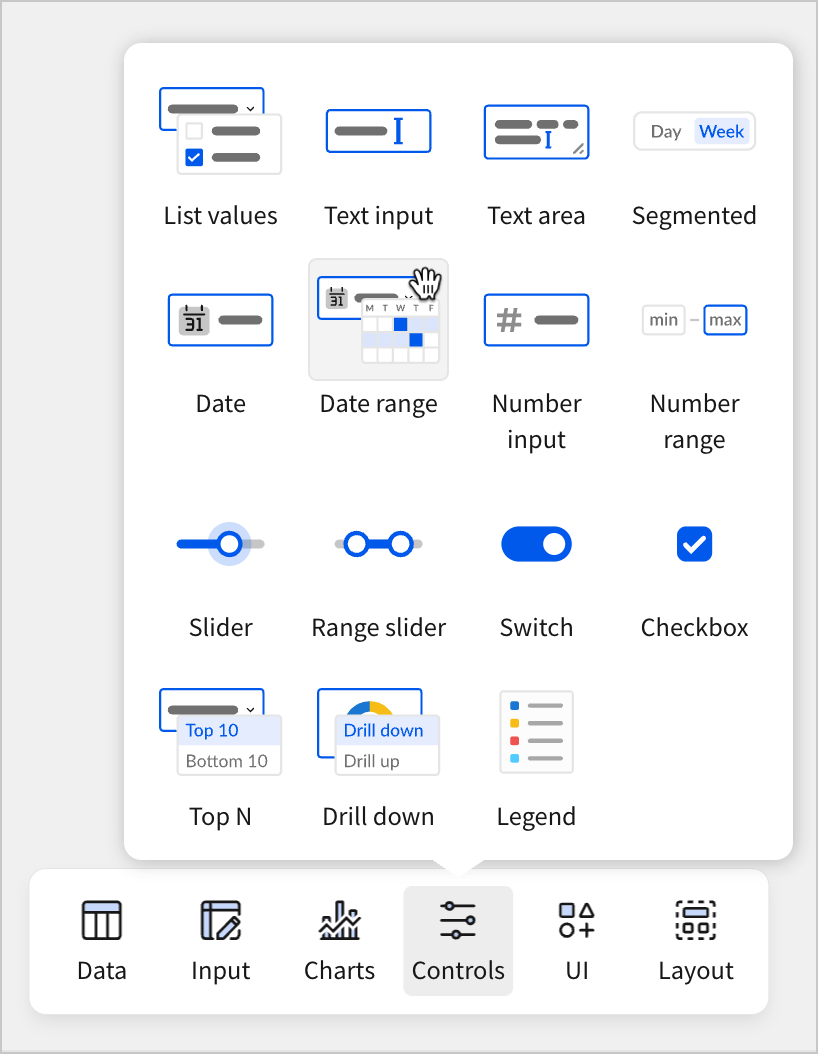
This creates a new date range control with default settings.
3. Select the date range control. It displays options for selecting a date range.
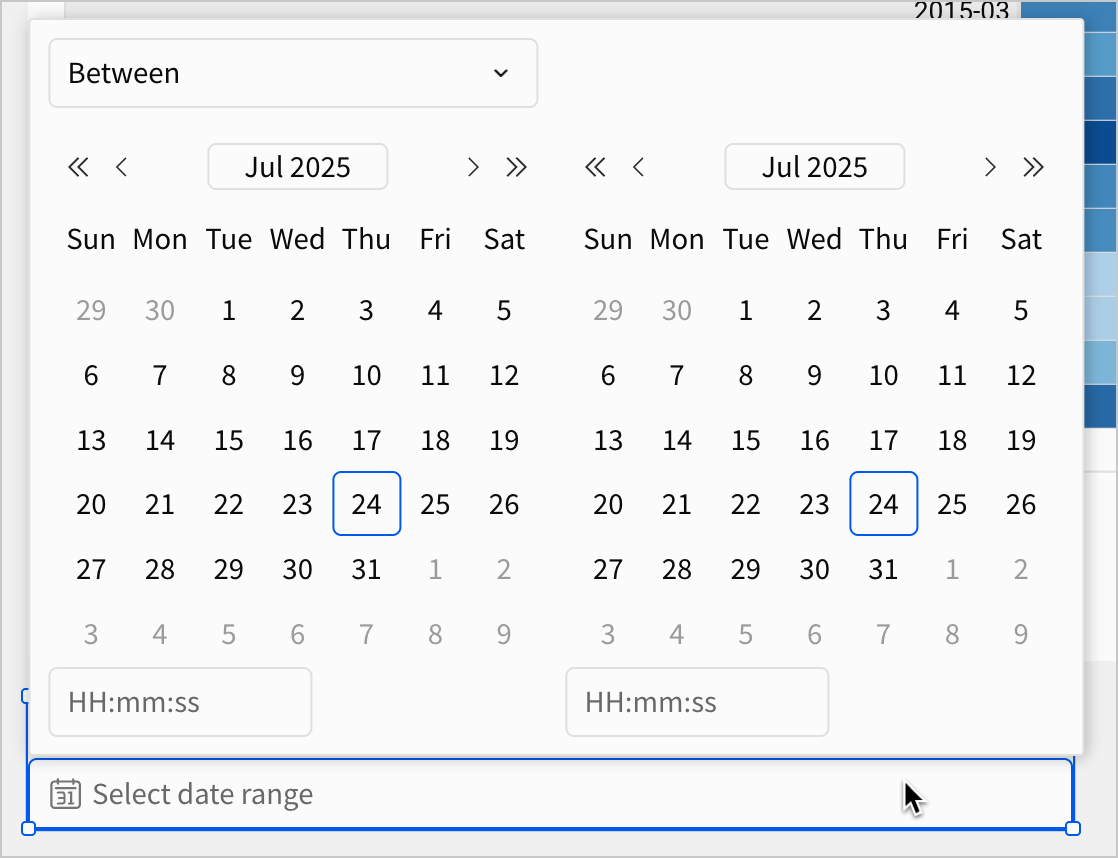
4. Make a selection in the date range control.
For example, select the range `07/01/2015` to `07/31/2015`. Notice that even after making this selection in the control, nothing changes about our dashboard. Our tables are not filtered to the date range we selected. This is because we haven’t configured the control to target any elements.
5. Clear the date range control.
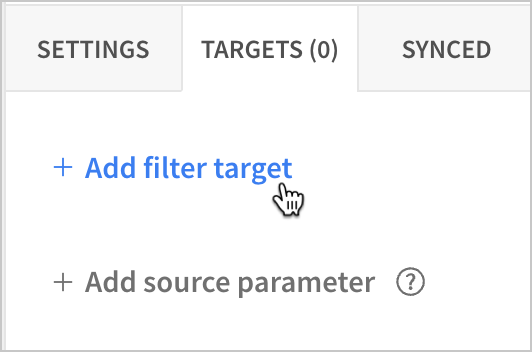
6. In the editor panel, select **Targets (0)** and then  **Add filter target**.
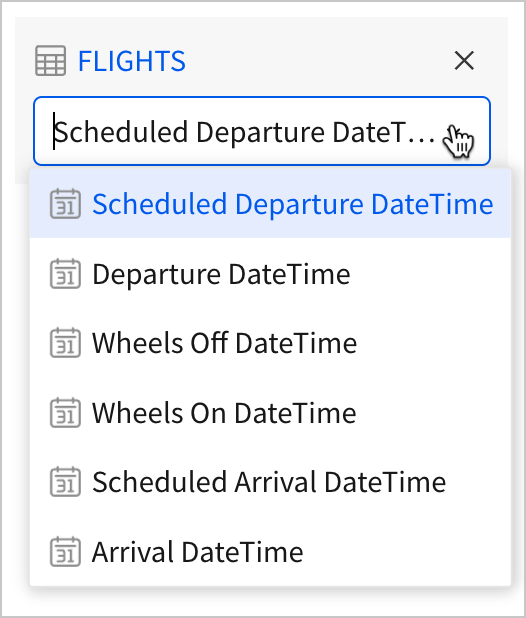
7. Select **Raw Data** > **FLIGHTS** and set the column to **Scheduled Departure DateTime**.
8. In the control, set a date range from `07/01/2015` and `07/31/2015`.
All the elements on the workbook page update to only reflect data from flights that were scheduled to depart in July of 2015.
9. Clear the control.
The elements update to reflect data from the entire year again, with no filter applied.
By configuring a target for our control, and selecting the `Scheduled Departure DateTime` column of our parent **FLIGHTS** table, we made it so that our control directly filtered the parent table of all of our dashboard elements. By targeting the parent table, we can filter the data for all of our dashboard elements from just one control. This is another advantage of building our dashboard elements from one parent table.
### Converting filters to controls
Now, let’s look at an even easier way to configure a control that filters our parent table, by adding a filter to the table directly, and converting it to a page control.
1. Navigate to the **Raw Data** page.
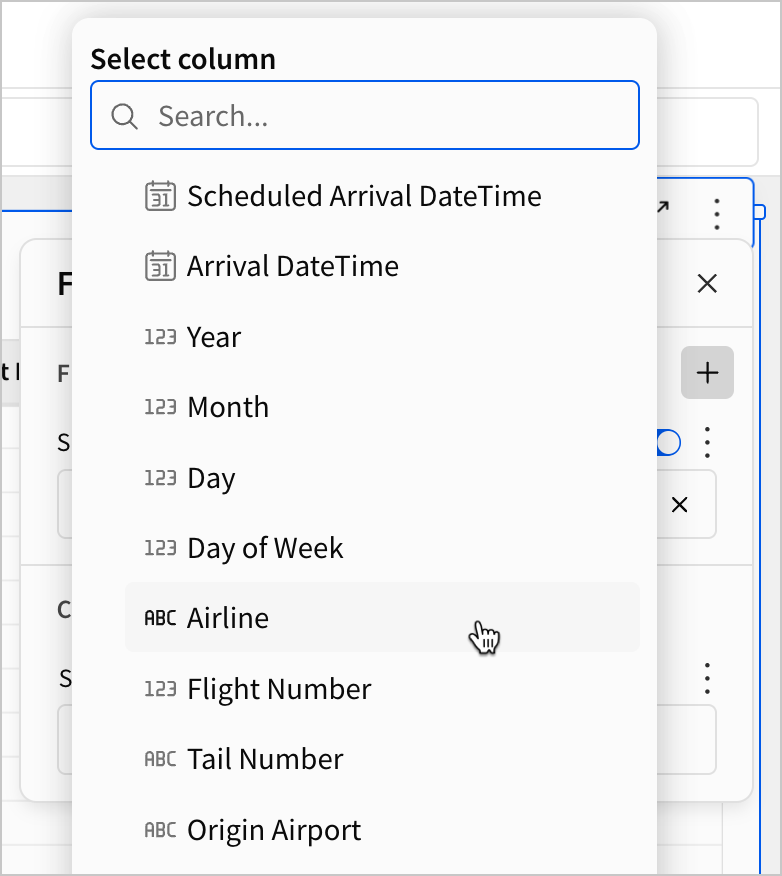
2. Select the **FLIGHTS** table, and add a filter on the `Airline` column.
3. Select
**Add filter target**.

7. Select **Raw Data** > **FLIGHTS** and set the column to **Scheduled Departure DateTime**.

8. In the control, set a date range from `07/01/2015` and `07/31/2015`.
All the elements on the workbook page update to only reflect data from flights that were scheduled to depart in July of 2015.
9. Clear the control.
The elements update to reflect data from the entire year again, with no filter applied.
By configuring a target for our control, and selecting the `Scheduled Departure DateTime` column of our parent **FLIGHTS** table, we made it so that our control directly filtered the parent table of all of our dashboard elements. By targeting the parent table, we can filter the data for all of our dashboard elements from just one control. This is another advantage of building our dashboard elements from one parent table.
### Converting filters to controls
Now, let’s look at an even easier way to configure a control that filters our parent table, by adding a filter to the table directly, and converting it to a page control.
1. Navigate to the **Raw Data** page.
2. Select the **FLIGHTS** table, and add a filter on the `Airline` column.

3. Select  **More** for the filter and click **Convert to page control**.
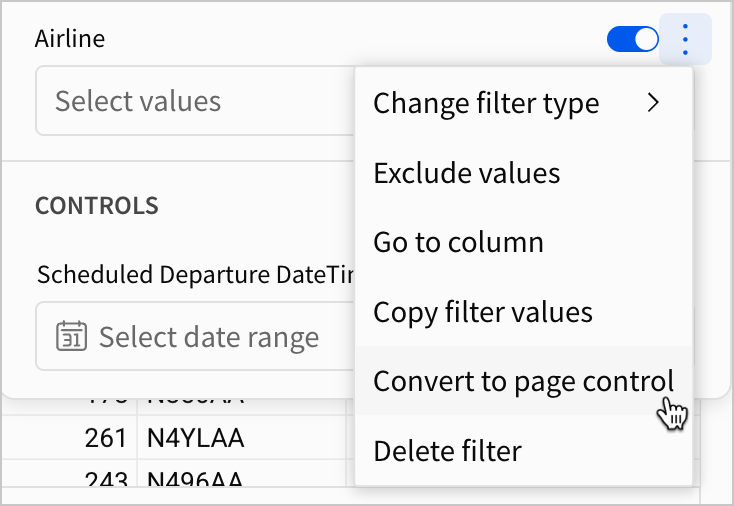
This creates a list values control that targets the `Airline` column of the **FLIGHTS** table.
4. Select the **Airline** control, and click **More** > **Move to** > **Departure Delay vs Arrival Delay** to move it to a user-facing page.
We now have a second control that filters our parent table.
Because we created it as a filter on our parent table first, and then converted it to a page control, we didn’t have to configure the target like we did with the date range control.
#### When should I convert a filter to a page control?
Every filter in Sigma corresponds to a particular type of control element, meaning we can convert any filter to a control. The filter converts to a control that targets the table element where the filter was created. Additionally, a control created this way auto-populates control values based on the table, meaning less manual configuration is required for controls like value lists.
This means that the convert to page control workflow is most useful when you need to quickly create several controls that target one table element. It’s less useful when the controls need to target several elements, as they still need to be manually configured.
To get more comfortable with this workflow for creating a control, let’s do it two more times to create filter controls for our Origin and Destination Airports.
1. Navigate to the **Raw Data** page.
2. Select the **FLIGHTS** table.
3. Add filters for both the `Origin Airport` and `Destination Airport` fields.
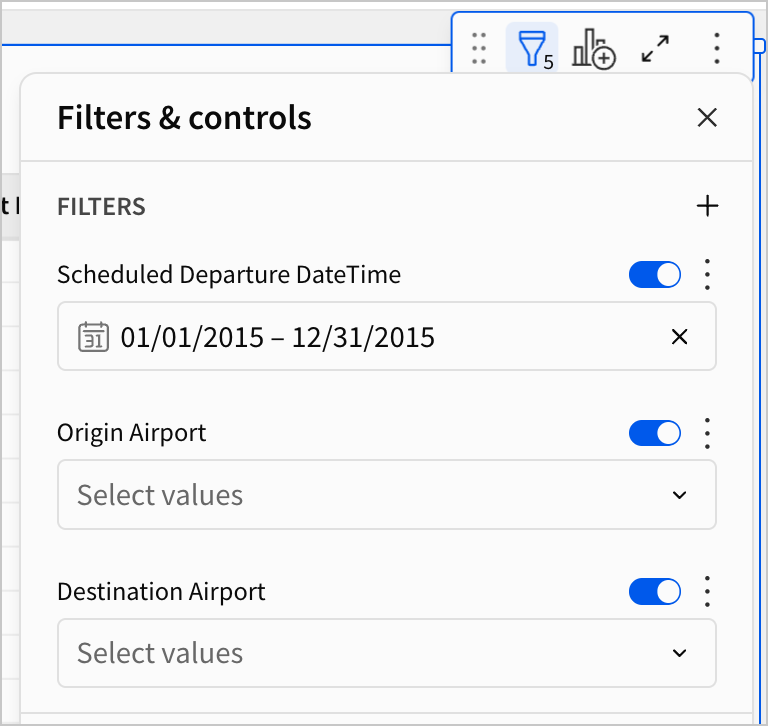
4. For both filters, click **More** and select **Convert to page control**.
Both filters are converted to controls.
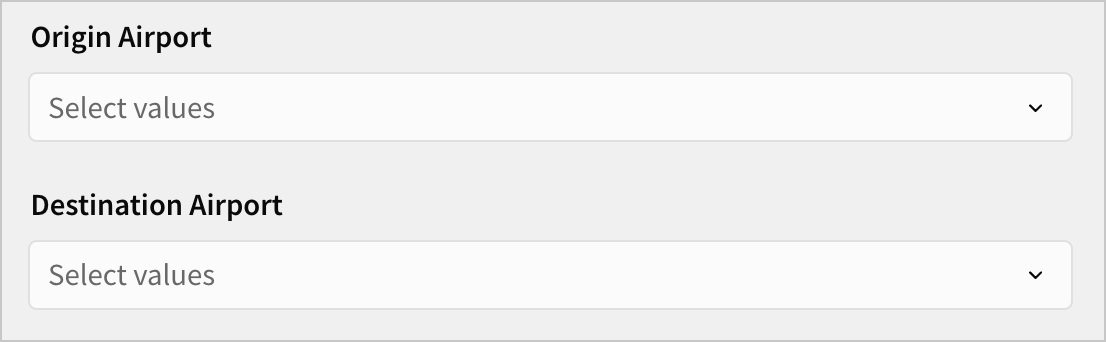
5. For both controls, click **More** > **Move to** > **Departure Delay vs Arrival Delay** to move them to a user-facing page.
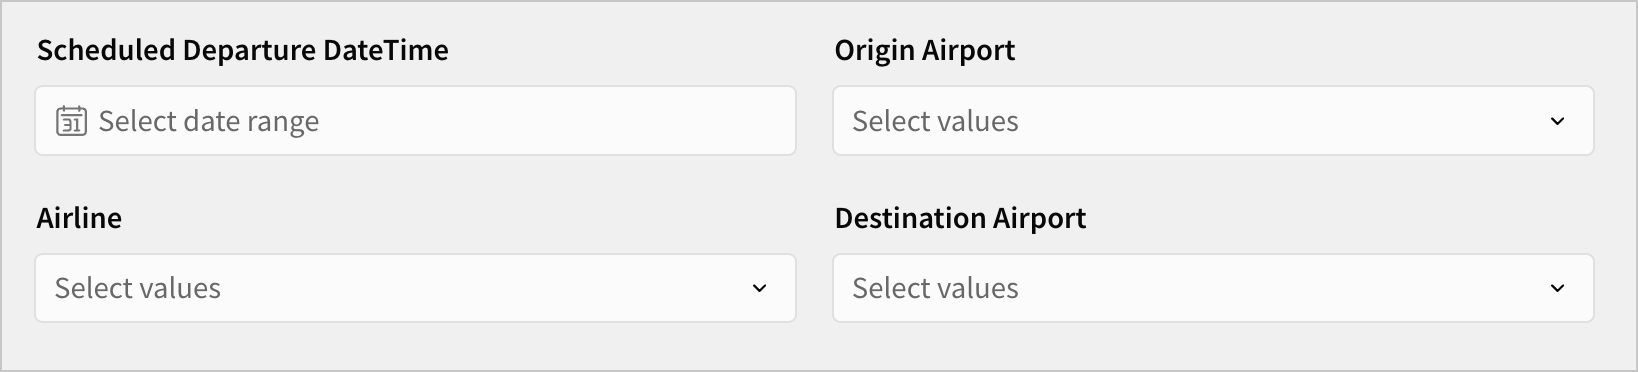
We now have four filter controls on our dashboard page that target our parent element. When we share our final dashboard, users can make selections on these controls to filter the visualizations by Date, Airline, and Airport, while the raw data remains hidden. In this way, Sigma control elements allow you to determine the interaction a user has with your dashboard. You can choose more than just what data should appear in what charts, you can also choose how users interact with that data.
To finish this section, let’s quickly configure some settings for these four controls.
1. Select the **Scheduled Departure DateTime** control. Double click the label and rename it **Scheduled Departure Date**.
2. In the editor panel, update the **Control ID** to `control-departure-date`.
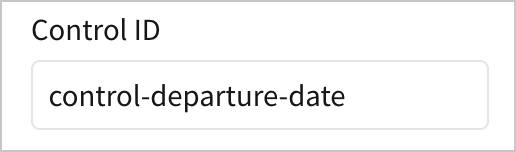
Control IDs are customizable unique identifiers for control elements. Later in this course, we’ll use control IDs to reference controls and their values in workbook actions. For now, we just need to write unique, standardized, descriptive ID values for each control.
3. Select the **Airline** control.
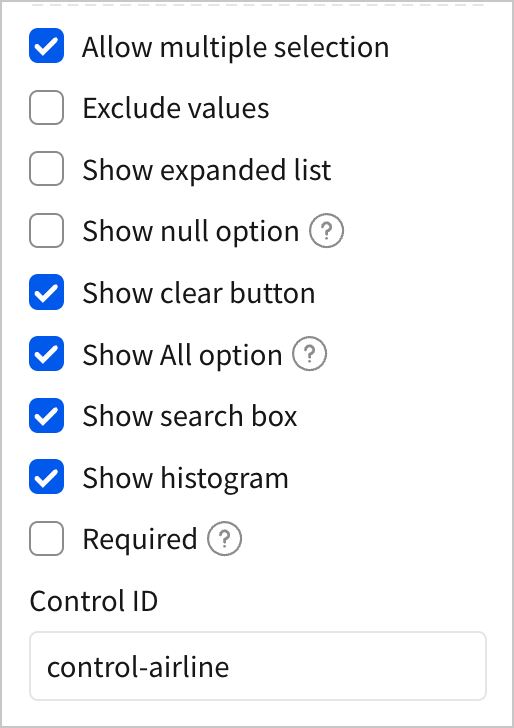
4. In the editor panel, deselect the checkbox for **Show null option**. This removes the null option from the list of values the user can select from.
5. Set the **Control ID** value to `control-airline`.
6. Select the **Origin Airport** control.
7. In the editor panel, deselect the checkbox for **Show null option**. Set the **Control ID** value to `control-origin-airport`.
8. Select the **Destination Airport** control.
9. In the editor panel, deselect the checkbox for **Show null option**. Set the **Control ID** value to `control-destination-airport`.
10. Click **Publish** save your work to the published version.
## Controls, lineage, and user experience
In the last section, we leveraged our workbook lineage, as well as the convert to page control feature to quickly make controls out of several filters that targeted our parent table. Now, let’s create another filter control that targets a different point in our workbook lineage.
1. Navigate to the Raw Data page, and select the **FLIGHTS - Delay Breakdown** table.
Recall that this is a child table of our **FLIGHTS** table, but it's also the parent table for the donut chart titled `Average Arrival Delay by Delay Type`. All the control elements we made in the previous section impact this table as well, because they target the data source (**FLIGHTS**) that this table (**FLIGHTS - Delay Breakdown**) is based on.
Let’s make a control that targets just the **FLIGHTS - Delay Breakdown** table and its child elements, without impacting the parent **FLIGHTS** table.
Our manager has asked us to add a control that lets users filter flights in the delay breakdown based on their total arrival delay time. For example, this control would allow a user to filter for flights that were delayed by an hour or more, or between two hours and three hours, so that they can observe how the different delay root causes vary with total delay time.
2. Select
**More** for the filter and click **Convert to page control**.

This creates a list values control that targets the `Airline` column of the **FLIGHTS** table.
4. Select the **Airline** control, and click **More** > **Move to** > **Departure Delay vs Arrival Delay** to move it to a user-facing page.
We now have a second control that filters our parent table.
Because we created it as a filter on our parent table first, and then converted it to a page control, we didn’t have to configure the target like we did with the date range control.
#### When should I convert a filter to a page control?
Every filter in Sigma corresponds to a particular type of control element, meaning we can convert any filter to a control. The filter converts to a control that targets the table element where the filter was created. Additionally, a control created this way auto-populates control values based on the table, meaning less manual configuration is required for controls like value lists.
This means that the convert to page control workflow is most useful when you need to quickly create several controls that target one table element. It’s less useful when the controls need to target several elements, as they still need to be manually configured.
To get more comfortable with this workflow for creating a control, let’s do it two more times to create filter controls for our Origin and Destination Airports.
1. Navigate to the **Raw Data** page.
2. Select the **FLIGHTS** table.
3. Add filters for both the `Origin Airport` and `Destination Airport` fields.

4. For both filters, click **More** and select **Convert to page control**.
Both filters are converted to controls.

5. For both controls, click **More** > **Move to** > **Departure Delay vs Arrival Delay** to move them to a user-facing page.

We now have four filter controls on our dashboard page that target our parent element. When we share our final dashboard, users can make selections on these controls to filter the visualizations by Date, Airline, and Airport, while the raw data remains hidden. In this way, Sigma control elements allow you to determine the interaction a user has with your dashboard. You can choose more than just what data should appear in what charts, you can also choose how users interact with that data.
To finish this section, let’s quickly configure some settings for these four controls.
1. Select the **Scheduled Departure DateTime** control. Double click the label and rename it **Scheduled Departure Date**.
2. In the editor panel, update the **Control ID** to `control-departure-date`.

Control IDs are customizable unique identifiers for control elements. Later in this course, we’ll use control IDs to reference controls and their values in workbook actions. For now, we just need to write unique, standardized, descriptive ID values for each control.
3. Select the **Airline** control.
4. In the editor panel, deselect the checkbox for **Show null option**. This removes the null option from the list of values the user can select from.
5. Set the **Control ID** value to `control-airline`.

6. Select the **Origin Airport** control.
7. In the editor panel, deselect the checkbox for **Show null option**. Set the **Control ID** value to `control-origin-airport`.
8. Select the **Destination Airport** control.
9. In the editor panel, deselect the checkbox for **Show null option**. Set the **Control ID** value to `control-destination-airport`.
10. Click **Publish** save your work to the published version.
## Controls, lineage, and user experience
In the last section, we leveraged our workbook lineage, as well as the convert to page control feature to quickly make controls out of several filters that targeted our parent table. Now, let’s create another filter control that targets a different point in our workbook lineage.
1. Navigate to the Raw Data page, and select the **FLIGHTS - Delay Breakdown** table.
Recall that this is a child table of our **FLIGHTS** table, but it's also the parent table for the donut chart titled `Average Arrival Delay by Delay Type`. All the control elements we made in the previous section impact this table as well, because they target the data source (**FLIGHTS**) that this table (**FLIGHTS - Delay Breakdown**) is based on.
Let’s make a control that targets just the **FLIGHTS - Delay Breakdown** table and its child elements, without impacting the parent **FLIGHTS** table.
Our manager has asked us to add a control that lets users filter flights in the delay breakdown based on their total arrival delay time. For example, this control would allow a user to filter for flights that were delayed by an hour or more, or between two hours and three hours, so that they can observe how the different delay root causes vary with total delay time.
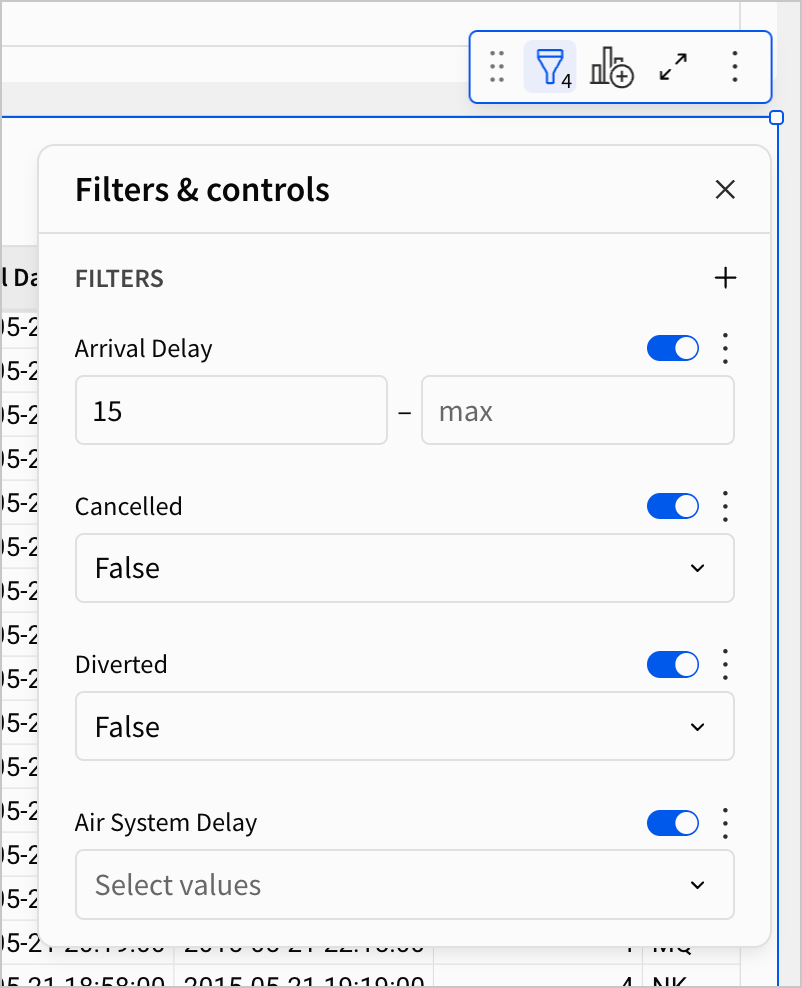
2. Select  **Filters & controls** for the **FLIGHTS - Delay Breakdown** table.
You might see four filters like below:
3. Click **Add filter…** and select **Arrival Delay** as the column.
Notice that nothing changed. Because we already have a filter on the `Arrival Delay` column, Sigma prevents us from adding a second. This has advantages and disadvantages:
* **Advantage** - This protects users from having an unintuitive experience with our dashboard. Having two filters on the same column can be unclear for end users, especially if one of the filters is on a table that they don’t have access to.
* **Disadvantage** - This removes some agency from us as the dashboard creator. Perhaps we want to offer users a control to filter this field, but we also want some assurance that the table will always be filtered properly, which seems to require two filters.
There is a way to circumvent this limitation. But before we do that, it’s worth pausing to consider why we want to. In this case, it’s because we want to retain a filter on our parent table while also offering a control on that same column to end users. They should never be able to view a flight with less than 15 minutes in `Arrival Delay`. Beyond that, however, they can filter however they want.
4. Navigate to the **Arrival Delay by Delay Type** page.
5. In the **Add element bar**, select **Controls** > **Range slider**.
6. Rename the control `Total Arrival Delay`.
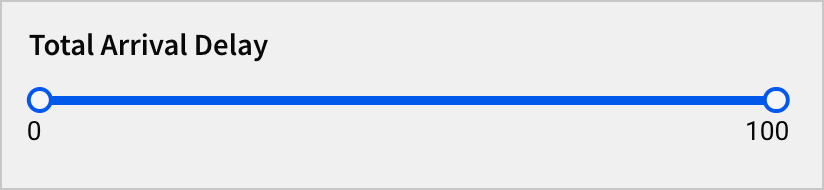
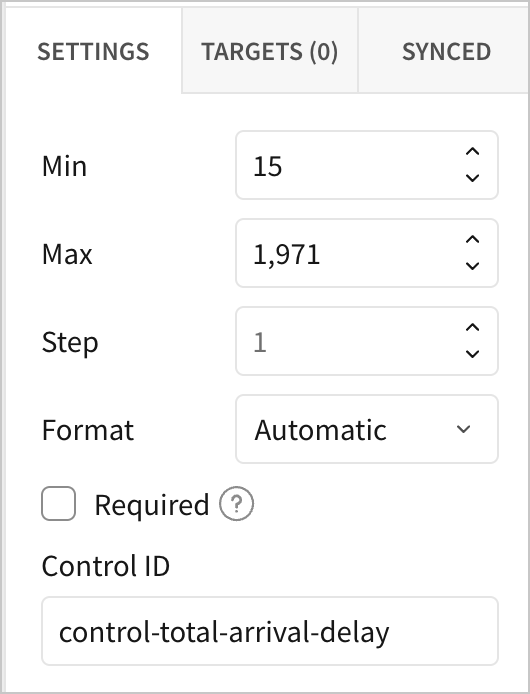
7. In the editor panel, under **Settings**, set a **Min** value of `15`, a **Max** value of `1971`, and a **Control ID** of `control-total-arrival-delay`.
8. Under **Targets (0)**, select **Add filter target**. Select **FLIGHTS - Delay Breakdown**, and then select **Arrival Delay**.
We now have a control that functions as a second filter on the `Arrival Delay` column. No matter our settings in the control, that table is still filtered to only show flights with at least 15 minutes of arrival delay. Note that we set a maximum value of 1971 because that is the maximum number of minutes a flight was delayed by in the dataset.
Make some selections in the range control, and observe any trends in the **Average Arrival Delay by Delay Type** donut chart.
9. Click **Publish** save your work to the published version.
## Intro to actions
To conclude this lesson, let’s make one more control that relies on an action workflow.
In Sigma, actions are events, or sequences of events, that you can configure to happen based on a trigger. As a simple example, you might add a button to your workbook, and configure an action to take place when a user clicks the button. Actions can also be configured with conditions, meaning that even if the trigger event happens, the action sequence only kicks off if a set of criteria are met.
Our goal is to create a segmented control that allows users to include or exclude cancelled flights. To do this, we need to configure a control on the `Cancelled` column, which can be either `True` or `False`.
1. Navigate to the **Departure Delay vs Arrival Delay** page.
2. In the **Add element bar**, select **Controls** > **Segmented**.
A segmented control appears on the page.
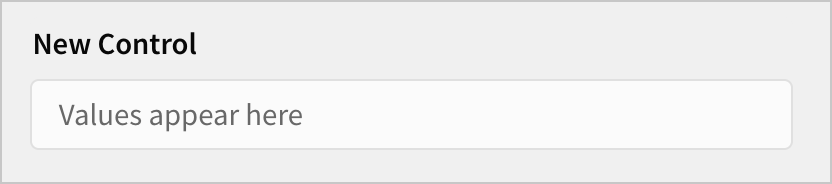
3. Rename it `Include Cancellations?`
4. In the editor panel, under **Settings**, set the **Value** **source** to be the **FLIGHTS** table in our **Raw Data** page. For the column, select **Cancelled**.
The segmented control updates with values `True` and `False`.
Let’s pause for a moment: is this actually what we want to do with this control? Do we want users to toggle between `True` and `False` values for cancellations? If that were the case, we could configure the control to target the `Cancelled` column. Then, when users select `True`, they’d see data for flights that were cancelled, and when they select `False` they’d see information about flights that were not cancelled.
But this isn’t the same as including or excluding cancellations. What we actually want is for users to be able to select between one of two possible lists of values:
* If they want to include cancellations, we need to show flights that have a `Cancelled` value of either `True` or `False`.
* If they want to exclude cancellations, we need to show flights that have a `Cancelled` value of `False` only.
In other words, we don't want to toggle between `True` and `False`, we want to always see flights that have a `Cancelled` value of `False`, and only sometimes see flights that have a `Cancelled` value of `True`. Let’s implement this using actions.
5. Select the **Include Cancellations?** control.
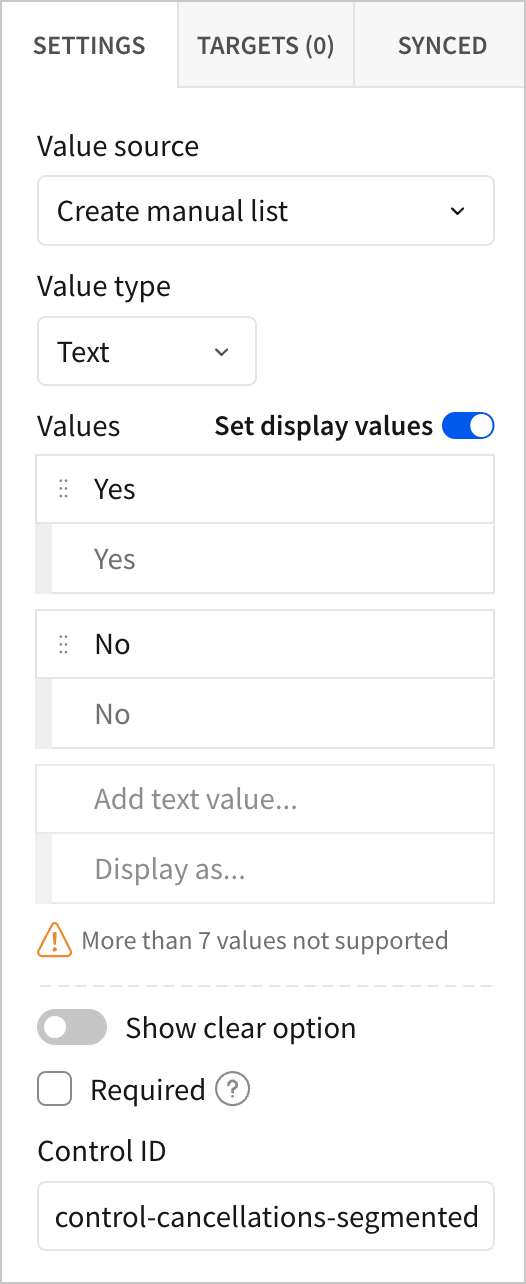
6. Change the **Value source** to **Create manual list**, and change the **Value type** to **Text**.
7. Enter the values `Yes` and `No`.
8. Change the **Control ID** to `control-cancellations-segmented`.
9. Navigate to the **Raw Data** page and add a filter on the `Cancelled` column, then convert it to a page control.
A list values control labelled **Cancelled** appears.
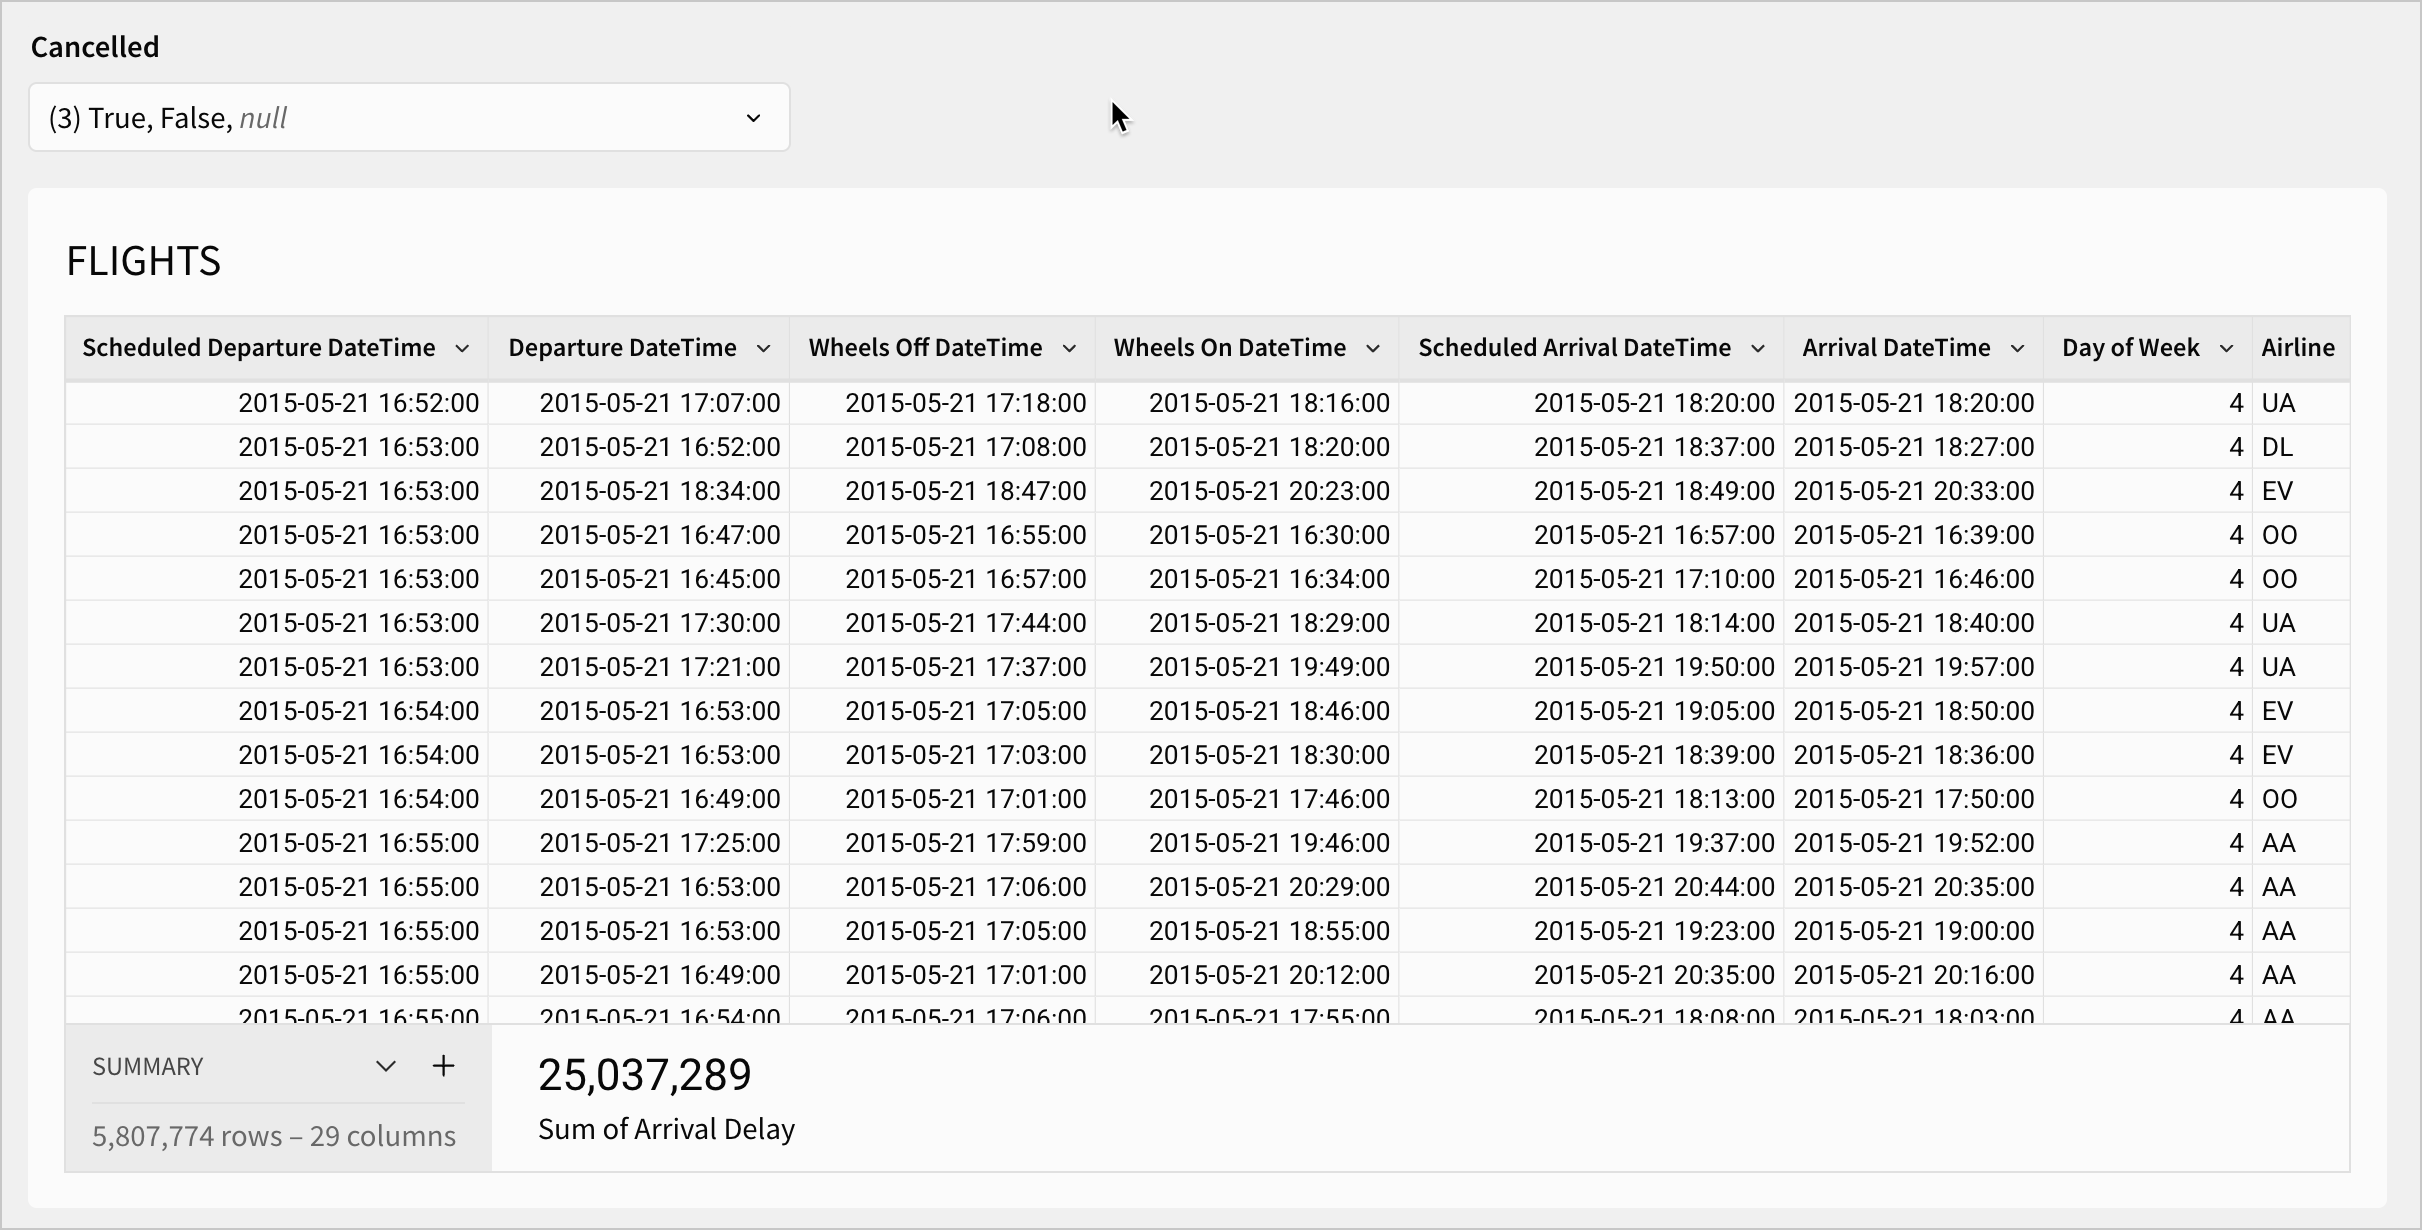
10. Select the **Cancelled** control and change the **Control ID** to `control-cancellations-list-values`.
11. Navigate back to the **Departure Delay vs Arrival Delay** page.
12. Select the **Include Cancellations?** segmented control.
13. In the editor panel, select **Actions**.
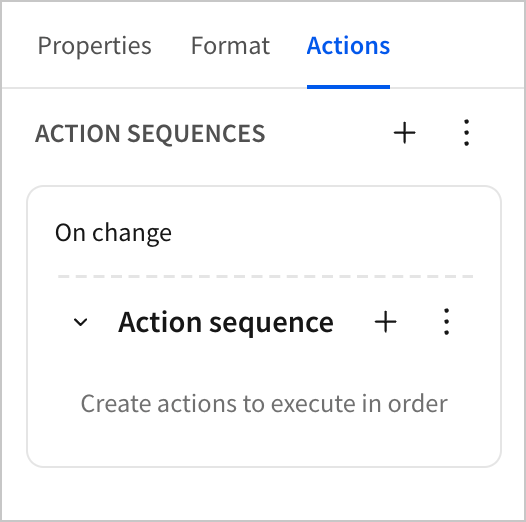
In the actions panel, we can configure one or more action sequences. Each action sequence contains a condition (optional), trigger, and action. By default, there is one action sequence with no actions configured.
In the next steps, we’ll configure the following action sequences:
* Action sequence one - include cancellations
* Condition: When **Include Cancellations?** = `Yes`
* Action: Set the `control-cancellations-list-values` control - **Cancelled** - to `True`, `False`
* Action sequence two - exclude cancellations
* Condition: When **Include Cancellations?** = `No`
* Action: Set the `control-cancellations-list-values` control - **Cancelled** - to `False`
These actions sequences target the `control-cancellations-list-values` control, which we created in step 9. Whenever we update the `control-cancellations-segmented` control, the action sequence updates the `control-cancellations-list-values` control, which in turn filters the `Cancelled` column on the `FLIGHTS` table.
14. In the first **Action sequence**, click **More** > **Add condition**.
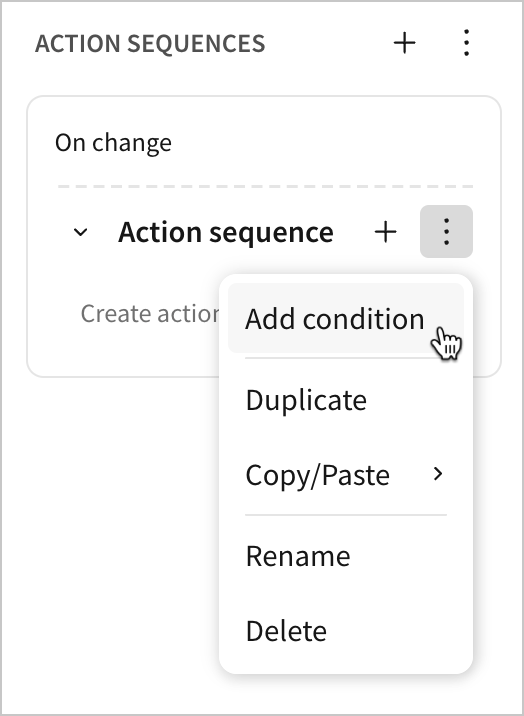
15. Set the **Condition** as **Control value is equal to** > **Yes**.
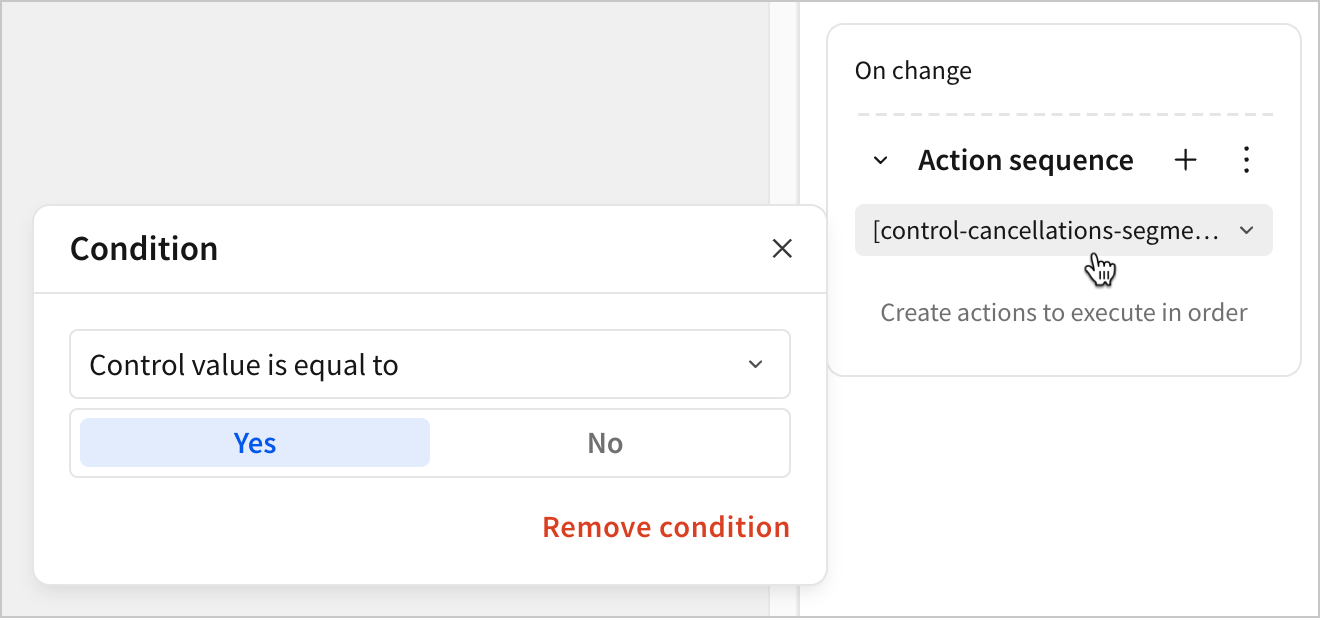
16. Back in the action sequence, click **Add action…**
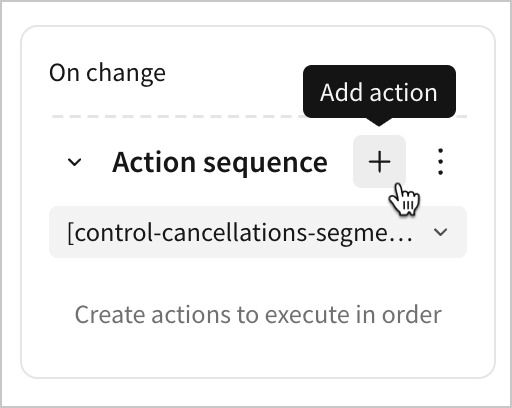
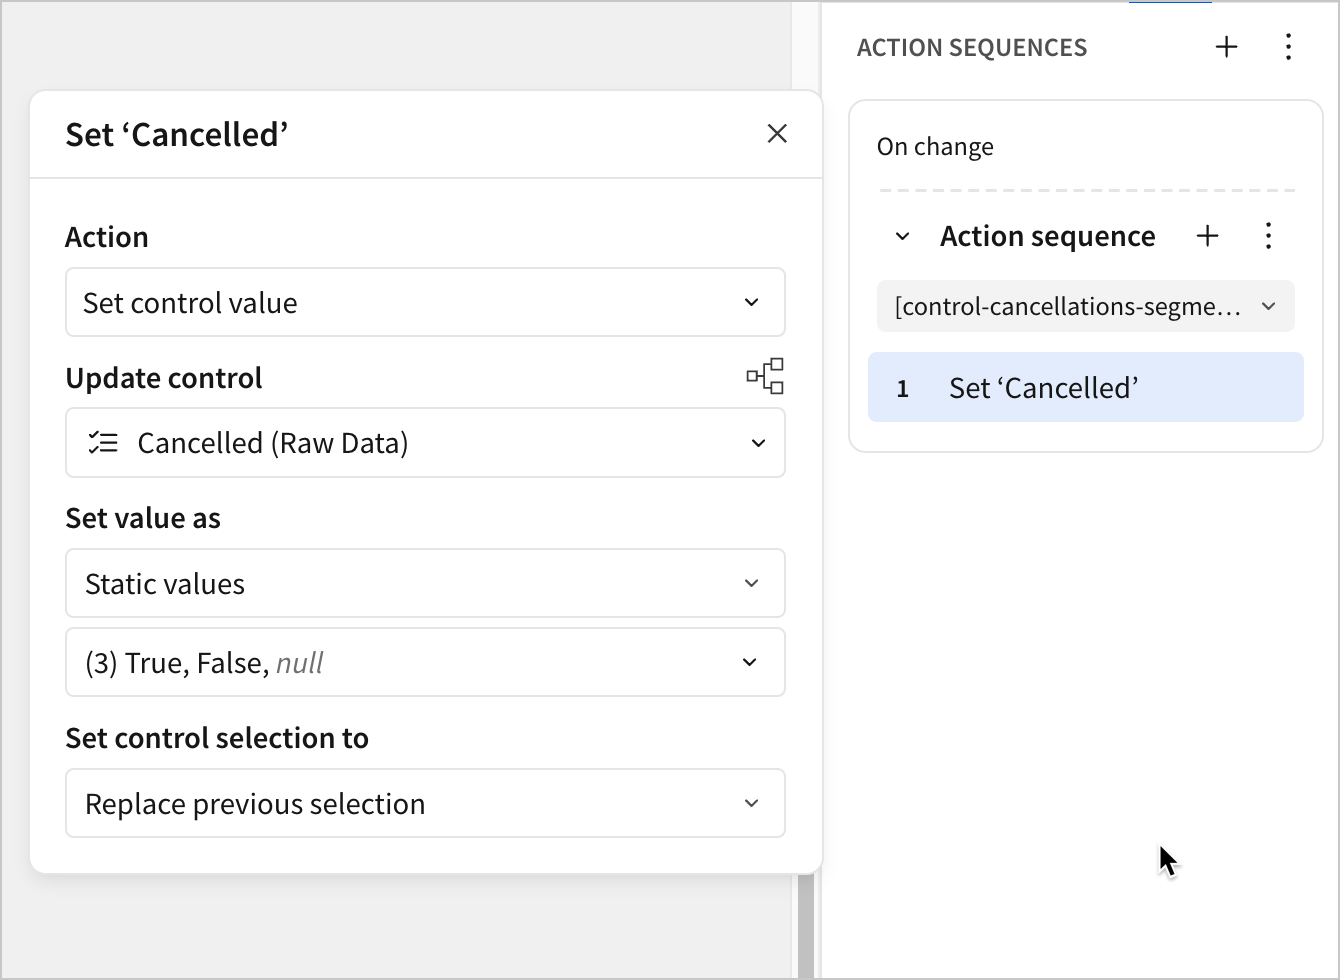
17. Configure a **Set control value** action to update the **Cancelled (Raw Data)** control like below:
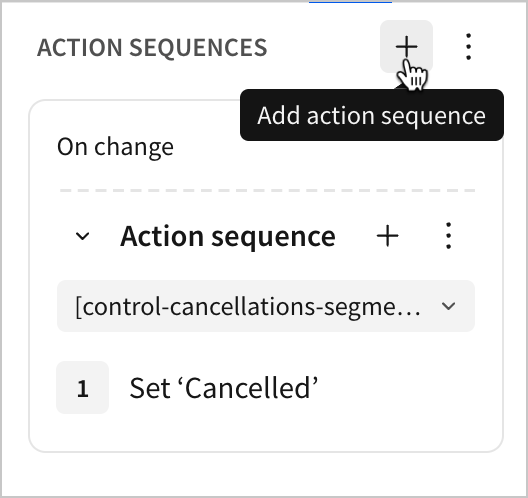
18. Click **Add action sequence** to add another action sequence.
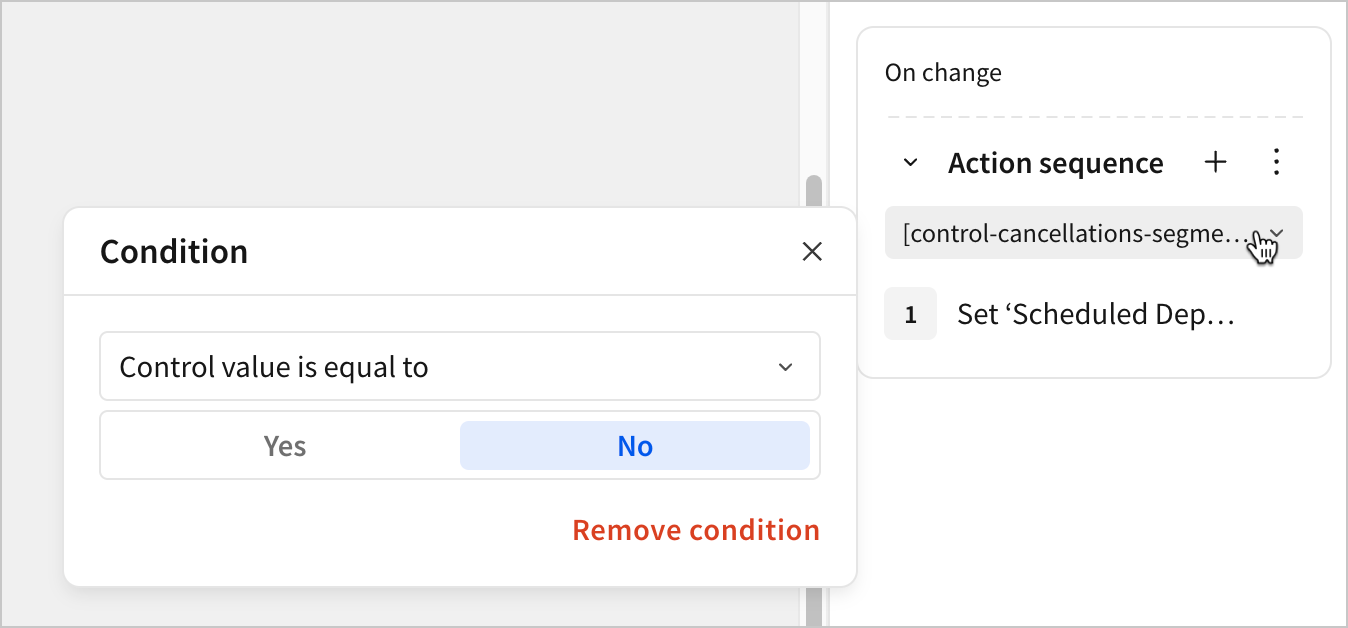
19. Set the **Condition** for the second action sequence as **Control value is equal to** > **No**.
20. Configure a **Set control value** action to update the **Cancelled (Raw Data)** control like below:
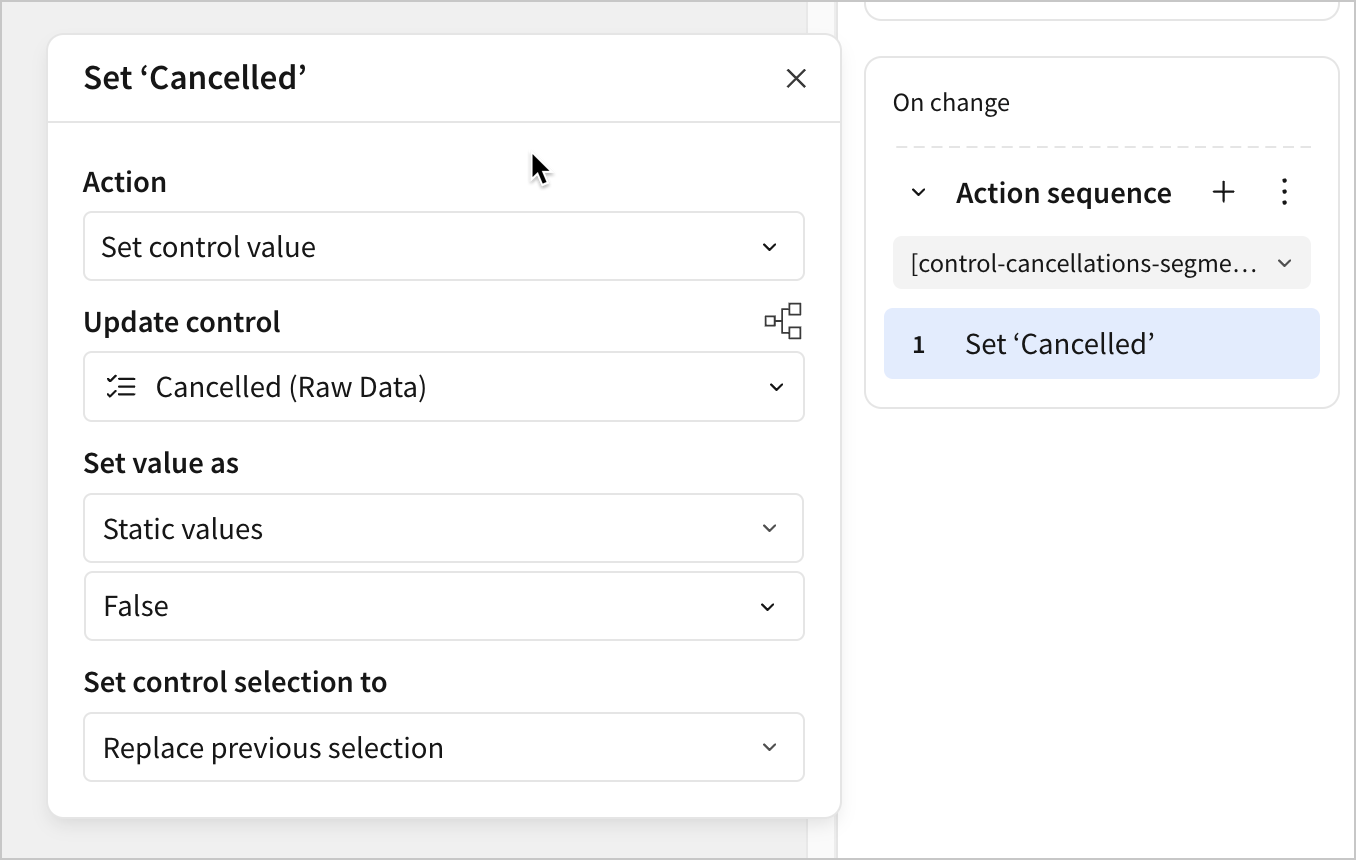
Test the action by changing the selection of the control. The table contents update to reflect the changes in the parent data table.
#### Controls can control other controls?
You may have noticed that the segmented control we’re providing to the user has no targets, but can still update the table thanks to actions that change another control. This is one option for having one control set another control, but you can also use [synced controls](/docs/synced-controls).
Synced controls allow you to create two identical controls, and automatically apply any updates made to one control to the other. This can be used to manage multiple controls on the same data source across several pages.
In this lesson, however, we can't use a synced control, since the two controls we want to connect are of different types and have different contents. In instances like this, using an action sequence is more appropriate.
21. Click **Publish** save your work to the published version.
## Conclusion
At the end of lesson five, we’ve built interactivity into our dashboard so that users can explore and analyze the data independently. To do that, we learned about the following:
* Controls
* Converting filters to controls
* Placing filters on parent elements
* Actions
* Conditional actions
**Filters & controls** for the **FLIGHTS - Delay Breakdown** table.
You might see four filters like below:

3. Click **Add filter…** and select **Arrival Delay** as the column.
Notice that nothing changed. Because we already have a filter on the `Arrival Delay` column, Sigma prevents us from adding a second. This has advantages and disadvantages:
* **Advantage** - This protects users from having an unintuitive experience with our dashboard. Having two filters on the same column can be unclear for end users, especially if one of the filters is on a table that they don’t have access to.
* **Disadvantage** - This removes some agency from us as the dashboard creator. Perhaps we want to offer users a control to filter this field, but we also want some assurance that the table will always be filtered properly, which seems to require two filters.
There is a way to circumvent this limitation. But before we do that, it’s worth pausing to consider why we want to. In this case, it’s because we want to retain a filter on our parent table while also offering a control on that same column to end users. They should never be able to view a flight with less than 15 minutes in `Arrival Delay`. Beyond that, however, they can filter however they want.
4. Navigate to the **Arrival Delay by Delay Type** page.
5. In the **Add element bar**, select **Controls** > **Range slider**.
6. Rename the control `Total Arrival Delay`.

7. In the editor panel, under **Settings**, set a **Min** value of `15`, a **Max** value of `1971`, and a **Control ID** of `control-total-arrival-delay`.

8. Under **Targets (0)**, select **Add filter target**. Select **FLIGHTS - Delay Breakdown**, and then select **Arrival Delay**.
We now have a control that functions as a second filter on the `Arrival Delay` column. No matter our settings in the control, that table is still filtered to only show flights with at least 15 minutes of arrival delay. Note that we set a maximum value of 1971 because that is the maximum number of minutes a flight was delayed by in the dataset.
Make some selections in the range control, and observe any trends in the **Average Arrival Delay by Delay Type** donut chart.
9. Click **Publish** save your work to the published version.
## Intro to actions
To conclude this lesson, let’s make one more control that relies on an action workflow.
In Sigma, actions are events, or sequences of events, that you can configure to happen based on a trigger. As a simple example, you might add a button to your workbook, and configure an action to take place when a user clicks the button. Actions can also be configured with conditions, meaning that even if the trigger event happens, the action sequence only kicks off if a set of criteria are met.
Our goal is to create a segmented control that allows users to include or exclude cancelled flights. To do this, we need to configure a control on the `Cancelled` column, which can be either `True` or `False`.
1. Navigate to the **Departure Delay vs Arrival Delay** page.
2. In the **Add element bar**, select **Controls** > **Segmented**.
A segmented control appears on the page.

3. Rename it `Include Cancellations?`
4. In the editor panel, under **Settings**, set the **Value** **source** to be the **FLIGHTS** table in our **Raw Data** page. For the column, select **Cancelled**.
The segmented control updates with values `True` and `False`.
Let’s pause for a moment: is this actually what we want to do with this control? Do we want users to toggle between `True` and `False` values for cancellations? If that were the case, we could configure the control to target the `Cancelled` column. Then, when users select `True`, they’d see data for flights that were cancelled, and when they select `False` they’d see information about flights that were not cancelled.
But this isn’t the same as including or excluding cancellations. What we actually want is for users to be able to select between one of two possible lists of values:
* If they want to include cancellations, we need to show flights that have a `Cancelled` value of either `True` or `False`.
* If they want to exclude cancellations, we need to show flights that have a `Cancelled` value of `False` only.
In other words, we don't want to toggle between `True` and `False`, we want to always see flights that have a `Cancelled` value of `False`, and only sometimes see flights that have a `Cancelled` value of `True`. Let’s implement this using actions.
5. Select the **Include Cancellations?** control.
6. Change the **Value source** to **Create manual list**, and change the **Value type** to **Text**.
7. Enter the values `Yes` and `No`.
8. Change the **Control ID** to `control-cancellations-segmented`.

9. Navigate to the **Raw Data** page and add a filter on the `Cancelled` column, then convert it to a page control.
A list values control labelled **Cancelled** appears.

10. Select the **Cancelled** control and change the **Control ID** to `control-cancellations-list-values`.
11. Navigate back to the **Departure Delay vs Arrival Delay** page.
12. Select the **Include Cancellations?** segmented control.
13. In the editor panel, select **Actions**.

In the actions panel, we can configure one or more action sequences. Each action sequence contains a condition (optional), trigger, and action. By default, there is one action sequence with no actions configured.
In the next steps, we’ll configure the following action sequences:
* Action sequence one - include cancellations
* Condition: When **Include Cancellations?** = `Yes`
* Action: Set the `control-cancellations-list-values` control - **Cancelled** - to `True`, `False`
* Action sequence two - exclude cancellations
* Condition: When **Include Cancellations?** = `No`
* Action: Set the `control-cancellations-list-values` control - **Cancelled** - to `False`
These actions sequences target the `control-cancellations-list-values` control, which we created in step 9. Whenever we update the `control-cancellations-segmented` control, the action sequence updates the `control-cancellations-list-values` control, which in turn filters the `Cancelled` column on the `FLIGHTS` table.
14. In the first **Action sequence**, click **More** > **Add condition**.

15. Set the **Condition** as **Control value is equal to** > **Yes**.

16. Back in the action sequence, click **Add action…**

17. Configure a **Set control value** action to update the **Cancelled (Raw Data)** control like below:

18. Click **Add action sequence** to add another action sequence.

19. Set the **Condition** for the second action sequence as **Control value is equal to** > **No**.

20. Configure a **Set control value** action to update the **Cancelled (Raw Data)** control like below:

Test the action by changing the selection of the control. The table contents update to reflect the changes in the parent data table.
#### Controls can control other controls?
You may have noticed that the segmented control we’re providing to the user has no targets, but can still update the table thanks to actions that change another control. This is one option for having one control set another control, but you can also use [synced controls](/docs/synced-controls).
Synced controls allow you to create two identical controls, and automatically apply any updates made to one control to the other. This can be used to manage multiple controls on the same data source across several pages.
In this lesson, however, we can't use a synced control, since the two controls we want to connect are of different types and have different contents. In instances like this, using an action sequence is more appropriate.
21. Click **Publish** save your work to the published version.
## Conclusion
At the end of lesson five, we’ve built interactivity into our dashboard so that users can explore and analyze the data independently. To do that, we learned about the following:
* Controls
* Converting filters to controls
* Placing filters on parent elements
* Actions
* Conditional actions