> For clean Markdown of any page, append .md to the page URL.
> For a complete documentation index, see https://help.sigmacomputing.com/llms.txt.
> For AI client integration (Claude Code, Cursor, etc.), connect to the MCP server at https://help.sigmacomputing.com/_mcp/server.
# Lesson eight: Input tables and combining data
> Sigma Fundamentals for Builders: lesson eight covers input tables and combining data with hands-on workbook exercises.
Welcome to lesson eight: Input tables and combining data.
In the last lesson, we styled our dashboard using layout elements, workbook settings, and themes. At this point, our dashboard is in a reasonably polished state. We might want to have a peer review our work, or ask for feedback from stakeholders, but it has all the basic functionality we’d expect from a BI dashboard:
* A connection to live data
* Multiple charts
* Filter options
* Distinct pages for sub-topics
In this final lesson, we’ll go beyond this typical functionality of a BI dashboard and explore two use cases for input tables. First, we’ll enrich our dataset by uploading a CSV directly to Sigma. Then, we’ll create an interface where users can enter new flights into the dataset.
## Upload data to an input table
Input tables are Sigma elements we can use to enter or upload data.
Remember that Sigma never stores your data in Sigma, including data entered in input tables. Sigma stores input table data in a specific write-back schema in your data platform. Learn more about the details in [the documentation](/docs/intro-to-input-tables).
To see input tables in action, let’s upload a CSV of airport data to our workbook, and join it to our **FLIGHTS** data. Using that joined dataset, we can then create a map.
1. To download a CSV of airport coordinates, click on the [link provided here](https://sigma-docs-screenshots.s3.us-west-2.amazonaws.com/tutorials/docs-fundamentals/L8/airport-destinations-final.csv).
2. Save it somewhere you can easily locate.
3. Return to the **Flight Delay Times** workbook and enter **Edit mode**.
4. Add a new page, and name it **Airport Data**.
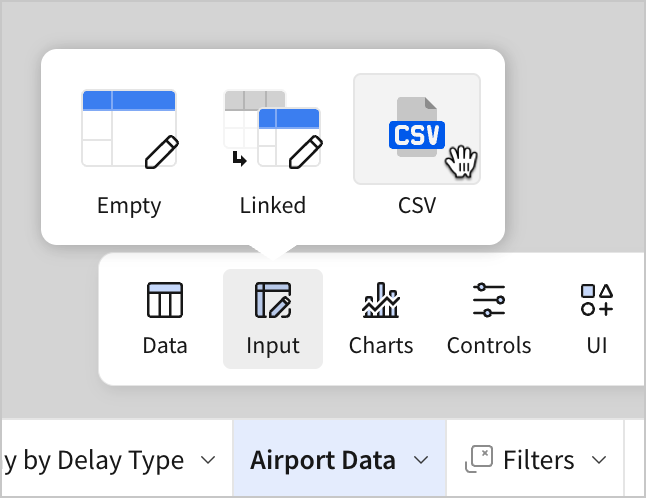
5. In the **Add element bar**, select **Input** > **CSV**.
6. In the prompt to upload a CSV-formatted file, click **Browse**.
7. Select the airport-destinations-final CSV-formatted file you downloaded previously and then click **Open**.
8. This opens a preview of the CSV file in table format, and provides some options to change settings for the upload.
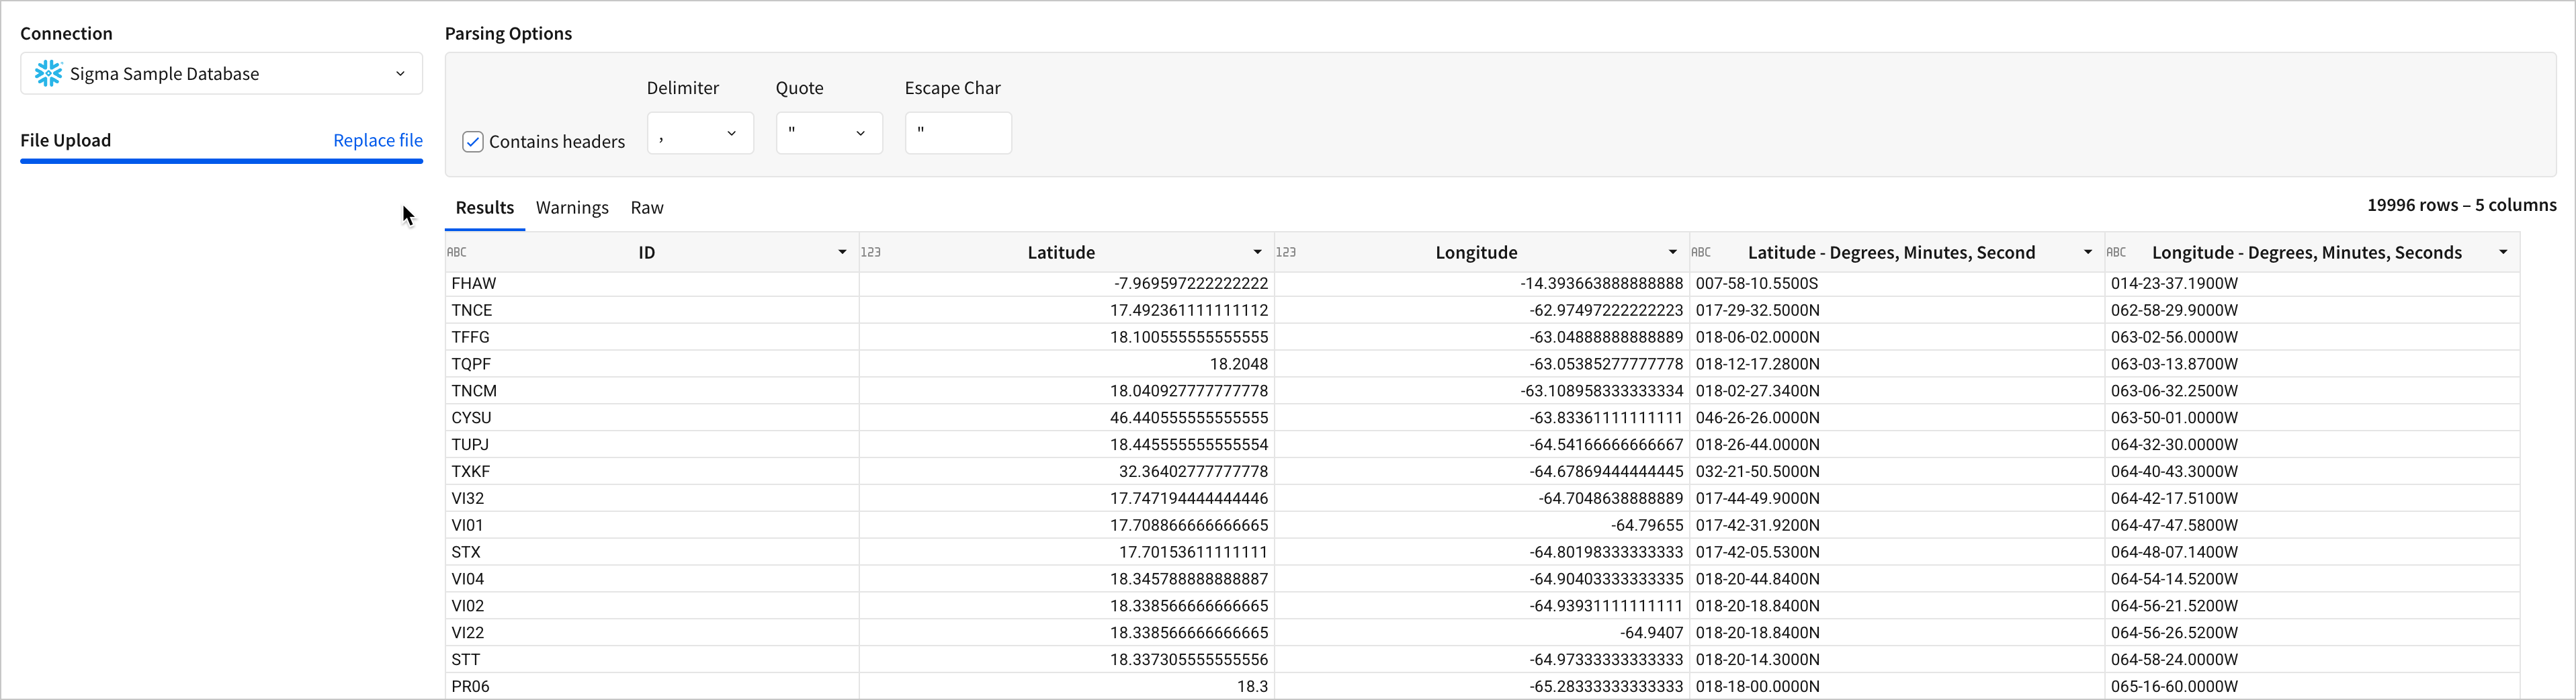
The provided file works with the default options, so there’s no need to make any changes. In the future, this is where you can choose a connection with a write-back schema, and set parsing options for CSV-formatted data like the delimiter value and whether it has a header or not.
9. Click **Save**.
10. A new input table titled **New Input Table** is created. Rename it to **Airport Locations**.
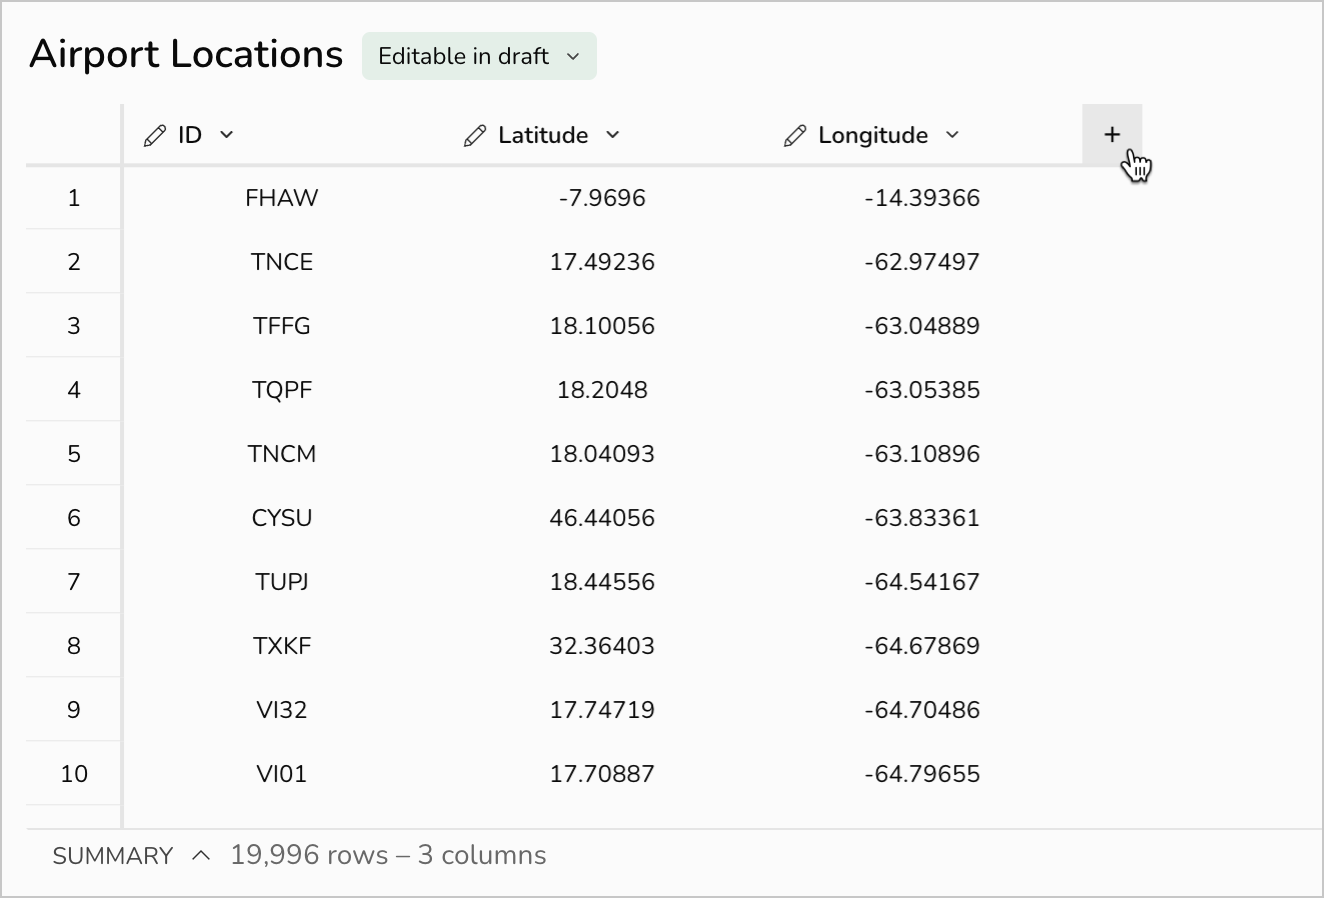
This input table element closely resembles our existing table elements. Just like other tables, we can add calculated columns, summaries, filters, sorts, and more. Unlike other tables, though, we can add input columns that allow us to edit individual cells.
1. Select  in the column header to add a new column to the input table, and select **Text**.
2. Double click a cell, and enter some text.
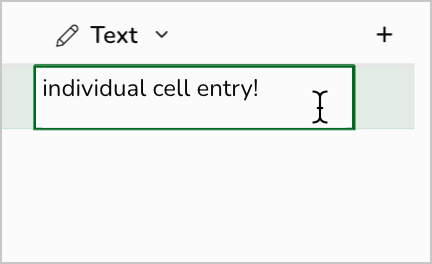
Unlike other table elements, we can make cell-level entries in input tables. Just like the CSV data we uploaded when creating this input table, this data is stored in the write-back schema in your data platform. This new column is just a demonstration, and has no practical application for our use case, so we can delete it for now.
3. Right-click the header of the **Text** column, and select **Delete column**.
Now, let’s consider how we could use this newly entered data about airports to enrich our analysis of delay times. Our input table has three columns:
* **ID** - Lists the ID of the airport.
* **Latitude** - Provides a coordinate value for how far north or south the airport is.
* **Longitude** - Provides the coordinate for how far east or west the airport is.
If we combine this information with our existing information on flights, we can visualize departure delays by airport location. For example, we might use the airport ID to join the geographical coordinates as two additional columns in the flights table.
After we have that joined table, we can create detailed visualizations with geographical location. As an imagined end-state, we could build a map that shows larger, redder dots for airports with a higher average departure delay, like this:
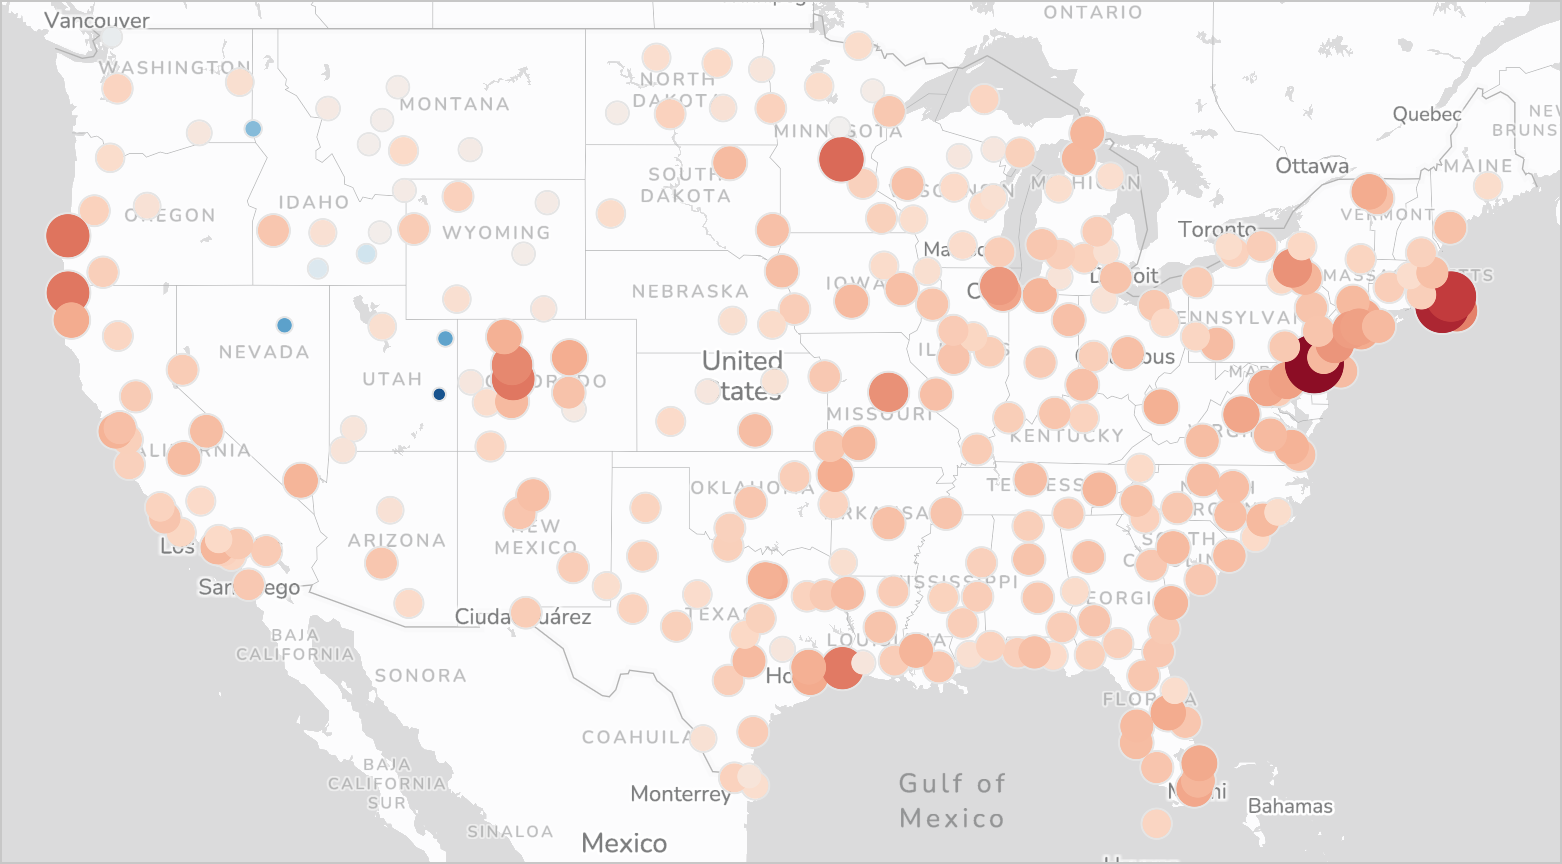
In the rest of this section we’ll walk through how to join tables to create this chart.
1. Navigate to the **Airport Data** page.
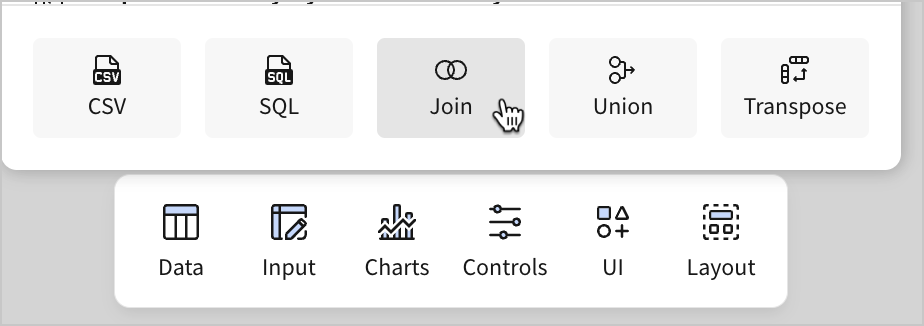
2. In the **Add element** bar, select **Data** > **Table**. In the **Select source** modal, click **Join**.
3. In the **Select source** modal for the join, select the **Elements** tab, and choose the **FLIGHTS** table from the **Raw Data** page.
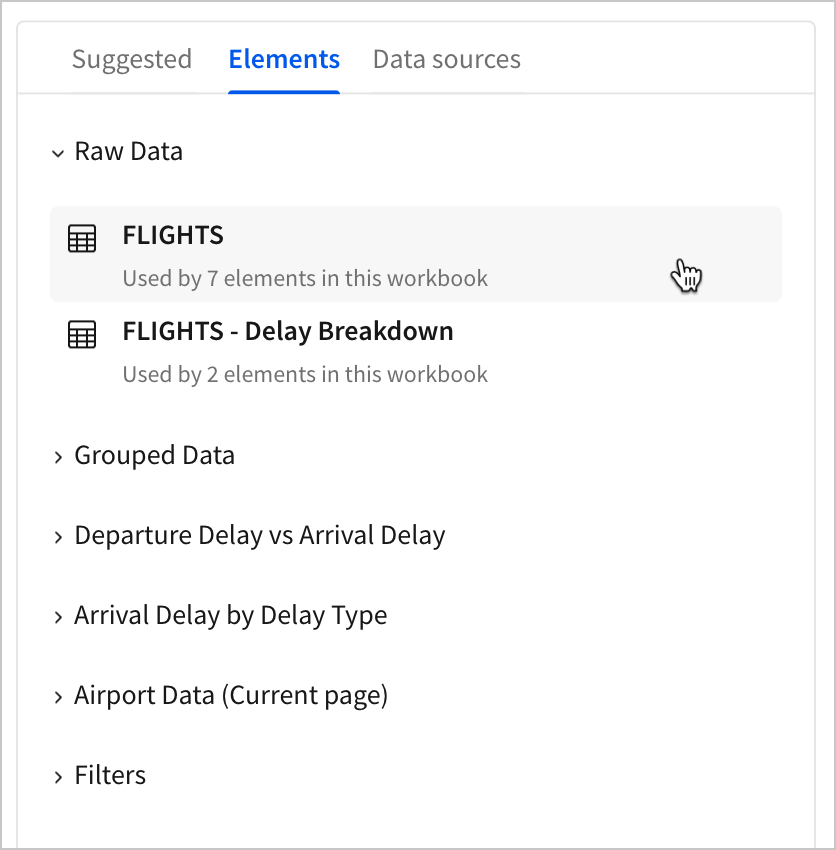
By default, any column that is not hidden is selected for the join. Click **Select**.
4. The **Create join** screen opens, where you can identify elements to join onto the **FLIGHTS** table you selected in the previous step.
5. Select
in the column header to add a new column to the input table, and select **Text**.

2. Double click a cell, and enter some text.

Unlike other table elements, we can make cell-level entries in input tables. Just like the CSV data we uploaded when creating this input table, this data is stored in the write-back schema in your data platform. This new column is just a demonstration, and has no practical application for our use case, so we can delete it for now.
3. Right-click the header of the **Text** column, and select **Delete column**.
Now, let’s consider how we could use this newly entered data about airports to enrich our analysis of delay times. Our input table has three columns:
* **ID** - Lists the ID of the airport.
* **Latitude** - Provides a coordinate value for how far north or south the airport is.
* **Longitude** - Provides the coordinate for how far east or west the airport is.
If we combine this information with our existing information on flights, we can visualize departure delays by airport location. For example, we might use the airport ID to join the geographical coordinates as two additional columns in the flights table.
After we have that joined table, we can create detailed visualizations with geographical location. As an imagined end-state, we could build a map that shows larger, redder dots for airports with a higher average departure delay, like this:

In the rest of this section we’ll walk through how to join tables to create this chart.
1. Navigate to the **Airport Data** page.
2. In the **Add element** bar, select **Data** > **Table**. In the **Select source** modal, click **Join**.

3. In the **Select source** modal for the join, select the **Elements** tab, and choose the **FLIGHTS** table from the **Raw Data** page.

By default, any column that is not hidden is selected for the join. Click **Select**.
4. The **Create join** screen opens, where you can identify elements to join onto the **FLIGHTS** table you selected in the previous step.
5. Select  **Add source**.
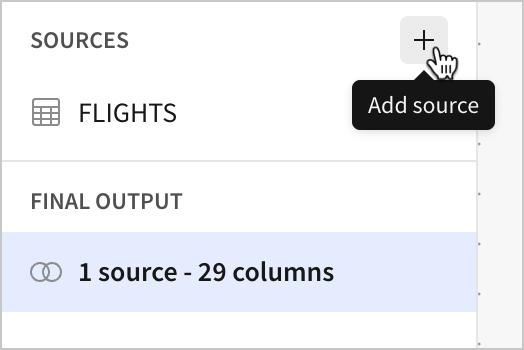
6. Navigate to the **Elements** tab, and select **Airport Locations** from the **Airport Data** page.
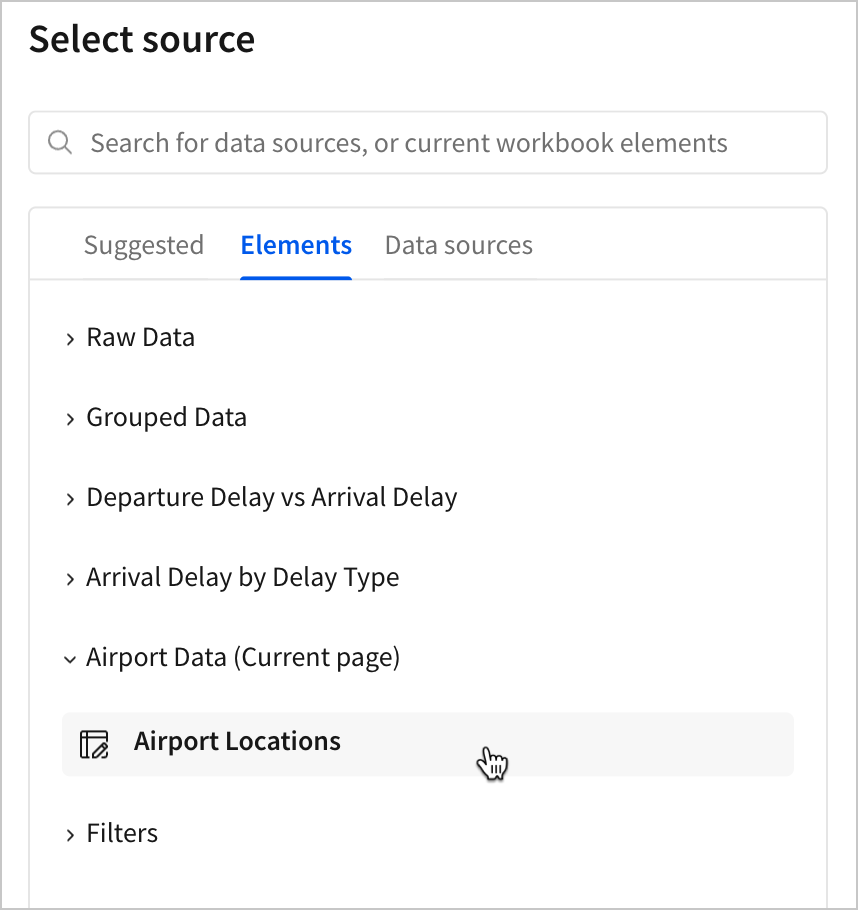
7. Click Select.
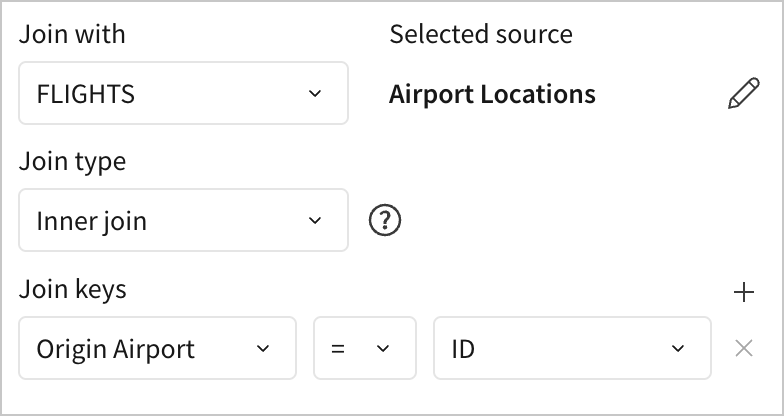
8. Configure the following join settings:
* **Join with** - FLIGHTS
* **Selected source** - Airport Locations
* **Join type** - Inner join
* **Join keys** - Origin Airport = ID
9. Click **Preview output**.
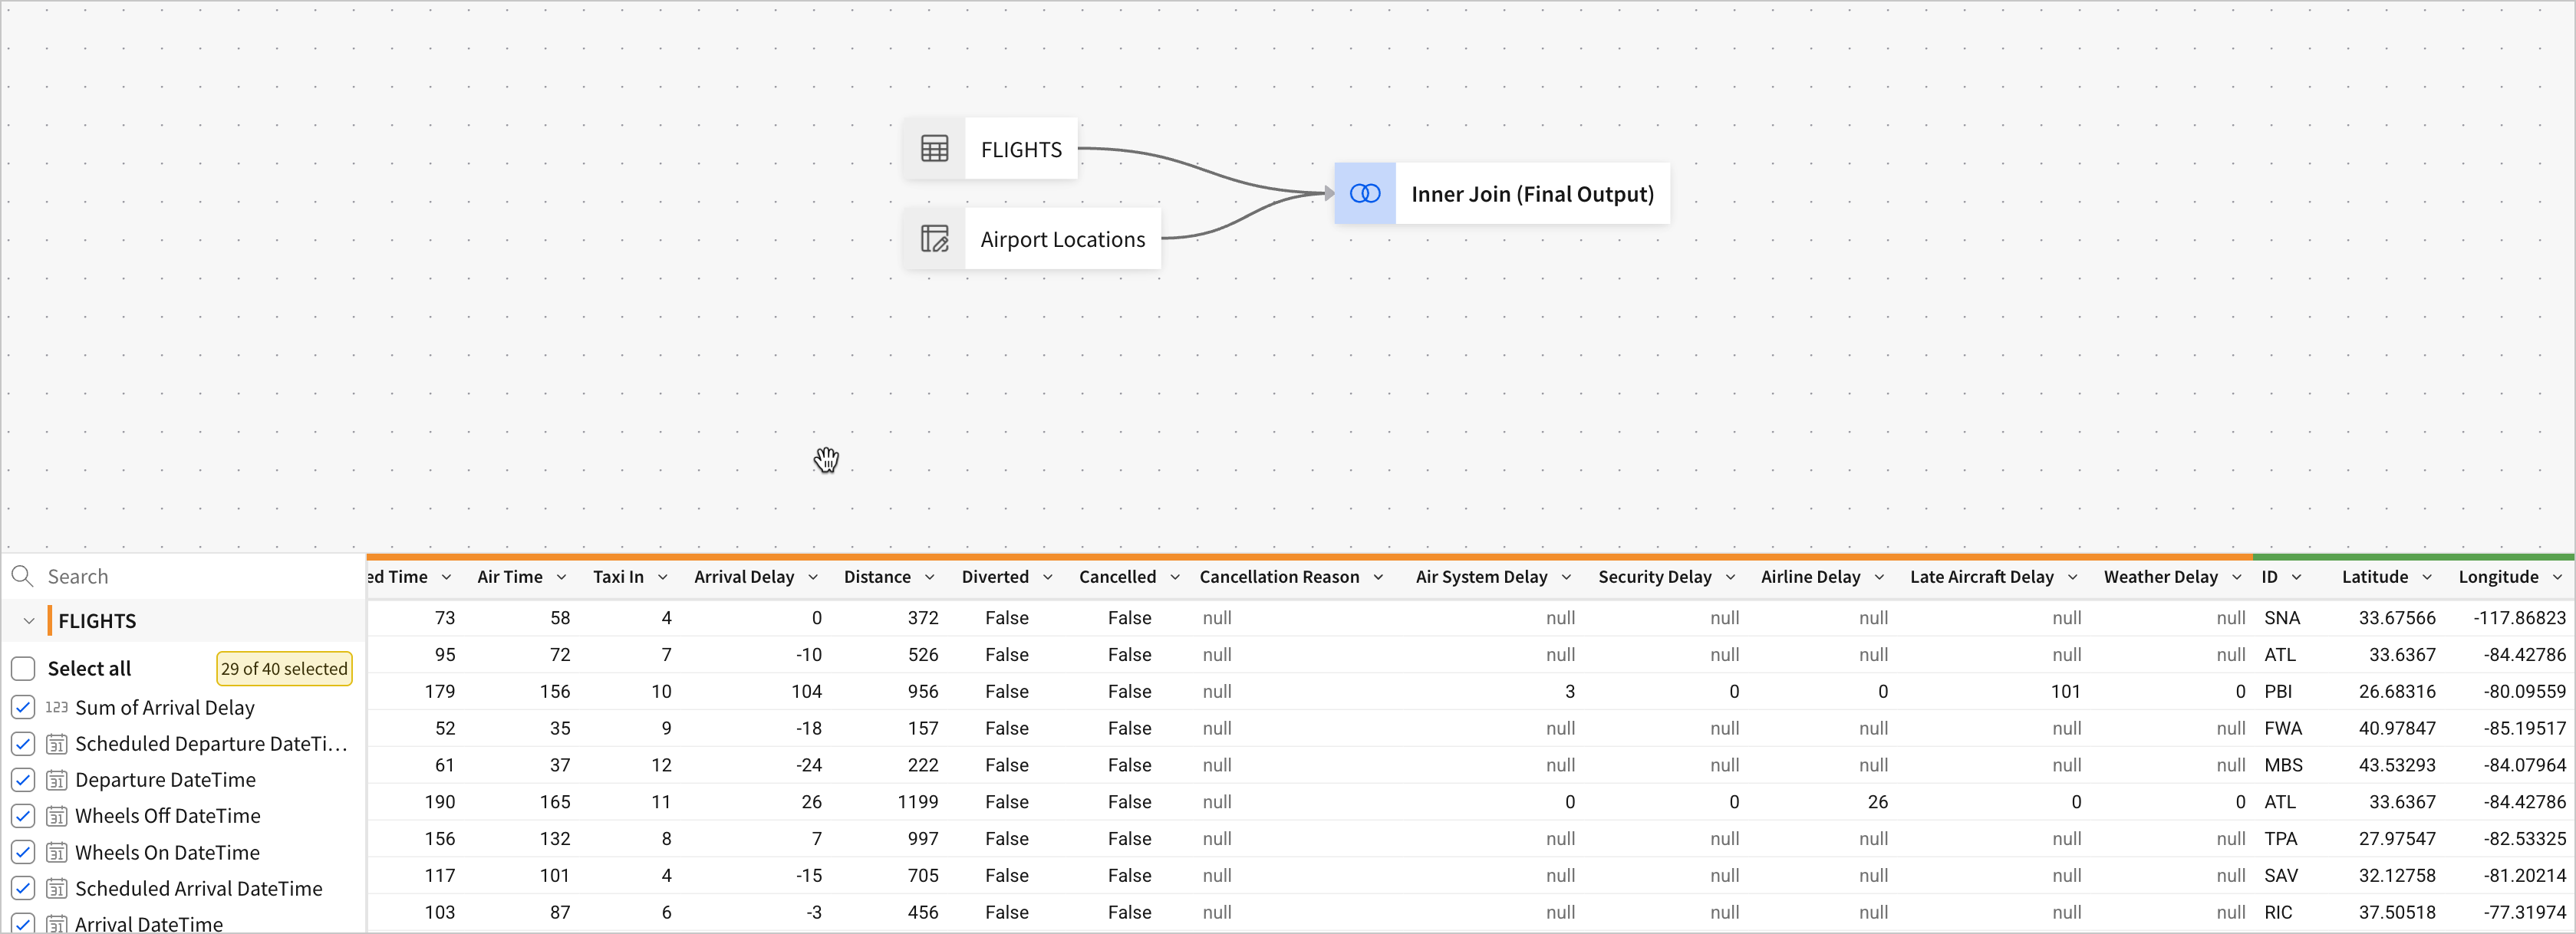
In the provided preview, we can see a directed acyclic graph (DAG) representing the join of the two tables, as well as a set of sample records. The DAG shows us that the two sources we selected - **FLIGHTS** and **Airport Locations** - will join into a new table. In the sample records, we can see what the new table will look like, with colors indicating which table the columns originated from. The orange columns are from **FLIGHTS** while the green columns are from **Airport Locations**.
#### What’s a join?
For those unfamiliar with joins, let’s take a moment to describe what we just did. Joining is the general term for combining two tables based on matching information in each table. We used the `Origin Airport` column from **FLIGHTS** and the `ID` column from **Airport Locations** as keys to match information from the two tables and combine it into new records.
We can describe the result as the following:
*For each record in FLIGHTS with an Origin Airport value that appears in Airport Locations, add the latitude and longitude for the ID that matches the Origin Airport value for that record.*
So, for a flight record in **FLIGHTS** that lists `SNA` as the origin airport, we get the coordinates for `SNA` from the **Airport Locations** table, and add them to the record.
Because we performed an inner join, we only keep records where there’s a match in both tables. If we wanted to keep all records in one set but add on information from another set where it exists, we’d use a different join type. See [Overview of joining data](/docs/joins-overview).
Bonus: This is similar to the concept of a [Lookup](/docs/lookup). The main difference in this case is that we only kept records that had a key value in both tables, so any airports without coordinates were removed from the dataset. Because of this, the table that results from the join has fewer records than the original **FLIGHTS** table.
10. Click **Done**.
Back on the workbook page, the new table element **FLIGHTS +1** appears.
Now that each of our flight records has the coordinates for the origin airport, let’s try mapping them.
1. Create a new child chart element from the **FLIGHTS +1** table.
2. In the editor panel, set the **Chart type** to **Map - Point**. In the **Latitude** and **Longitude** sections, select the columns of the same name from our data source.
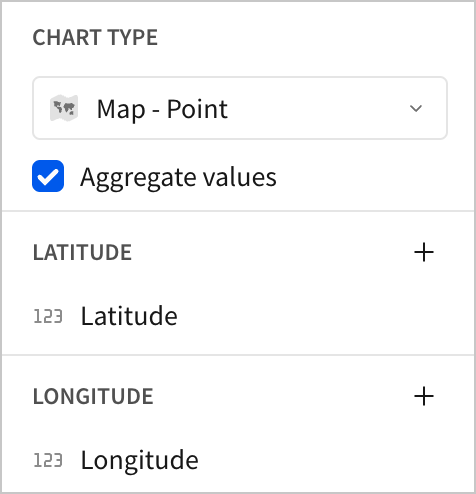
The map element populates with a point for each airport.
While this is helpful, we could have made this chart with just the **Airport Locations** table. All it requires is a latitude and longitude, which we already had. The real advantage of joining coordinates onto each flight record is that we can now include aggregate information about the flights at each airport on our map. Let’s color-code and scale the dots for each airport according to the average departure delay for flights that originated there.
3. In the editor panel, under the **Color** tab, open the dropdown menu and select **By scale**.
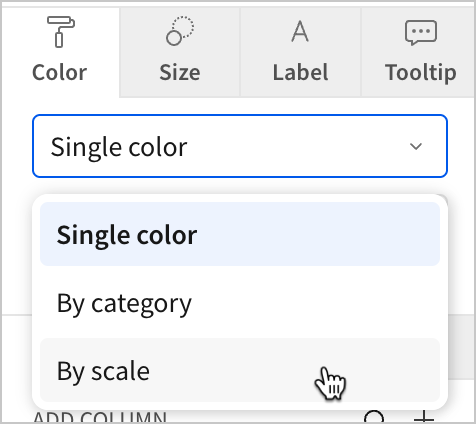
4. Click **Add calculation…** and add the **Departure Delay** column. Change the aggregate from **Sum** to **Avg**.
5. To create a color scale like the example from earlier, change the color scale to **Diverging**, select **Reverse color scale**, and select this blue-to-red diverging scheme.
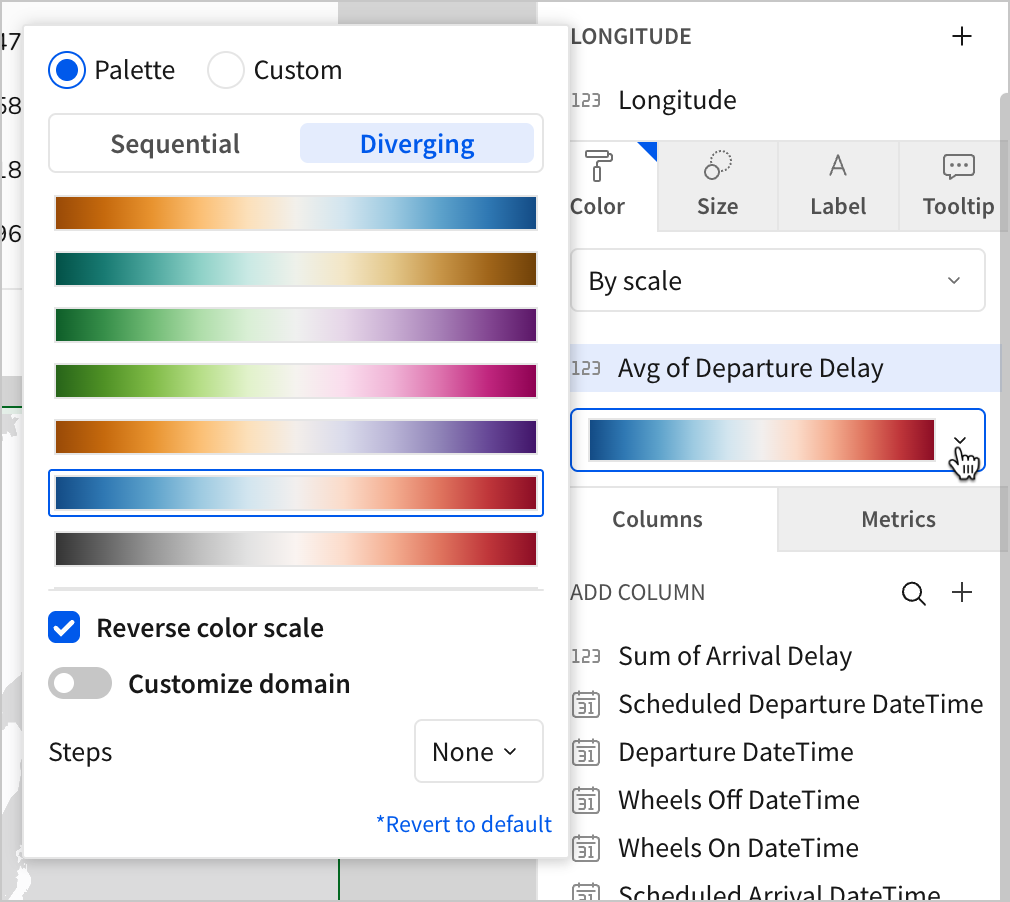
Airports with the highest average departure delay now appear in dark red, while airports with the lowest departure delay appear in dark blue.
6. In the editor panel, select the **Size** tab.
7. Under **Select column**, click **Add calculation…**
8. Select the **Departure Delay** column, and change the aggregate from **Sum** to **Avg**.
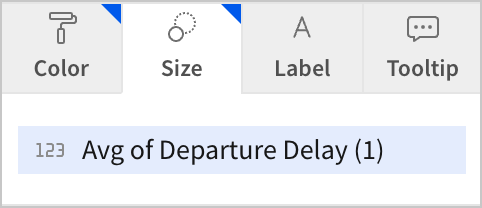
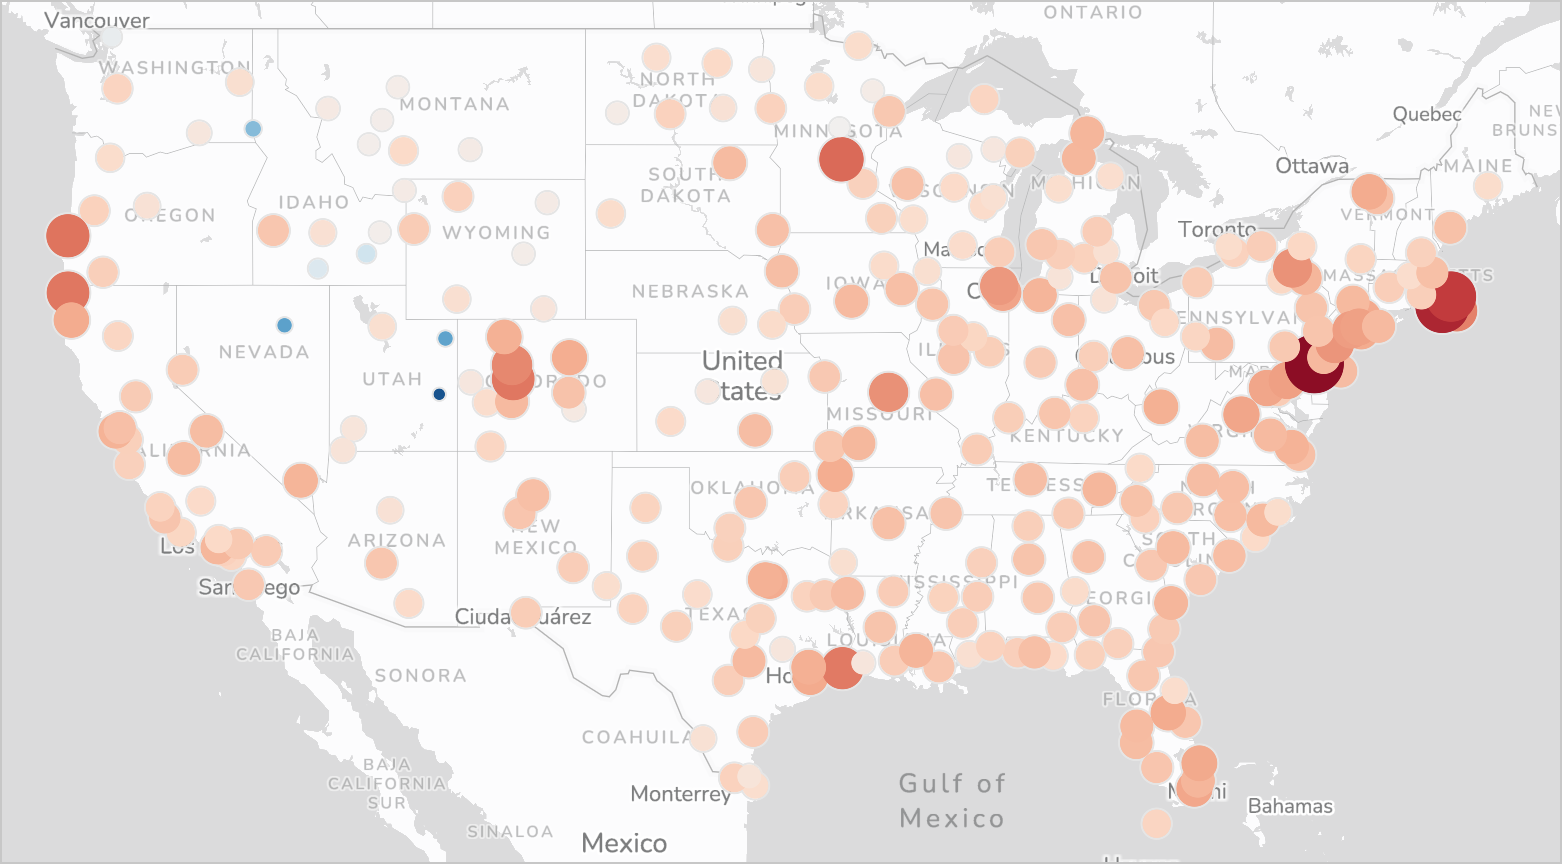
Now, we’ve created a chart where we can see each origin airport by departure delay, allowing us to quickly scan the country for trends in the data. Any larger, redder dot means that that airport has a higher average departure delay for flights leaving there. We might notice that the largest, reddest dots happen to cluster around population centers in the East and on the West coast of the United States.
#### So more population equals more delays, right?
Our chart seems to suggest that higher population areas see more delays, but let’s think about how we might use this chart and our dataset to prove or disprove that hypothesis.
While it’s true that the areas with redder dots are in the higher population areas of the US, the trend doesn’t seem to hold true for individual airports in those regions. Airports like BOS, JFK, MSP, and SFO that are near big red dots don’t have big red dots themselves.
Try a few bonus tasks on your own to investigate the trend more:
* Add the total number of flights from each airport to the tooltip for each point
* Add the airport name to the tooltip for each point
* Add a bar chart next to the map that lists the top 10 airports with the greatest departure delay
* Calculate the [correlation](/docs/corr) between flight volume and departure delay time per airport
Do the airports with the greatest departure delays actually have more flights?
9. Move the map chart to a new page.
10. Name the new page **Departure Delay by Airport**.
11. Hide the **Airport Data** page that contains the CSV upload and join table.
12. Click **Publish** to save your work to the published version.
## Allow users to enter information on new flights
To round out this fundamentals course, we’ll do something that requires all the skills we’ve learned so far: create an interface where users can enter information about a flight, create a new record for that flight, and update all charts immediately with the new information.
Since this is the last section of the tutorial, the instructions are a little less direct than previous sections. This is to help you test your knowledge and reinforce what you’ve learned so far.
Take a moment and consider - how would you accomplish this?
Here are some questions to consider:
* What elements would allow users to enter information about a flight?
* How would you implement this as an intuitive user experience?
* Where would you store information once users have entered it?
* How would you integrate the new records into the charts as they’re created?
The rest of this section walks through one way we might implement this. Let’s break the problem down into steps with potential solutions:
* **Data entry** - Users can configure control values to indicate the origin and destination, flight duration, flight number, date, etc.
* **User experience** - The controls can all be stored in a modal that’s opened by a button, like our filter modal.
* **Storing information** - We can read the control values into a new record in an input table via an action sequence.
* **Live updates** - We can change our data source for the charts to a new table, and that new table will be the combination of the original **FLIGHTS** table with the input table.
Let’s configure the control interface where users can enter data.
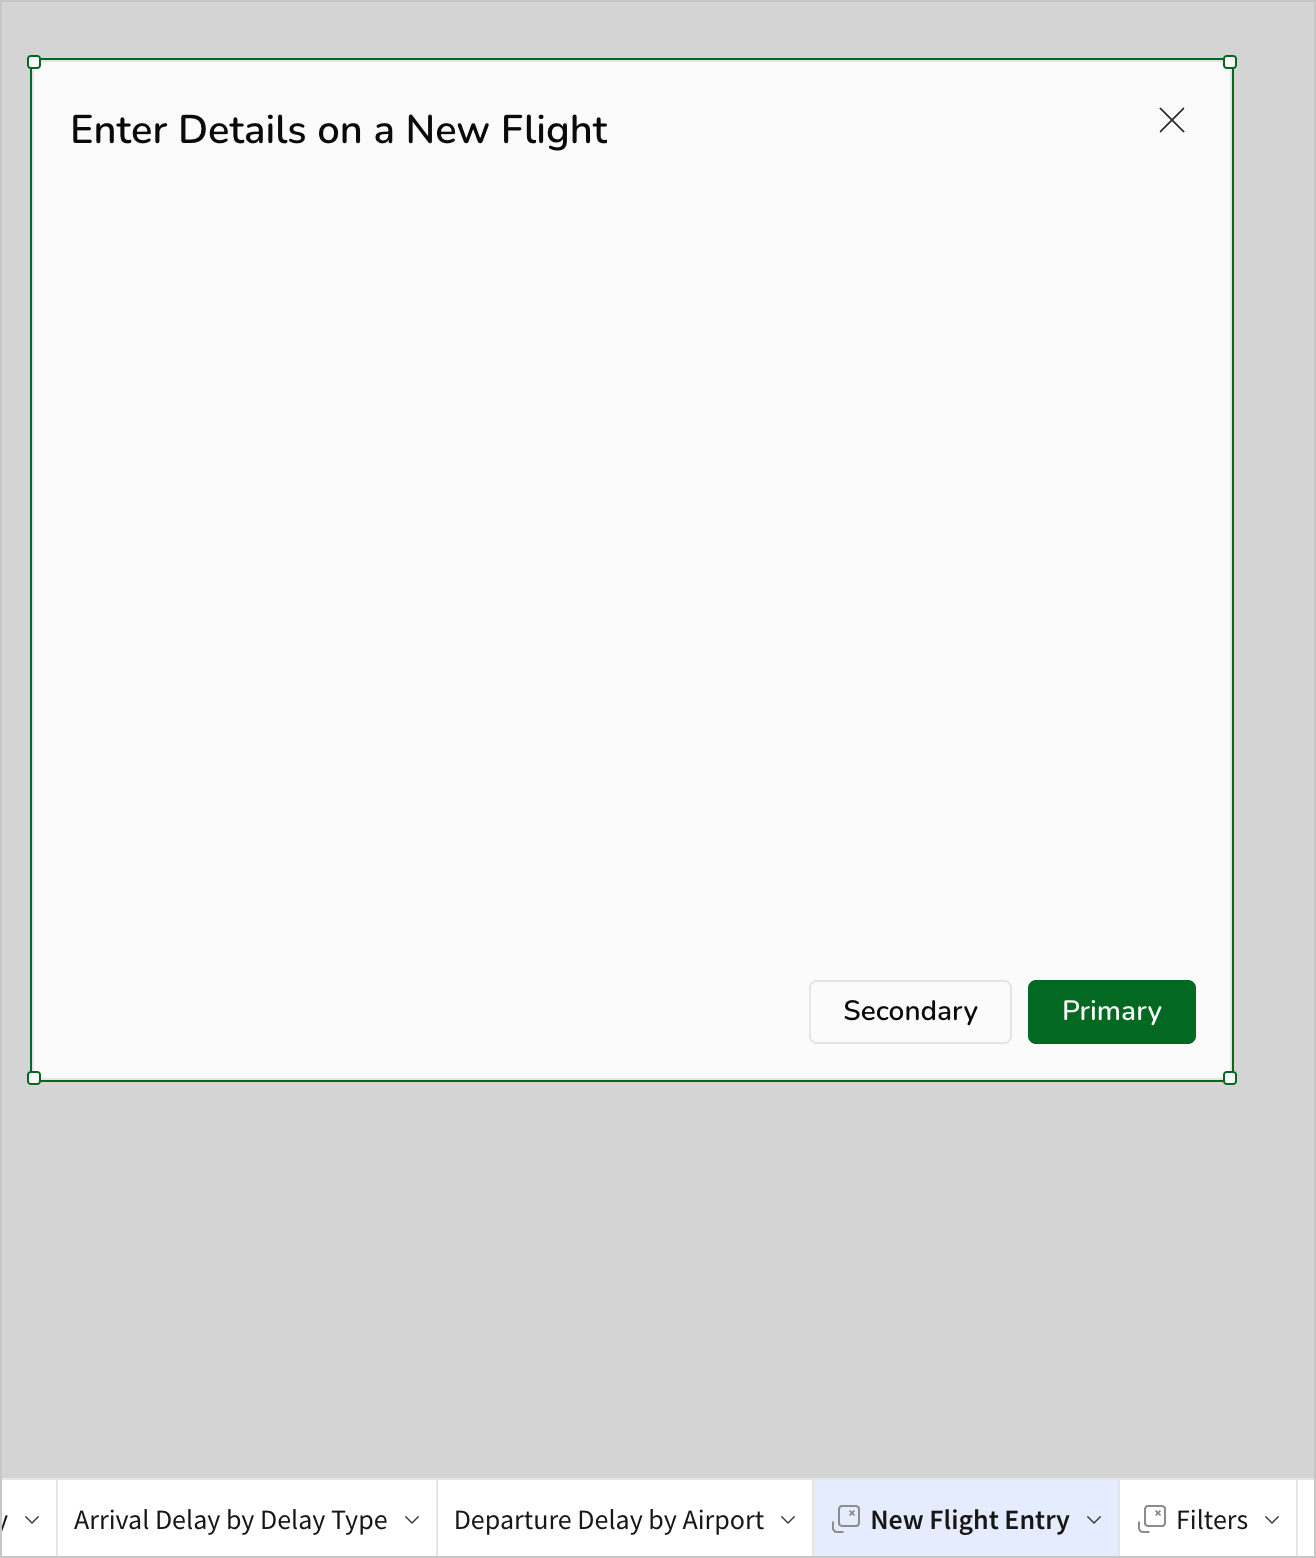
1. Add a new modal to the workbook. Name it `New Flight Entry`, and set the title to `Enter Details on a New Flight`.
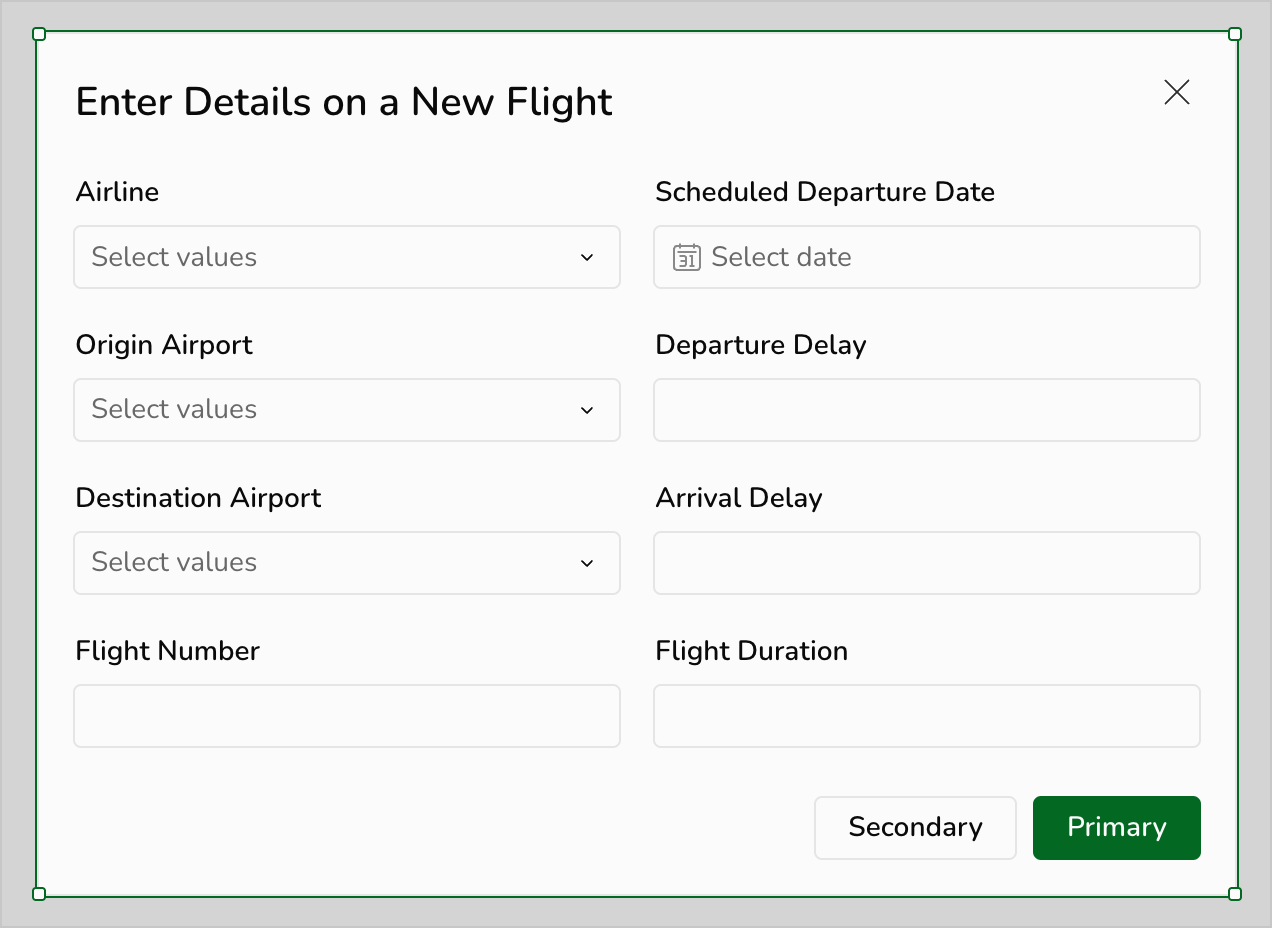
2. In the **New Flight Entry** modal, add the following eight control elements:
* A list values control titled `Airline`
* A list values control titled `Origin Airport`
* A list values control titled `Destination Airport`
* A date control titled `Scheduled Departure Date`
* A number input control titled `Flight Number`
* A number input control titled `Departure Delay`
* A number input control titled `Arrival Delay`
* A number input control titled `Flight Duration`
3. For the three list values controls, configure the list of values that users can select from.
4. Since there’s already a list of valid `Airline` and `Airport` values in the **FLIGHTS** table, configure each control to use the appropriate column in that table as a source of values.
For example, the configuration in the editor panel for the **Airline** control looks like this:
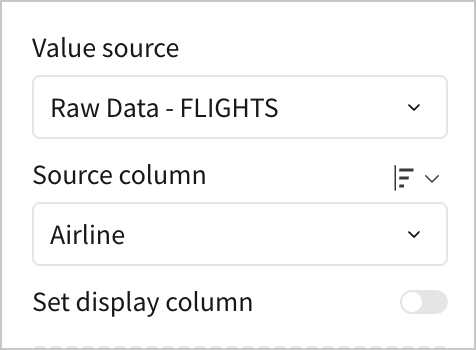
5. Using Airline as the **Source column** means that when users select the **Airline** list values control, they can select from the values that exist in the `Airline` column of **FLIGHTS**.
6. For each list values control, uncheck the boxes for **Allow multiple selection** and **Show null option**. You can find these in the **Properties** section of the editor panel. These settings ensure that users must select one and only one non-null option for these fields when creating a new record.
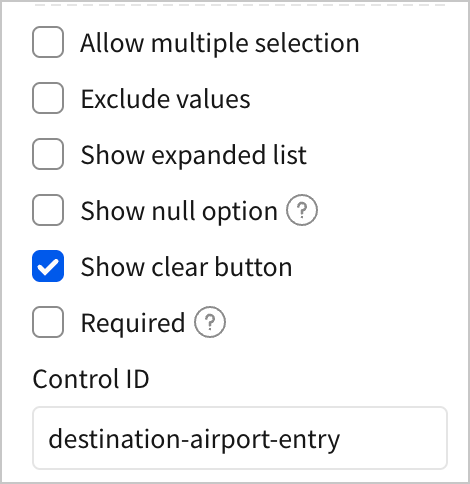
When you’ve done this for all three list values controls, move on to the next step.
7. Now, give all eight controls a reasonable **Control ID** you can reference later.
For example, give the **Airline** control an ID like `airline-entry`, so that you can identify that it’s not a filter. You can give **Origin Airport** an ID like `origin-airport-entry`, and so on for the remaining.
Before we can configure actions that read these control values, we need a place to store the data about these new flights. Let’s create an input table to capture the information.
1. Create a new page. Hide it, and rename it `New Flight Data`.
2. On the **New Flight Data** page, use the **Add element** bar to create a new input table. Select the **Empty** input table type.
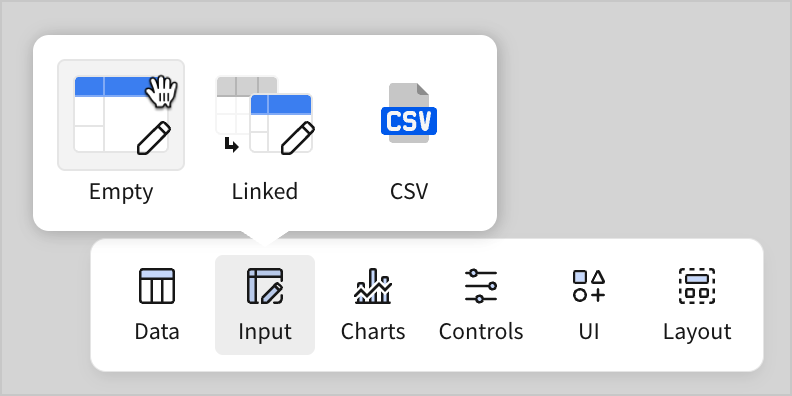
3. Select **Sigma Sample Database** as the connection, and click **Create**.
4. Name the table **New Flight Entries**.
5. Configure the new input table with the following nine columns:
* A number column titled `Flight Number`
* A date column titled `Scheduled Departure Date`
* A text column titled `Origin Airport`
* A text column titled `Destination Airport`
* A number column titled `Departure Delay`
* A number column titled `Arrival Delay`
* A number column titled `Flight Duration`
* A text column titled `Airline`
* A Calc column titled `Cancelled?`
6. In the formula bar for the `Cancelled?` column, enter `False` and click the green check. This updates the column to the logical data type, and populates it with the value `False` by default.
We’re configuring this default value for `Cancellations?` because each record needs this information to work with the filters we’ve configured in the workbook. We’re making an assumption here that if a user enters a new flight record, the flight was not cancelled. In a future version of this, we could provide users a method to input this information.
The editor panel for the **New Flight Entries** input table looks something like the following:
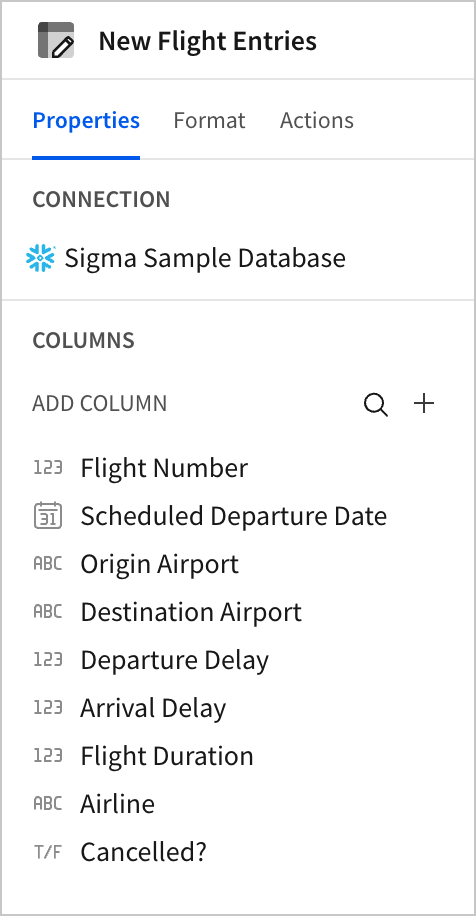
We’ve now configured a set of controls where users can enter data and a table in which to store that data. Next, let’s configure the necessary actions to create a new record in New Flight Entries based on the contents of the controls.
1. Navigate to the **New Flight Entry** modal.
2. In the editor panel, select **Format**.
3. Open the **Footer** section. Rename the **Primary** button to `Create Entry` and the **Secondary** button to `Clear Fields`.
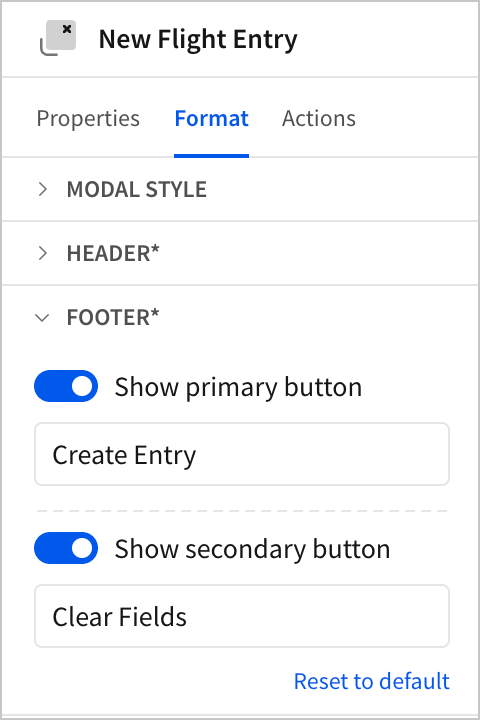
4. In the editor panel, select **Actions**.
5. In the **Action sequence** with an **On click - primary** trigger, click **Add action**.
6. Configure an **Insert row** action to insert a row into the **New Flight Entries** input table. For each field in **New Flight Entries** select the corresponding control from the **New Flight Entry** modal to populate the value.
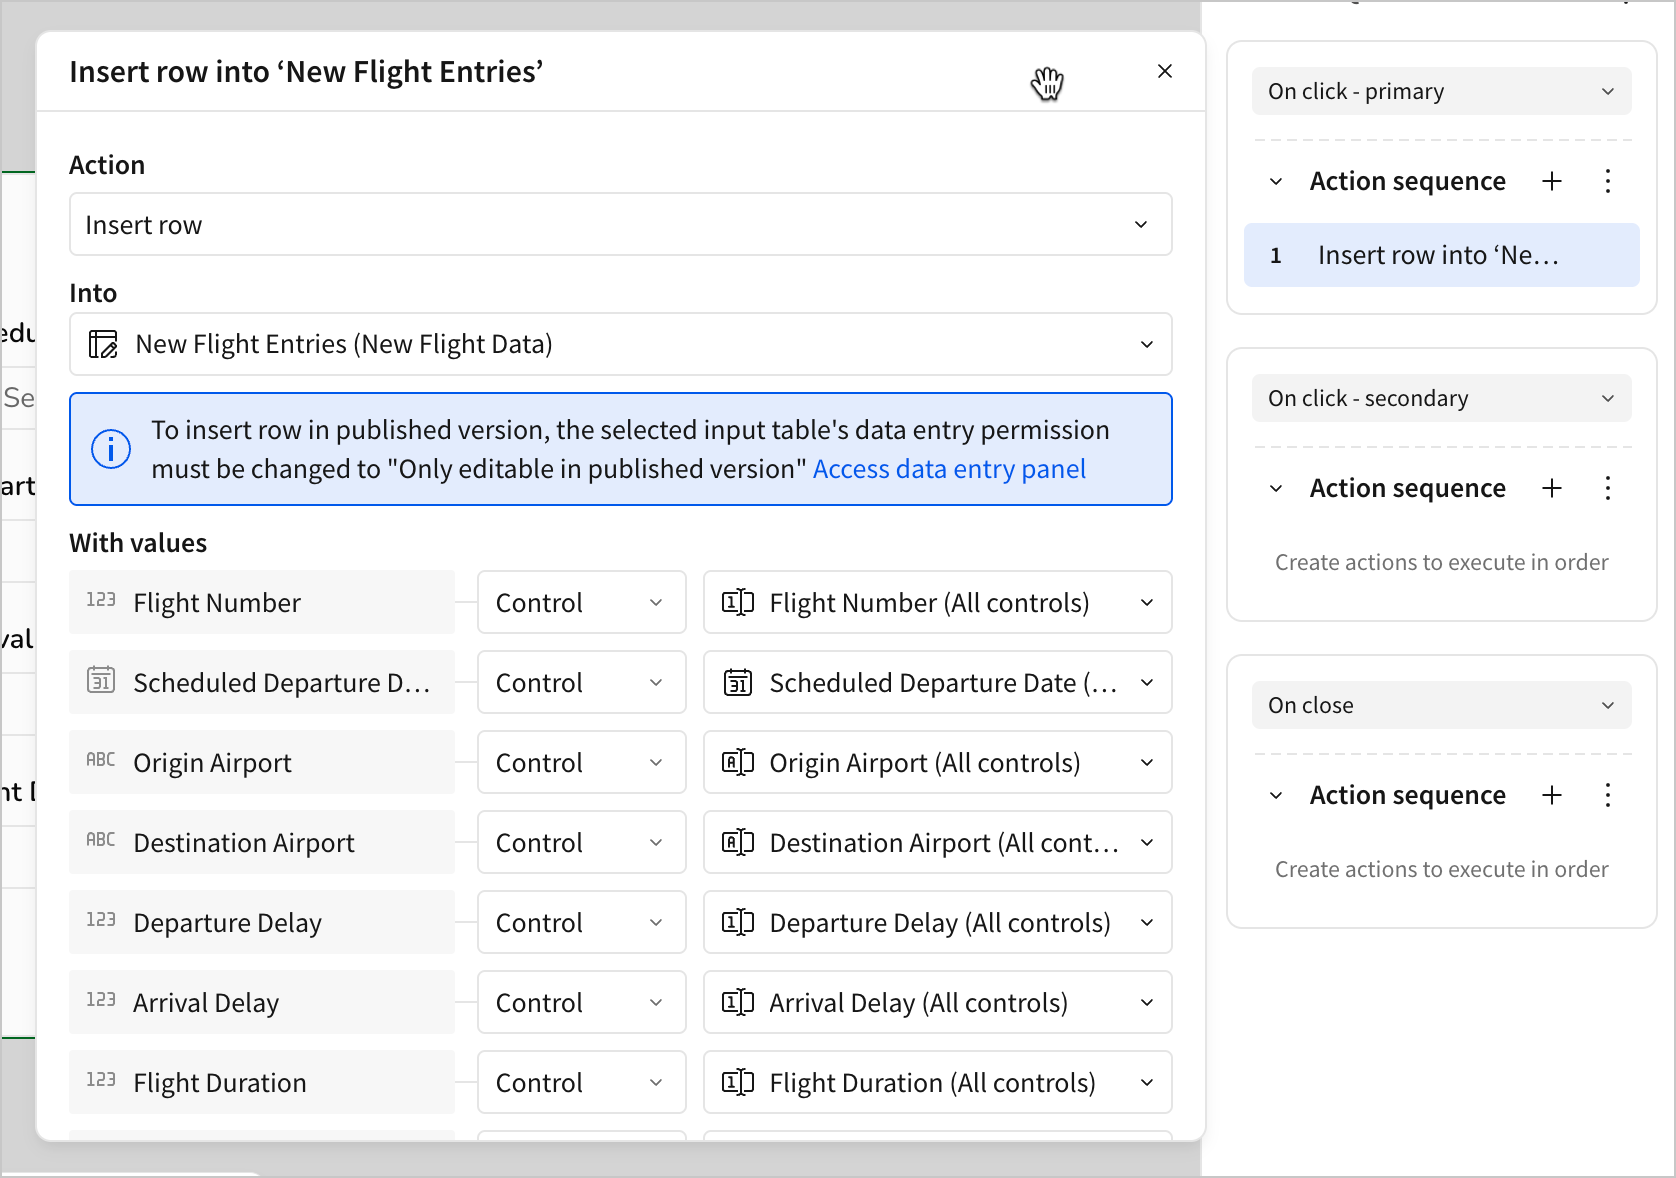
Additionally, configure a condition for this action sequence that checks to make sure none of the entry controls are null before submitting a record.
1. Click
**Add source**.

6. Navigate to the **Elements** tab, and select **Airport Locations** from the **Airport Data** page.

7. Click Select.
8. Configure the following join settings:
* **Join with** - FLIGHTS
* **Selected source** - Airport Locations
* **Join type** - Inner join
* **Join keys** - Origin Airport = ID

9. Click **Preview output**.
In the provided preview, we can see a directed acyclic graph (DAG) representing the join of the two tables, as well as a set of sample records. The DAG shows us that the two sources we selected - **FLIGHTS** and **Airport Locations** - will join into a new table. In the sample records, we can see what the new table will look like, with colors indicating which table the columns originated from. The orange columns are from **FLIGHTS** while the green columns are from **Airport Locations**.

#### What’s a join?
For those unfamiliar with joins, let’s take a moment to describe what we just did. Joining is the general term for combining two tables based on matching information in each table. We used the `Origin Airport` column from **FLIGHTS** and the `ID` column from **Airport Locations** as keys to match information from the two tables and combine it into new records.
We can describe the result as the following:
*For each record in FLIGHTS with an Origin Airport value that appears in Airport Locations, add the latitude and longitude for the ID that matches the Origin Airport value for that record.*
So, for a flight record in **FLIGHTS** that lists `SNA` as the origin airport, we get the coordinates for `SNA` from the **Airport Locations** table, and add them to the record.
Because we performed an inner join, we only keep records where there’s a match in both tables. If we wanted to keep all records in one set but add on information from another set where it exists, we’d use a different join type. See [Overview of joining data](/docs/joins-overview).
Bonus: This is similar to the concept of a [Lookup](/docs/lookup). The main difference in this case is that we only kept records that had a key value in both tables, so any airports without coordinates were removed from the dataset. Because of this, the table that results from the join has fewer records than the original **FLIGHTS** table.
10. Click **Done**.
Back on the workbook page, the new table element **FLIGHTS +1** appears.
Now that each of our flight records has the coordinates for the origin airport, let’s try mapping them.
1. Create a new child chart element from the **FLIGHTS +1** table.
2. In the editor panel, set the **Chart type** to **Map - Point**. In the **Latitude** and **Longitude** sections, select the columns of the same name from our data source.

The map element populates with a point for each airport.
While this is helpful, we could have made this chart with just the **Airport Locations** table. All it requires is a latitude and longitude, which we already had. The real advantage of joining coordinates onto each flight record is that we can now include aggregate information about the flights at each airport on our map. Let’s color-code and scale the dots for each airport according to the average departure delay for flights that originated there.
3. In the editor panel, under the **Color** tab, open the dropdown menu and select **By scale**.

4. Click **Add calculation…** and add the **Departure Delay** column. Change the aggregate from **Sum** to **Avg**.
5. To create a color scale like the example from earlier, change the color scale to **Diverging**, select **Reverse color scale**, and select this blue-to-red diverging scheme.

Airports with the highest average departure delay now appear in dark red, while airports with the lowest departure delay appear in dark blue.
6. In the editor panel, select the **Size** tab.
7. Under **Select column**, click **Add calculation…**
8. Select the **Departure Delay** column, and change the aggregate from **Sum** to **Avg**.

Now, we’ve created a chart where we can see each origin airport by departure delay, allowing us to quickly scan the country for trends in the data. Any larger, redder dot means that that airport has a higher average departure delay for flights leaving there. We might notice that the largest, reddest dots happen to cluster around population centers in the East and on the West coast of the United States.

#### So more population equals more delays, right?
Our chart seems to suggest that higher population areas see more delays, but let’s think about how we might use this chart and our dataset to prove or disprove that hypothesis.
While it’s true that the areas with redder dots are in the higher population areas of the US, the trend doesn’t seem to hold true for individual airports in those regions. Airports like BOS, JFK, MSP, and SFO that are near big red dots don’t have big red dots themselves.
Try a few bonus tasks on your own to investigate the trend more:
* Add the total number of flights from each airport to the tooltip for each point
* Add the airport name to the tooltip for each point
* Add a bar chart next to the map that lists the top 10 airports with the greatest departure delay
* Calculate the [correlation](/docs/corr) between flight volume and departure delay time per airport
Do the airports with the greatest departure delays actually have more flights?
9. Move the map chart to a new page.
10. Name the new page **Departure Delay by Airport**.
11. Hide the **Airport Data** page that contains the CSV upload and join table.
12. Click **Publish** to save your work to the published version.
## Allow users to enter information on new flights
To round out this fundamentals course, we’ll do something that requires all the skills we’ve learned so far: create an interface where users can enter information about a flight, create a new record for that flight, and update all charts immediately with the new information.
Since this is the last section of the tutorial, the instructions are a little less direct than previous sections. This is to help you test your knowledge and reinforce what you’ve learned so far.
Take a moment and consider - how would you accomplish this?
Here are some questions to consider:
* What elements would allow users to enter information about a flight?
* How would you implement this as an intuitive user experience?
* Where would you store information once users have entered it?
* How would you integrate the new records into the charts as they’re created?
The rest of this section walks through one way we might implement this. Let’s break the problem down into steps with potential solutions:
* **Data entry** - Users can configure control values to indicate the origin and destination, flight duration, flight number, date, etc.
* **User experience** - The controls can all be stored in a modal that’s opened by a button, like our filter modal.
* **Storing information** - We can read the control values into a new record in an input table via an action sequence.
* **Live updates** - We can change our data source for the charts to a new table, and that new table will be the combination of the original **FLIGHTS** table with the input table.
Let’s configure the control interface where users can enter data.
1. Add a new modal to the workbook. Name it `New Flight Entry`, and set the title to `Enter Details on a New Flight`.

2. In the **New Flight Entry** modal, add the following eight control elements:
* A list values control titled `Airline`
* A list values control titled `Origin Airport`
* A list values control titled `Destination Airport`
* A date control titled `Scheduled Departure Date`
* A number input control titled `Flight Number`
* A number input control titled `Departure Delay`
* A number input control titled `Arrival Delay`
* A number input control titled `Flight Duration`

3. For the three list values controls, configure the list of values that users can select from.
4. Since there’s already a list of valid `Airline` and `Airport` values in the **FLIGHTS** table, configure each control to use the appropriate column in that table as a source of values.
For example, the configuration in the editor panel for the **Airline** control looks like this:

5. Using Airline as the **Source column** means that when users select the **Airline** list values control, they can select from the values that exist in the `Airline` column of **FLIGHTS**.
6. For each list values control, uncheck the boxes for **Allow multiple selection** and **Show null option**. You can find these in the **Properties** section of the editor panel. These settings ensure that users must select one and only one non-null option for these fields when creating a new record.

When you’ve done this for all three list values controls, move on to the next step.
7. Now, give all eight controls a reasonable **Control ID** you can reference later.
For example, give the **Airline** control an ID like `airline-entry`, so that you can identify that it’s not a filter. You can give **Origin Airport** an ID like `origin-airport-entry`, and so on for the remaining.
Before we can configure actions that read these control values, we need a place to store the data about these new flights. Let’s create an input table to capture the information.
1. Create a new page. Hide it, and rename it `New Flight Data`.
2. On the **New Flight Data** page, use the **Add element** bar to create a new input table. Select the **Empty** input table type.

3. Select **Sigma Sample Database** as the connection, and click **Create**.
4. Name the table **New Flight Entries**.
5. Configure the new input table with the following nine columns:
* A number column titled `Flight Number`
* A date column titled `Scheduled Departure Date`
* A text column titled `Origin Airport`
* A text column titled `Destination Airport`
* A number column titled `Departure Delay`
* A number column titled `Arrival Delay`
* A number column titled `Flight Duration`
* A text column titled `Airline`
* A Calc column titled `Cancelled?`
6. In the formula bar for the `Cancelled?` column, enter `False` and click the green check. This updates the column to the logical data type, and populates it with the value `False` by default.
We’re configuring this default value for `Cancellations?` because each record needs this information to work with the filters we’ve configured in the workbook. We’re making an assumption here that if a user enters a new flight record, the flight was not cancelled. In a future version of this, we could provide users a method to input this information.
The editor panel for the **New Flight Entries** input table looks something like the following:

We’ve now configured a set of controls where users can enter data and a table in which to store that data. Next, let’s configure the necessary actions to create a new record in New Flight Entries based on the contents of the controls.
1. Navigate to the **New Flight Entry** modal.
2. In the editor panel, select **Format**.
3. Open the **Footer** section. Rename the **Primary** button to `Create Entry` and the **Secondary** button to `Clear Fields`.

4. In the editor panel, select **Actions**.
5. In the **Action sequence** with an **On click - primary** trigger, click **Add action**.
6. Configure an **Insert row** action to insert a row into the **New Flight Entries** input table. For each field in **New Flight Entries** select the corresponding control from the **New Flight Entry** modal to populate the value.

Additionally, configure a condition for this action sequence that checks to make sure none of the entry controls are null before submitting a record.
1. Click  **More** > **Add condition**.
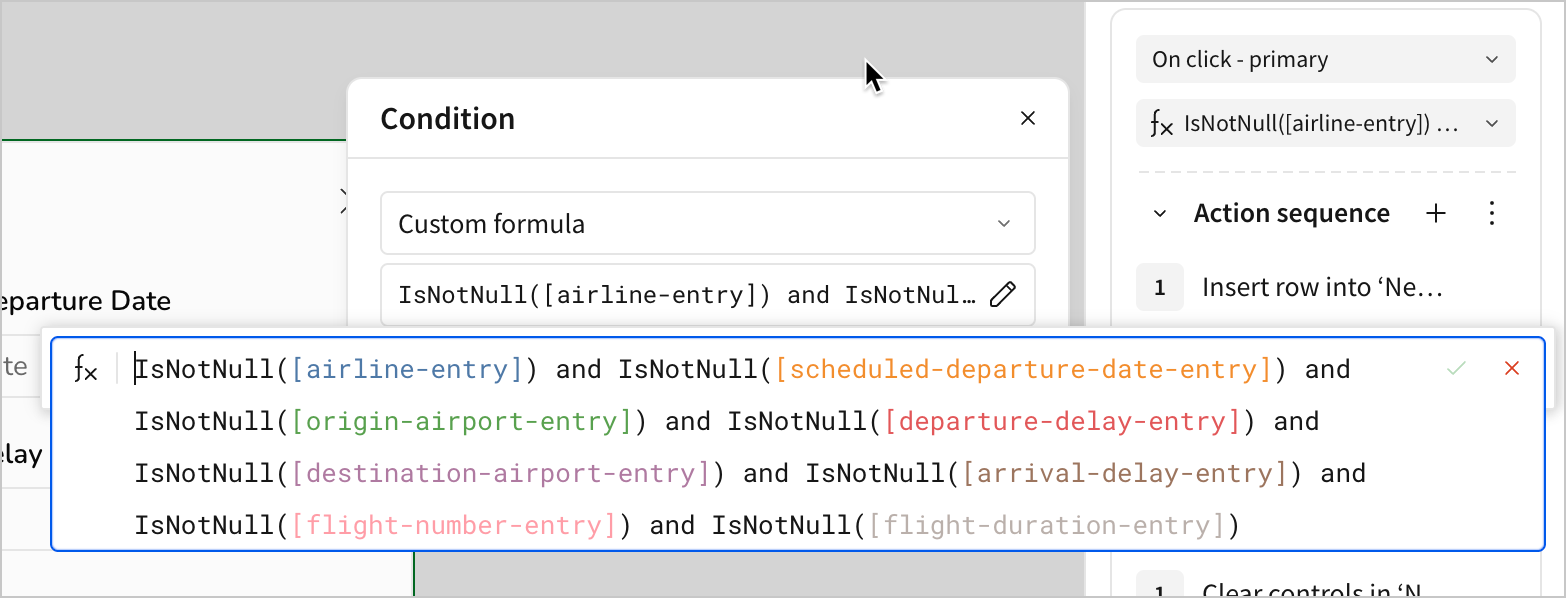
2. Use the following formula:
```
IsNotNull([airline-entry]) and IsNotNull([scheduled-departure-date-entry]) and IsNotNull([origin-airport-entry]) and IsNotNull([departure-delay-entry]) and IsNotNull([destination-airport-entry]) and IsNotNull([arrival-delay-entry]) and IsNotNull([flight-number-entry]) and IsNotNull([flight-duration-entry])
```
#### Why require all values?
At first, it might seem unnecessary to check that all fields are populated before making a new record. But consider the alternative. What would happen if we allowed any set of the controls to be blank, resulting in a null value for that field?
We’d have to:
* Handle null values in every filter and condition we’ve previously configured
* Handle null values for calculations - either exclude them from averages or indicate to users that they might impact averages
* Justify that this extra labor is worth it to handle incomplete records. What value do we gain from getting the arrival delay for a flight with no listed airline or airports?
Only allowing complete records is one way to minimize the amount of extra work we do downstream.
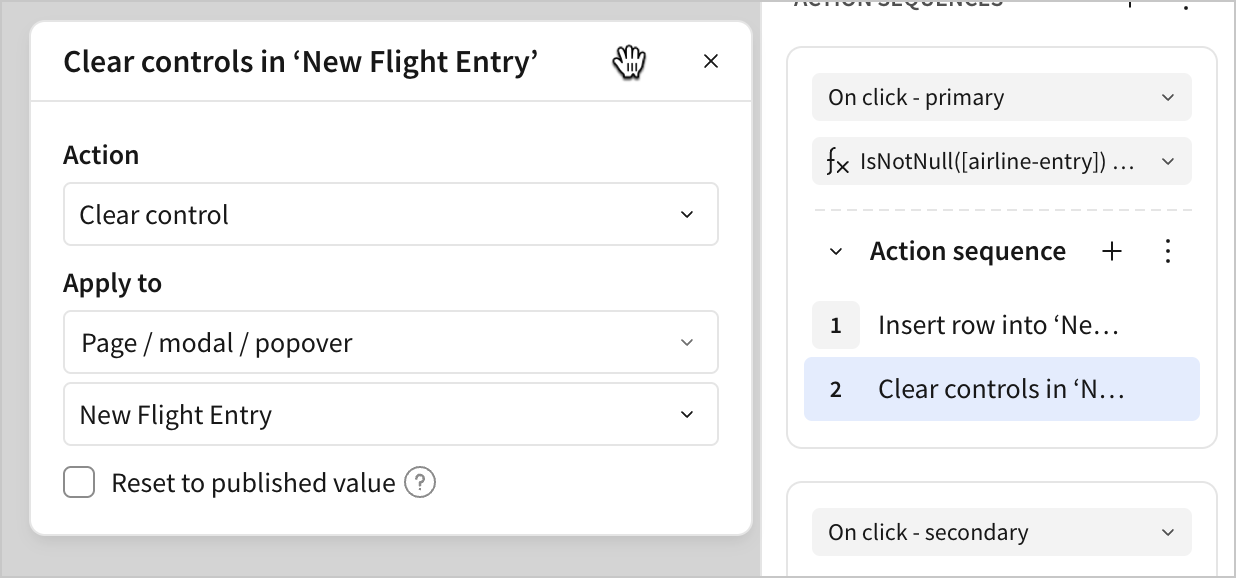
3. Add a second action to the same action sequence to clear all the controls in the **New Flight Entry** modal after you’ve created the new row. This way, the controls automatically clear after a new row is successfully created.
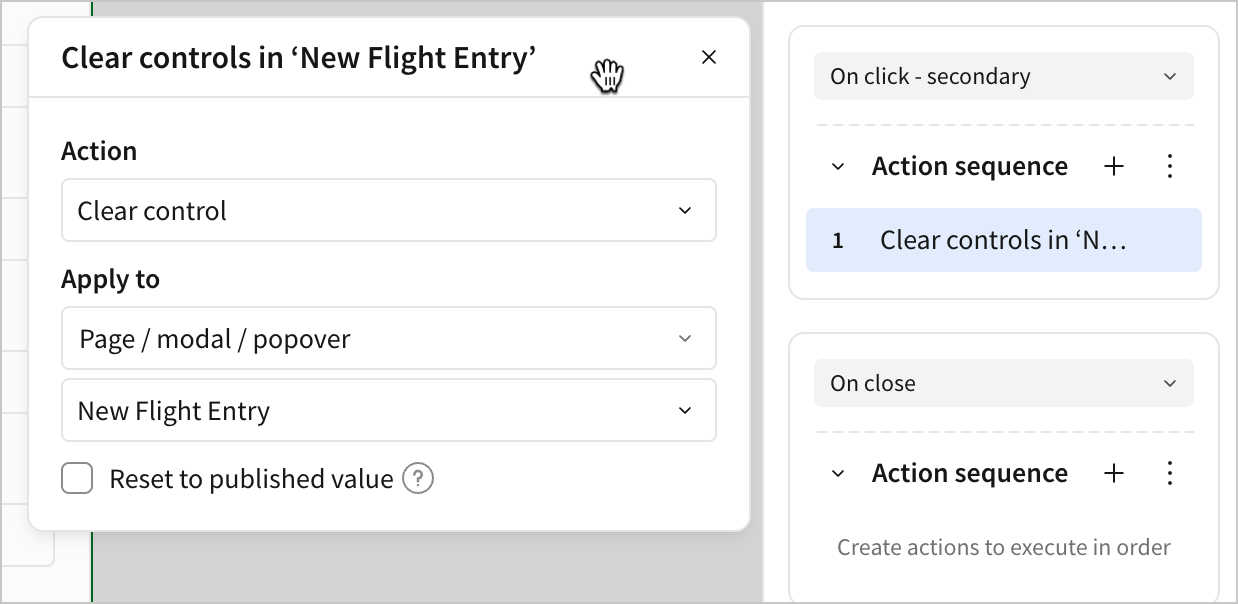
4. In the **Action sequence** with an **On click - secondary** trigger, click **Add action**.
5. Configure a **Clear control** action to clear all controls in the **New Flight Entry** modal.
We can now test the workflow. We can set control values like this:
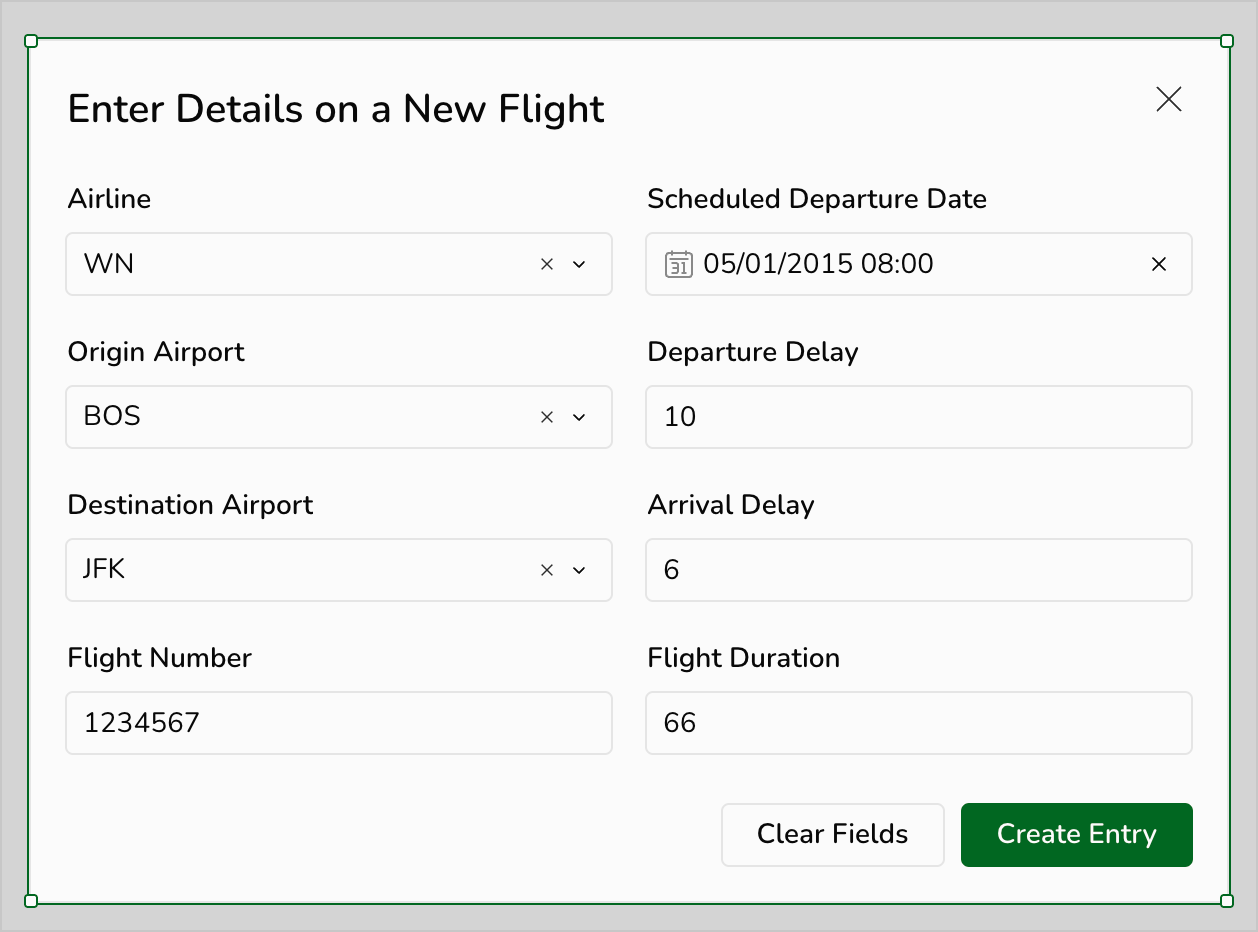
And when we click **Create Entry**, the values appear in the input table like this:

1. Navigate to the **Departure Delay vs Arrival Delay** page.
2. Add a new button element and rename it **Enter Flight**.
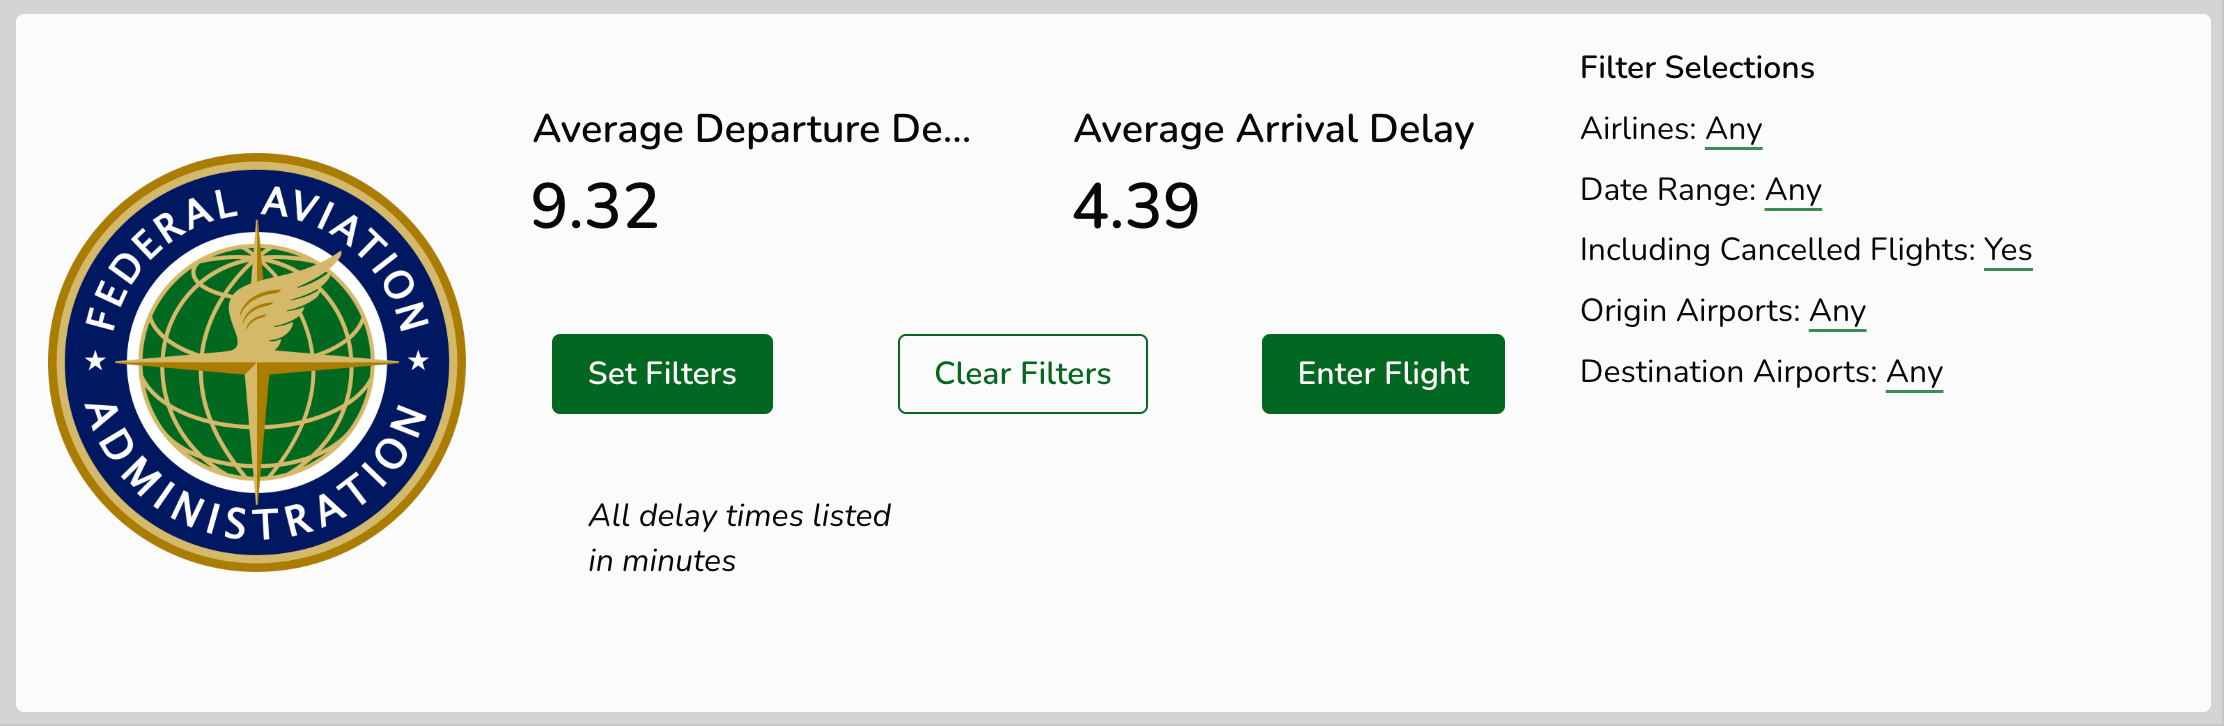
3. Select the button, and add an action to the **Action sequence** triggered **On click** to open the **New Flight Entry** modal.
At this point, we’ve created a system where users can open a modal, enter information about a flight, and click a button to enter that information into a new table. However, none of that information is reflected in our charts and graphs yet. The next section introduces a method to implement that functionality.
## Union new records to our data
One way we could update our charts each time a new entry is created is to change the data source all of our charts are connected to. If we were to replace the current **FLIGHTS** table with a new table that contains all of the records from **FLIGHTS** as well as new entries, then the new records would appear in charts, summaries, and calculations after they’re added.
We can accomplish this with a union. Similar to a join, a union is a way of combining data from multiple tables. However, there’s a key difference. Whereas a join combines columns from multiple tables to make a wider table, a union combines records from multiple tables to create a longer table.
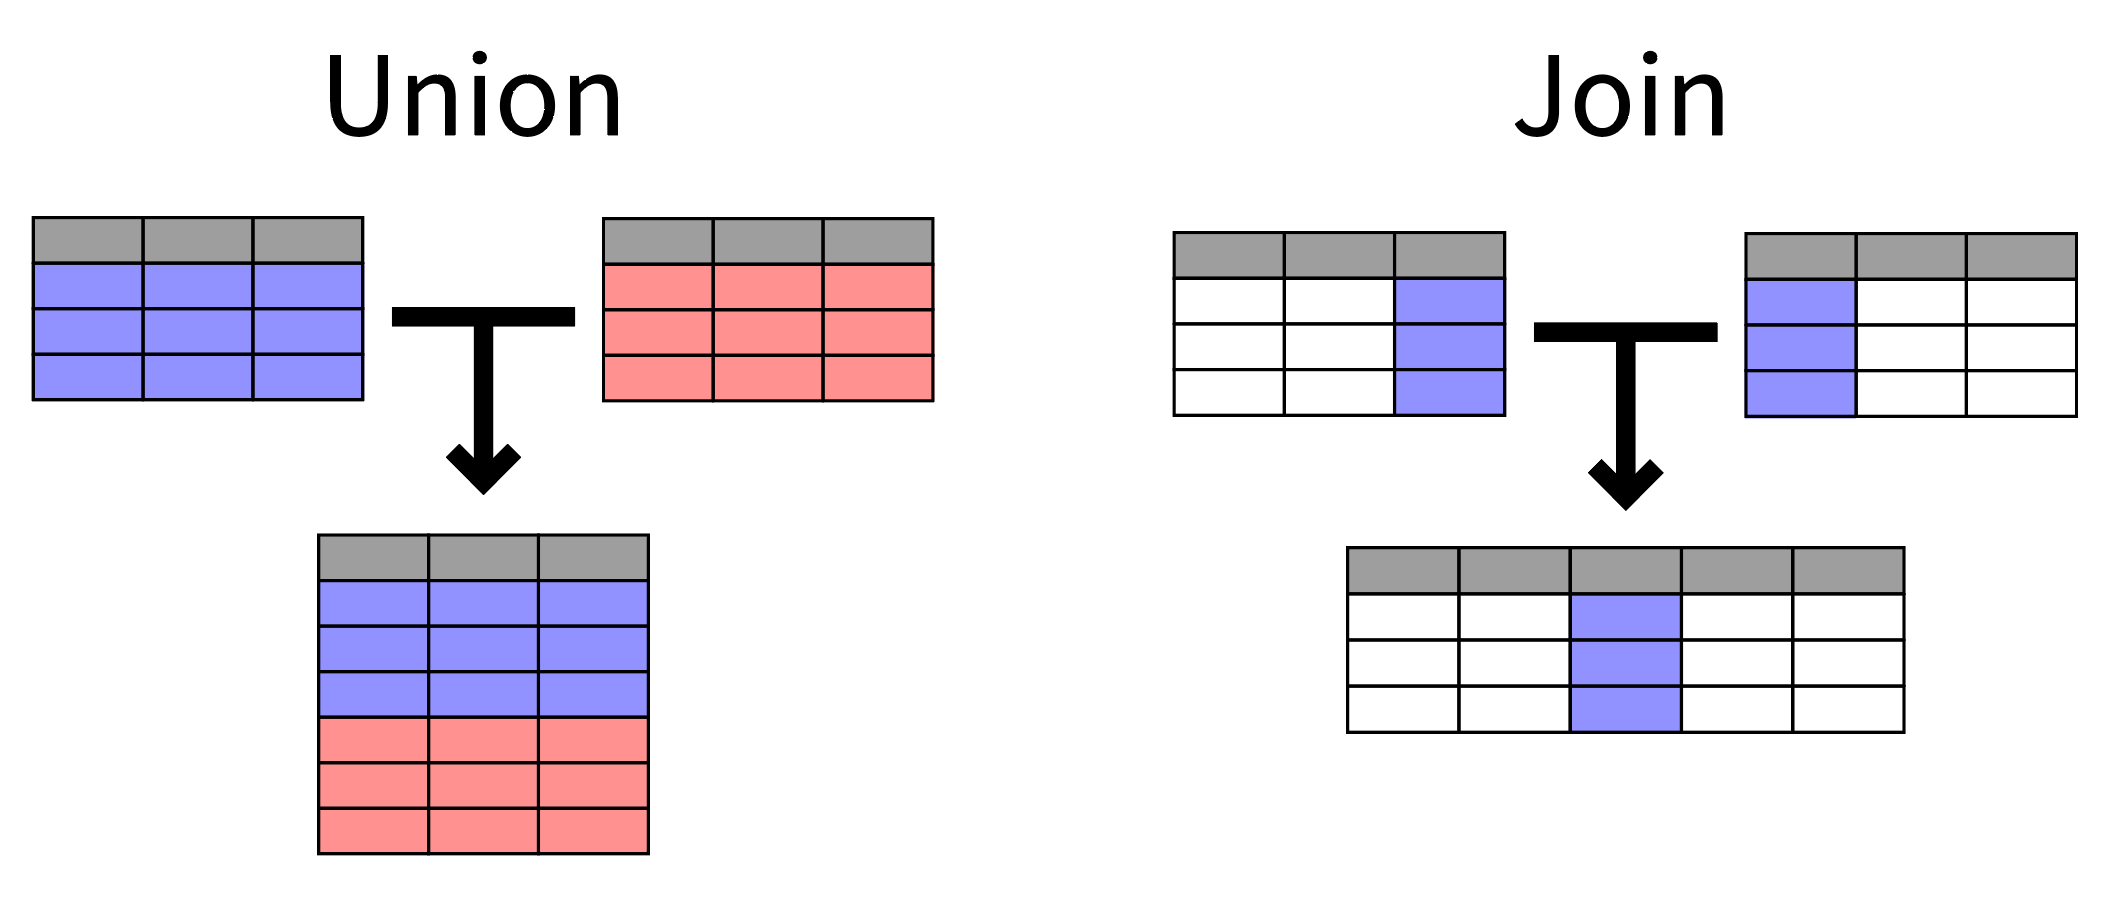
Let’s union our new flight records onto the **FLIGHTS** table.
1. Navigate to the **New Flight Data** page.
2. In the **Add element** bar, select **Data** > **Table** > **Union**.
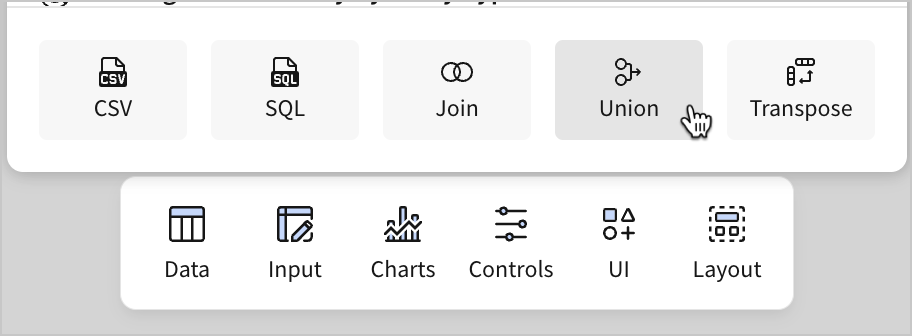
3. In the **Select source** modal, select the **New Flight Entries** table, and then click **Select**.
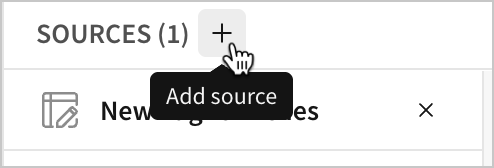
4. In the **Create union** screen, select **Add source**.
5. Select the **FLIGHTS** table.
6. Select the matching columns from each table so that the records are in line with one another in the final table.
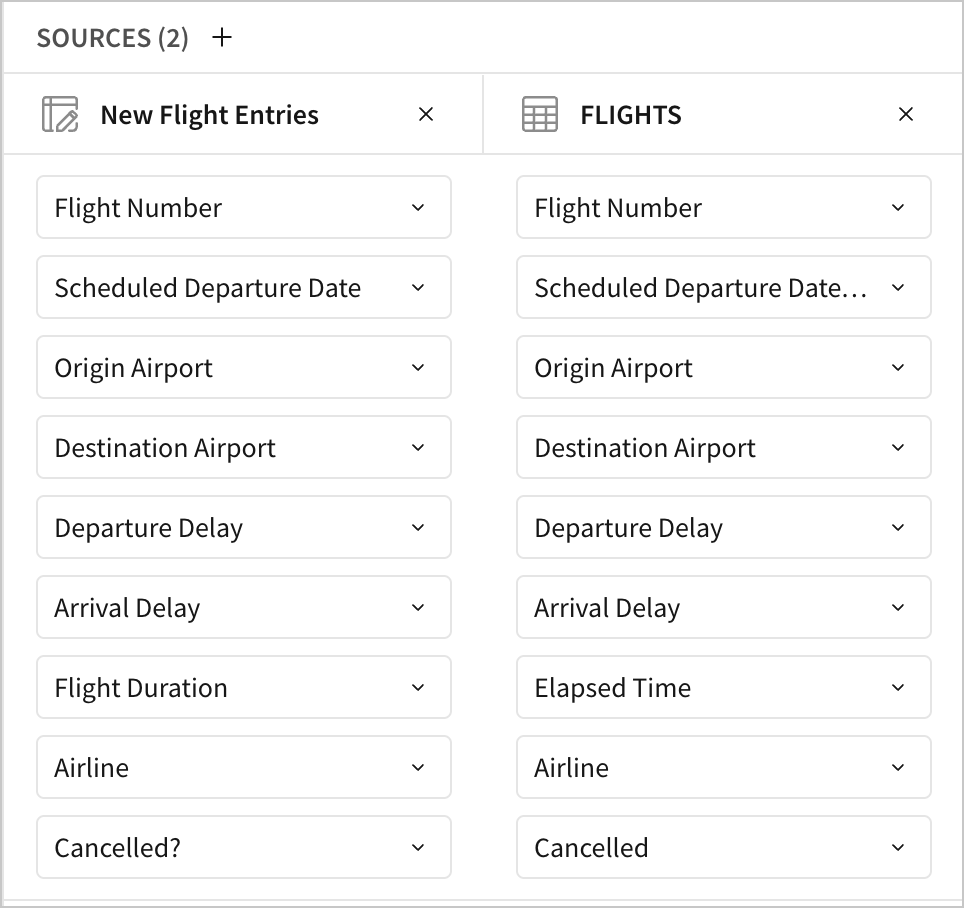
7. Click **Done**.
A new table titled **Union of 2 Sources** appears.
8. Rename the table **FLIGHTS + Entries**.
This new table contains all records from our original **FLIGHTS** table along with the records users enter via the **New Flight Entry** modal. We can verify this in a couple different ways to check for accuracy.
For example, we might filter the new table to just the flight number of the example we entered when testing the New Flight Entry modal. If configured correctly, the new record appears in the filtered table.
Or we can observe that the table summary for the new table has a higher record count than the original **FLIGHTS** table. It has one more record, which is the test record we entered.
Now, let’s finish the setup by updating our charts to use this new table as their data source.
1. Navigate to the **Departure Delay vs Arrival Delay** table.
2. Select the bar chart **Average of Departure and Arrival Delay by Airline**.
3. In the editor panel, click
**More** > **Add condition**.
2. Use the following formula:
```
IsNotNull([airline-entry]) and IsNotNull([scheduled-departure-date-entry]) and IsNotNull([origin-airport-entry]) and IsNotNull([departure-delay-entry]) and IsNotNull([destination-airport-entry]) and IsNotNull([arrival-delay-entry]) and IsNotNull([flight-number-entry]) and IsNotNull([flight-duration-entry])
```

#### Why require all values?
At first, it might seem unnecessary to check that all fields are populated before making a new record. But consider the alternative. What would happen if we allowed any set of the controls to be blank, resulting in a null value for that field?
We’d have to:
* Handle null values in every filter and condition we’ve previously configured
* Handle null values for calculations - either exclude them from averages or indicate to users that they might impact averages
* Justify that this extra labor is worth it to handle incomplete records. What value do we gain from getting the arrival delay for a flight with no listed airline or airports?
Only allowing complete records is one way to minimize the amount of extra work we do downstream.
3. Add a second action to the same action sequence to clear all the controls in the **New Flight Entry** modal after you’ve created the new row. This way, the controls automatically clear after a new row is successfully created.

4. In the **Action sequence** with an **On click - secondary** trigger, click **Add action**.
5. Configure a **Clear control** action to clear all controls in the **New Flight Entry** modal.

We can now test the workflow. We can set control values like this:

And when we click **Create Entry**, the values appear in the input table like this:

1. Navigate to the **Departure Delay vs Arrival Delay** page.
2. Add a new button element and rename it **Enter Flight**.

3. Select the button, and add an action to the **Action sequence** triggered **On click** to open the **New Flight Entry** modal.
At this point, we’ve created a system where users can open a modal, enter information about a flight, and click a button to enter that information into a new table. However, none of that information is reflected in our charts and graphs yet. The next section introduces a method to implement that functionality.
## Union new records to our data
One way we could update our charts each time a new entry is created is to change the data source all of our charts are connected to. If we were to replace the current **FLIGHTS** table with a new table that contains all of the records from **FLIGHTS** as well as new entries, then the new records would appear in charts, summaries, and calculations after they’re added.
We can accomplish this with a union. Similar to a join, a union is a way of combining data from multiple tables. However, there’s a key difference. Whereas a join combines columns from multiple tables to make a wider table, a union combines records from multiple tables to create a longer table.

Let’s union our new flight records onto the **FLIGHTS** table.
1. Navigate to the **New Flight Data** page.
2. In the **Add element** bar, select **Data** > **Table** > **Union**.

3. In the **Select source** modal, select the **New Flight Entries** table, and then click **Select**.
4. In the **Create union** screen, select **Add source**.

5. Select the **FLIGHTS** table.
6. Select the matching columns from each table so that the records are in line with one another in the final table.

7. Click **Done**.
A new table titled **Union of 2 Sources** appears.
8. Rename the table **FLIGHTS + Entries**.
This new table contains all records from our original **FLIGHTS** table along with the records users enter via the **New Flight Entry** modal. We can verify this in a couple different ways to check for accuracy.
For example, we might filter the new table to just the flight number of the example we entered when testing the New Flight Entry modal. If configured correctly, the new record appears in the filtered table.
Or we can observe that the table summary for the new table has a higher record count than the original **FLIGHTS** table. It has one more record, which is the test record we entered.
Now, let’s finish the setup by updating our charts to use this new table as their data source.
1. Navigate to the **Departure Delay vs Arrival Delay** table.
2. Select the bar chart **Average of Departure and Arrival Delay by Airline**.
3. In the editor panel, click  under **Data source**, and select **Change source…**.
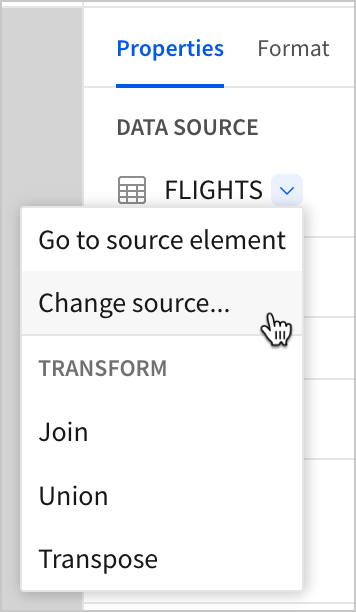
4. In the **Change source** modal, select the **FLIGHTS + New Entries** element as the new data source for the chart.
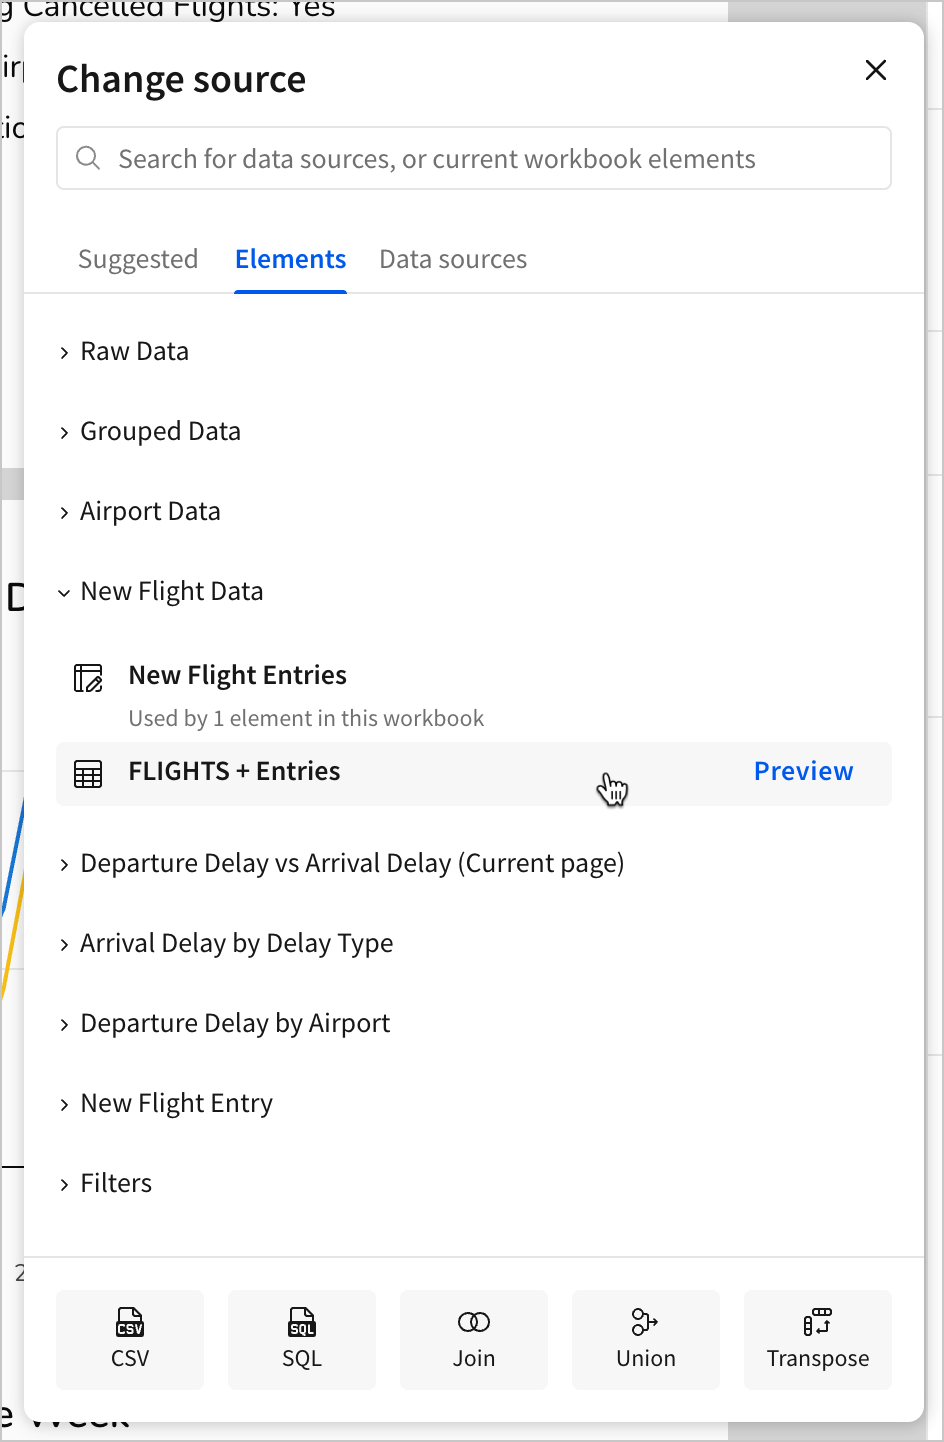
The table refreshes, but nothing changes. This is because the new data source is not sufficiently different from the old one to have a visible impact on the chart.
5. Click the **Enter Flight** button.
6. In the **New Flight Entry** modal, enter the following details for a flight:
* Airline - DL
* Origin Airport - BOS
* Destination Airport - JFK
* Flight Number - 1234568
* Scheduled Departure Date - 05/01/2015
* Departure Delay - 10
* Arrival Delay - -2000000
* Flight Duration - 66
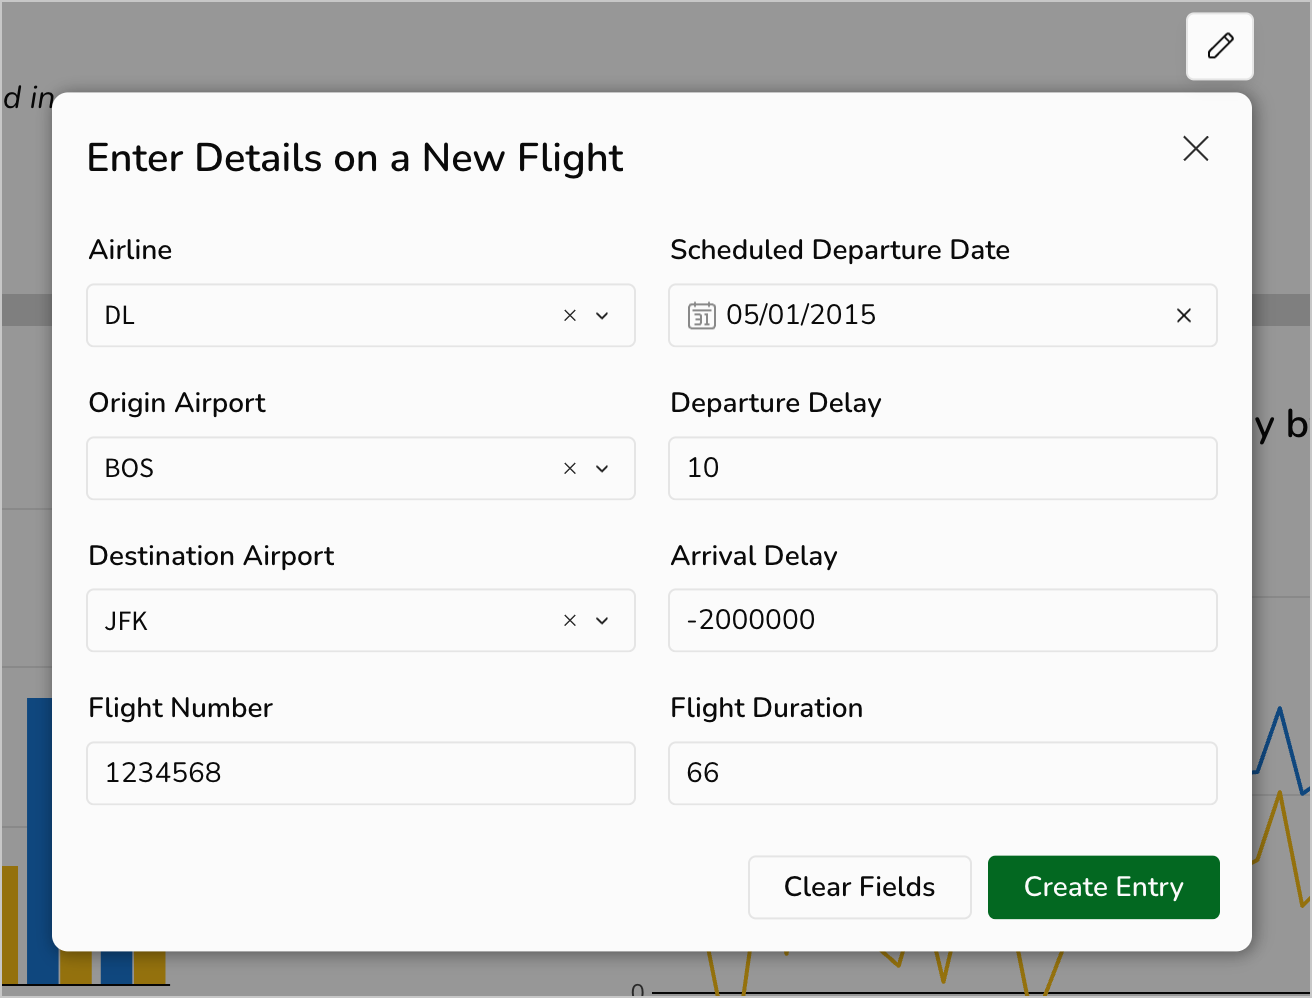
7. Click **Create Entry**.
The bar chart updates, and `DL` now has a negative **Average of Arrival Delay**.
Note that no flight could be two million minutes early. This is an extreme example, intended to demonstrate that the bar chart is updating based on any new entry we make to the input table. We can go into the input table and delete the entry, and `DL` returns to its previous, more realistic arrival delay average.
8. To complete this lesson, update the rest of the elements on this page to use the new unioned table as their data source, including:
* Both KPI elements at the top of the page
* The line chart
* Both pivot tables
Additionally, consider how you might update the other pages in the workbook to utilize this new table:
* What would happen if we update the filters in the **Filters** modal to target the unioned table?
* How would we reflect these updates in the **Arrival Delay by Delay Type** page?
There’s no single correct answer to these design questions. For example, you might decide it isn’t worth the effort to reflect these updates on every page in the workbook. Or, you might expand the **New Flight Entry** modal with new controls so that users can enter the entire delay type breakdown where appropriate.
## Conclusion
Try your hand at answering the questions above if you’d like to experiment. Otherwise, this is the end of the tutorial.
Hopefully, this course has helped you build an intuition for how you might go about solving these problems, as well as other tasks, in Sigma.
We’ve covered everything from creating your first workbook, all the way up to designing an intuitive user experience with live data entry. Along the way, we’ve tried out some core design patterns in Sigma, and considered how we could apply those designs in multiple contexts.
Now, try applying these principles to your organization’s data and use cases.
Happy calculating!
under **Data source**, and select **Change source…**.

4. In the **Change source** modal, select the **FLIGHTS + New Entries** element as the new data source for the chart.

The table refreshes, but nothing changes. This is because the new data source is not sufficiently different from the old one to have a visible impact on the chart.
5. Click the **Enter Flight** button.
6. In the **New Flight Entry** modal, enter the following details for a flight:
* Airline - DL
* Origin Airport - BOS
* Destination Airport - JFK
* Flight Number - 1234568
* Scheduled Departure Date - 05/01/2015
* Departure Delay - 10
* Arrival Delay - -2000000
* Flight Duration - 66

7. Click **Create Entry**.
The bar chart updates, and `DL` now has a negative **Average of Arrival Delay**.
Note that no flight could be two million minutes early. This is an extreme example, intended to demonstrate that the bar chart is updating based on any new entry we make to the input table. We can go into the input table and delete the entry, and `DL` returns to its previous, more realistic arrival delay average.
8. To complete this lesson, update the rest of the elements on this page to use the new unioned table as their data source, including:
* Both KPI elements at the top of the page
* The line chart
* Both pivot tables
Additionally, consider how you might update the other pages in the workbook to utilize this new table:
* What would happen if we update the filters in the **Filters** modal to target the unioned table?
* How would we reflect these updates in the **Arrival Delay by Delay Type** page?
There’s no single correct answer to these design questions. For example, you might decide it isn’t worth the effort to reflect these updates on every page in the workbook. Or, you might expand the **New Flight Entry** modal with new controls so that users can enter the entire delay type breakdown where appropriate.
## Conclusion
Try your hand at answering the questions above if you’d like to experiment. Otherwise, this is the end of the tutorial.
Hopefully, this course has helped you build an intuition for how you might go about solving these problems, as well as other tasks, in Sigma.
We’ve covered everything from creating your first workbook, all the way up to designing an intuitive user experience with live data entry. Along the way, we’ve tried out some core design patterns in Sigma, and considered how we could apply those designs in multiple contexts.
Now, try applying these principles to your organization’s data and use cases.
Happy calculating!