> For clean Markdown of any page, append .md to the page URL.
> For a complete documentation index, see https://help.sigmacomputing.com/llms.txt.
> For AI client integration (Claude Code, Cursor, etc.), connect to the MCP server at https://help.sigmacomputing.com/_mcp/server.
# Format chart axis position
> Format Sigma chart axis position to move y-axes or add second axes and build dual-axis charts that compare multiple series.
You can change the position of the y-axis on a chart or add a second y-axis. For horizontal charts, you can add a second x-axis or change the position of the x-axis instead. This allows you to create dual-axis charts and charts with a single shared axis in order to customize how you display data from two different series on the same chart.
Formatting the chart axis is available for the following visualization types:
* [Bar charts](/docs/build-a-bar-chart)
* [Box and whisker charts](/docs/box-and-whisker-charts)
* [Combo charts](/docs/combo-charts)
* [Line charts](/docs/build-a-line-chart)
* [Scatter plots](/docs/build-a-scatter-plot)
* [Waterfall charts](/docs/build-a-waterfall-chart)
## User requirements
* To use this feature, you must have **Can edit** or **Can explore** [access](/docs/folder-and-document-permissions) to the individual workbook.
* You must be in a draft, custom view, or saved view of the workbook.
## Change the position of the chart axis
After adding at least one column to the y-axis (for vertical charts) or the x-axis (for horizontal charts), you can change the position of the axis.
1. Select the desired chart on the page canvas and ensure **Properties** is selected on the editor panel.
2. In the editor panel, hover over the desired y-axis or x-axis column name and click the down arrow ( ) to open the column menu.
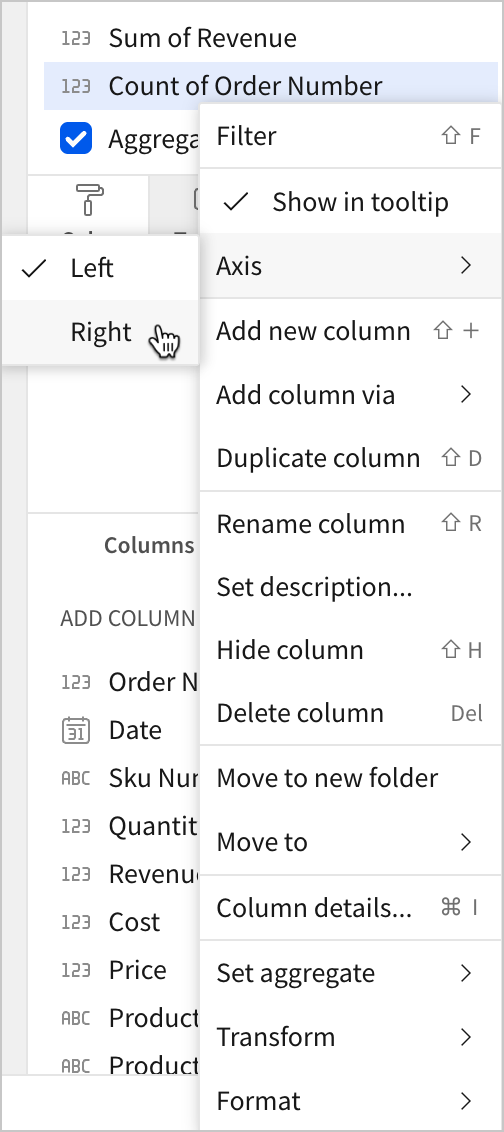
3. In the column menu, hover over **Axis** and select **Left** or **Right**.
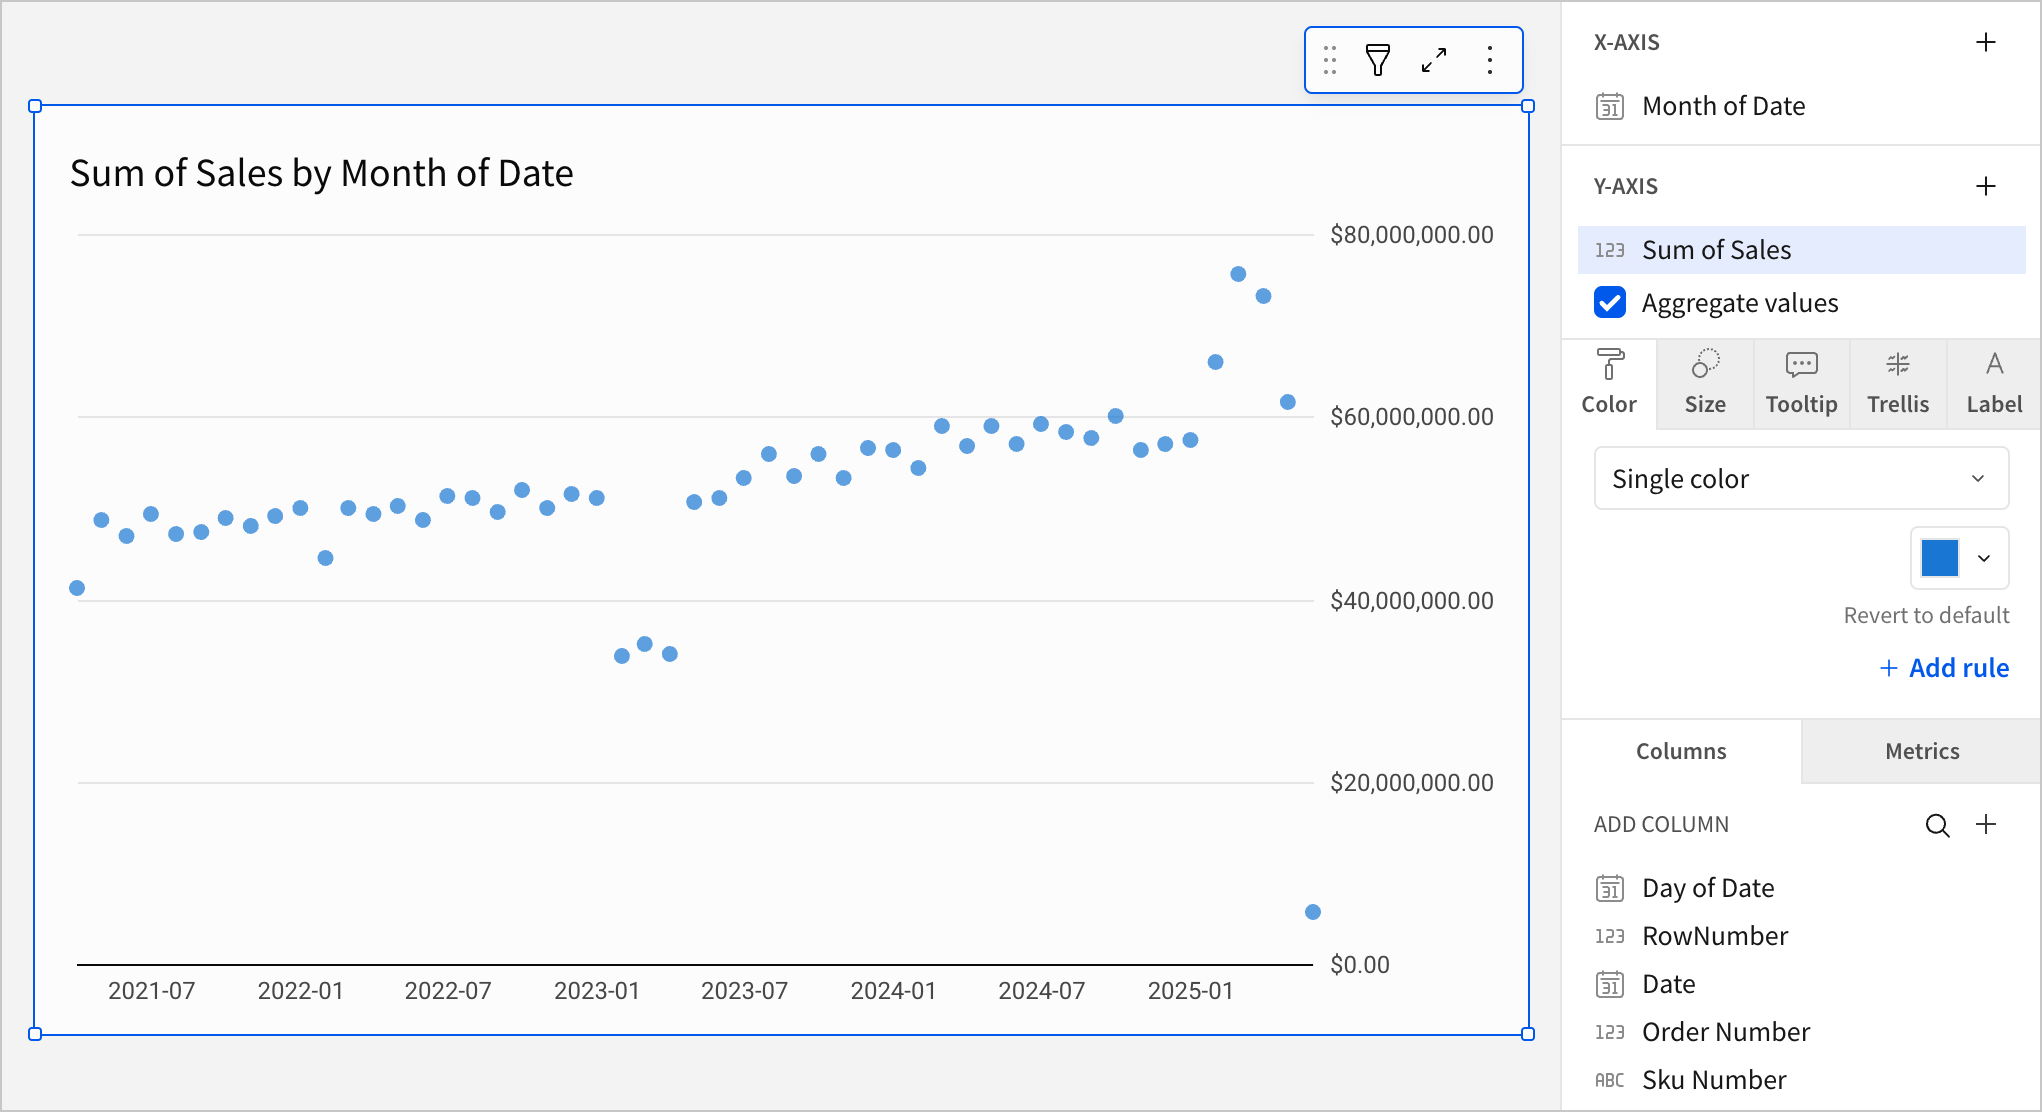
The chart updates with the axis in the new position.
## Add a second chart axis
For charts that visualize at least two columns on the y-axis (for vertical charts) or the x-axis (for horizontal charts), you can add a second chart axis.
1. Select the desired chart on the workbook page and ensure **Properties** is selected in the editor panel.
2. In the editor panel, hover over the desired y-axis or x-axis column name, then click the down arrow () to open the column menu.
3. In the column menu, hover over **Axis** and select **Left** or **Right**.
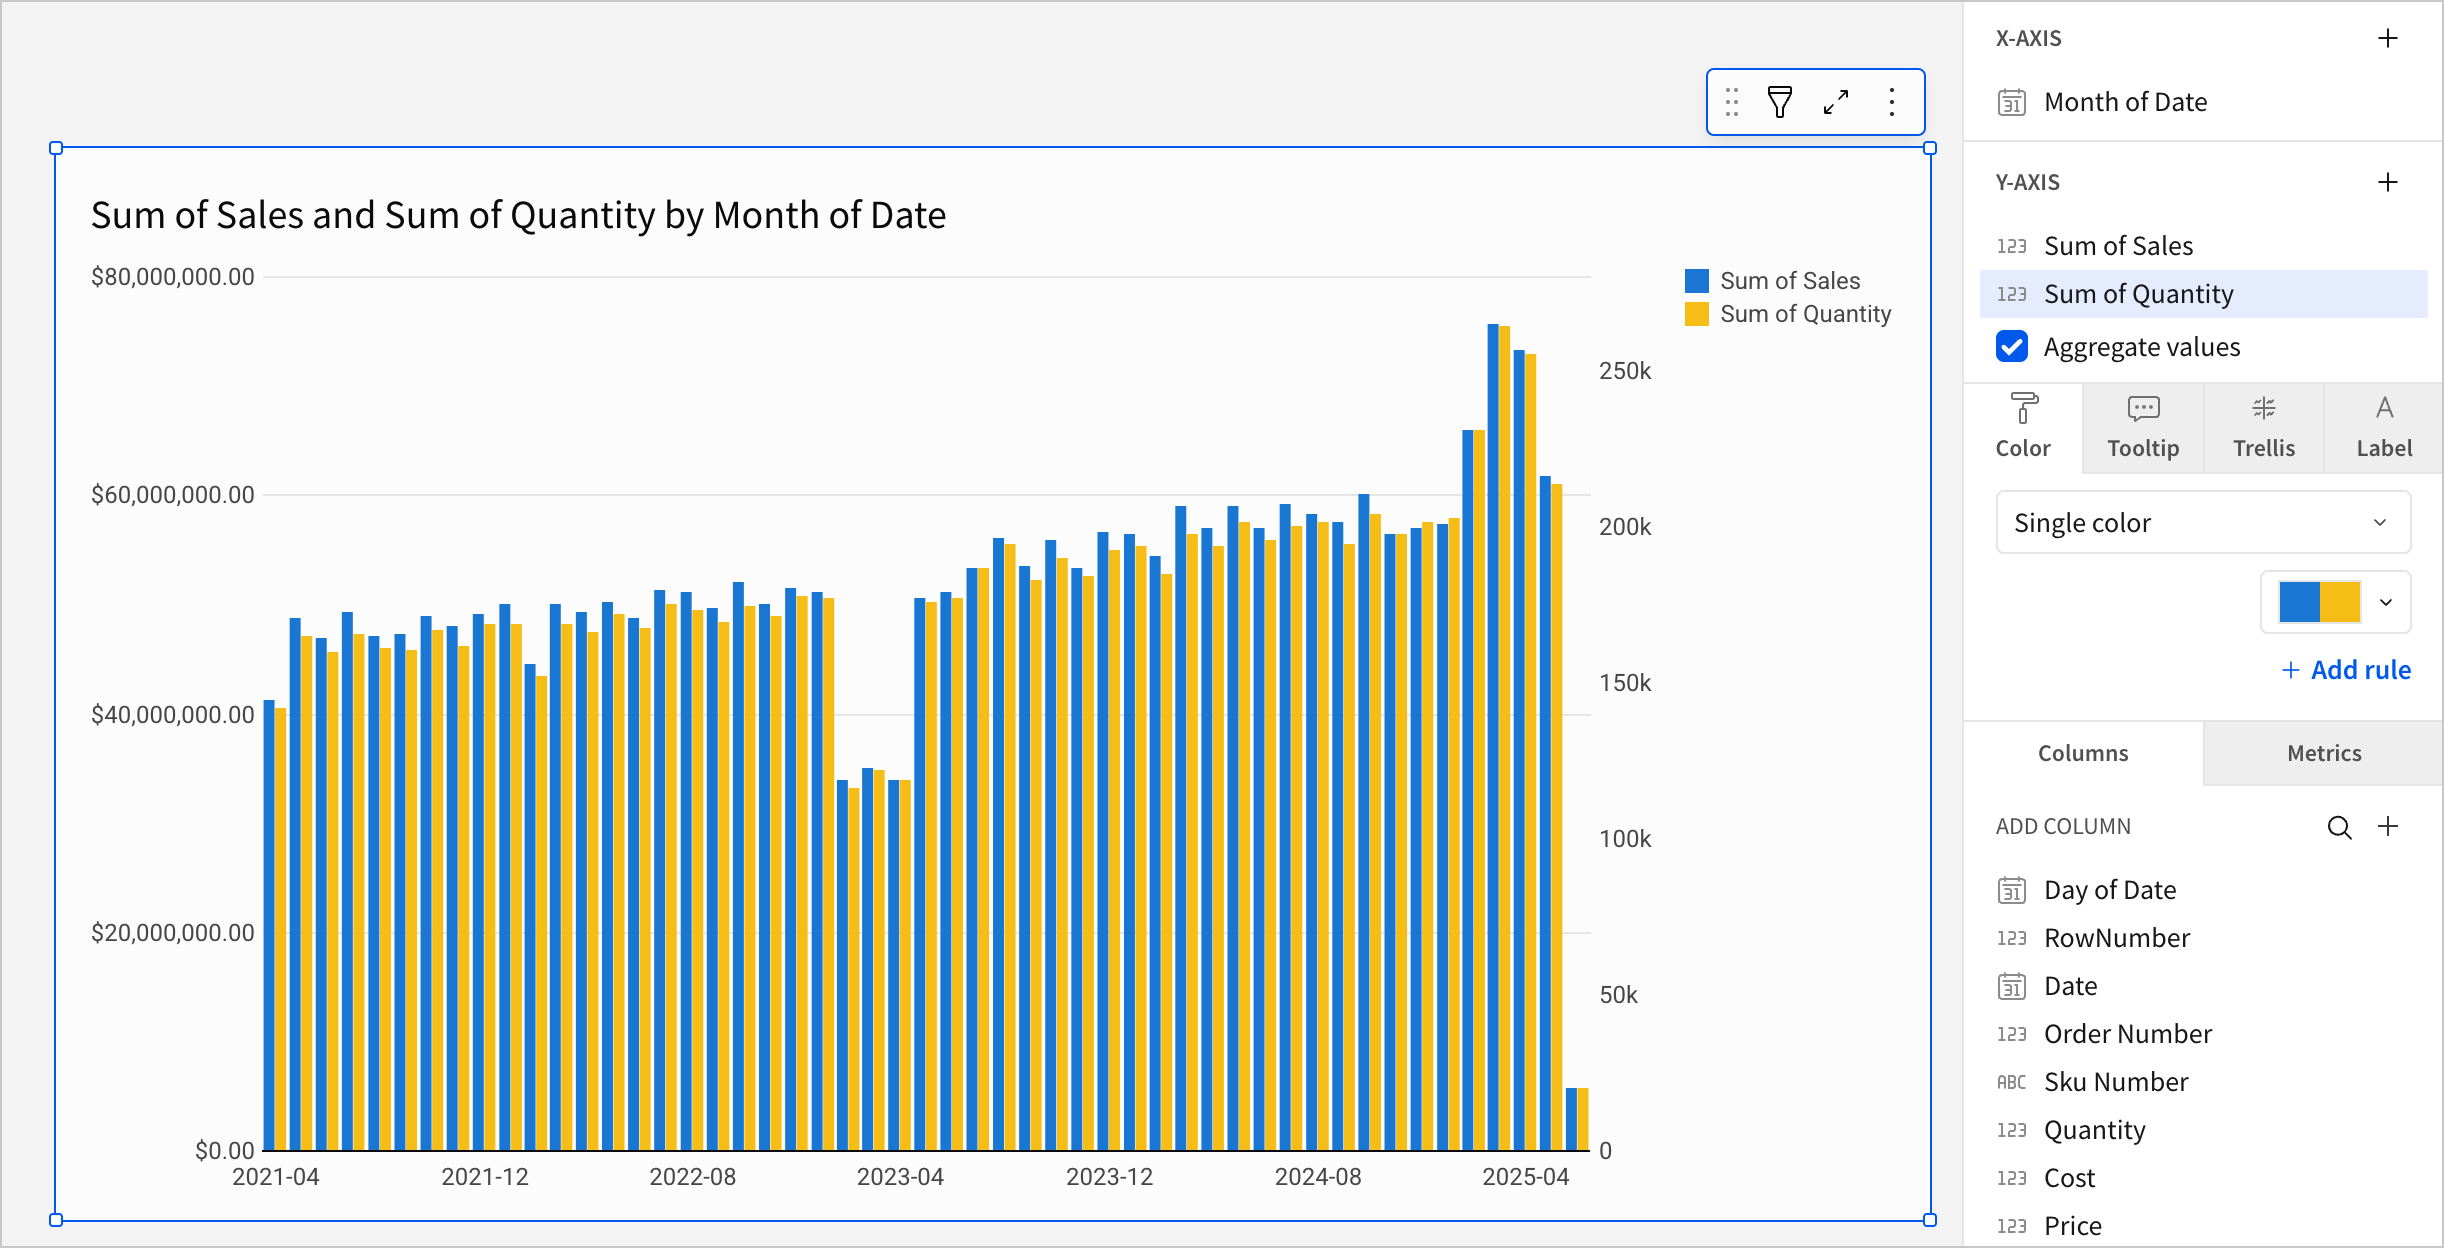
The chart updates to show a second y-axis.
) to open the column menu.
3. In the column menu, hover over **Axis** and select **Left** or **Right**.

The chart updates with the axis in the new position.

## Add a second chart axis
For charts that visualize at least two columns on the y-axis (for vertical charts) or the x-axis (for horizontal charts), you can add a second chart axis.
1. Select the desired chart on the workbook page and ensure **Properties** is selected in the editor panel.
2. In the editor panel, hover over the desired y-axis or x-axis column name, then click the down arrow () to open the column menu.
3. In the column menu, hover over **Axis** and select **Left** or **Right**.
The chart updates to show a second y-axis.
