> For clean Markdown of any page, append .md to the page URL.
> For a complete documentation index, see https://help.sigmacomputing.com/llms.txt.
> For AI client integration (Claude Code, Cursor, etc.), connect to the MCP server at https://help.sigmacomputing.com/_mcp/server.
# Drill down into data
Sigma supports drilling down or up into data using drill paths, also called drill anywhere, for most [chart types](/docs/intro-to-visualizations). With a drill path, you can explore your data ad hoc, viewing different slices of the data to identify patterns or themes.
Only users with **Can edit** or **Can explore** access to the workbook can drill up or down into a chart. If you want users with **Can view** access to be able to drill up or down into data, or you found a particular drill path to be useful and you want to use it across multiple charts, create a [drill down control](/docs/drill-down-control) instead.
## Requirements
* To use [drill anywhere](#drill-anywhere-in-a-chart), you must have **Can edit** or **Can explore** [access](/docs/folder-and-document-permissions) to the workbook.
* To [customize the drill down column list](#customize-the-drill-down-column-list-for-a-chart) for a chart, you must have **Can edit** access.
## Drill anywhere in a chart
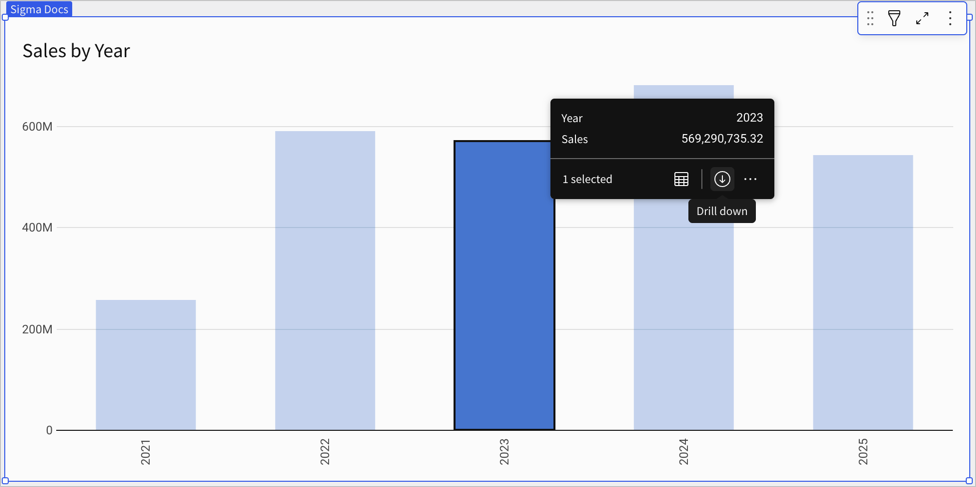
You can drill up or down in a chart to view different slices of the data. For example, if you view a bar chart that shows sales by year and want to explore how sales look split by store region instead, drill down in the chart.
1. Click a value on your chart to open the context menu, then click  (**Drill down**).
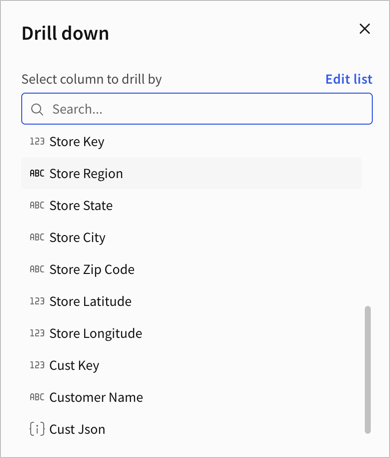
2. In the **Drill down** modal, select a column to drill into that data. For example, choose the *Store Region* column.
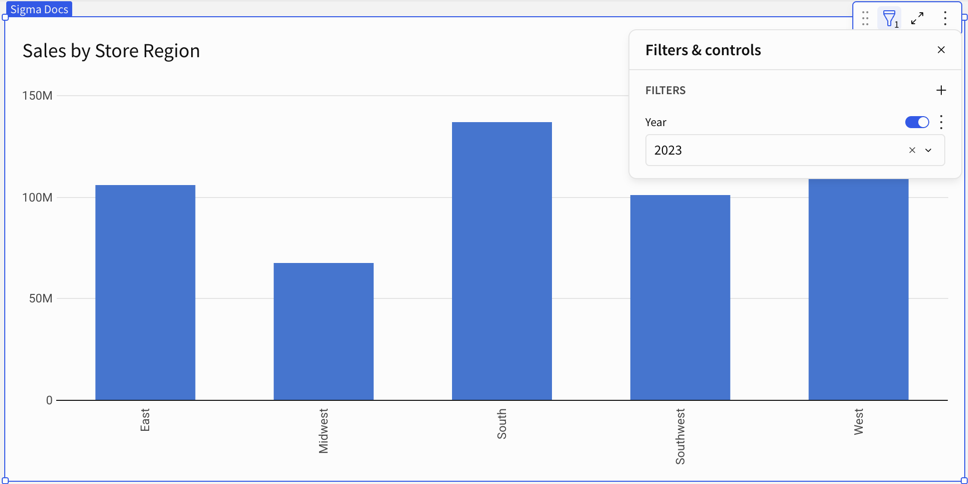
The chart changes to show the new data slice. For example, when drilling into *Store Region* for the *Year* 2023, Sigma adds a date filter and changes the **X-axis** value from *Year* to *Store Region*. The resulting chart shows the sum of sales by region for the year 2023:
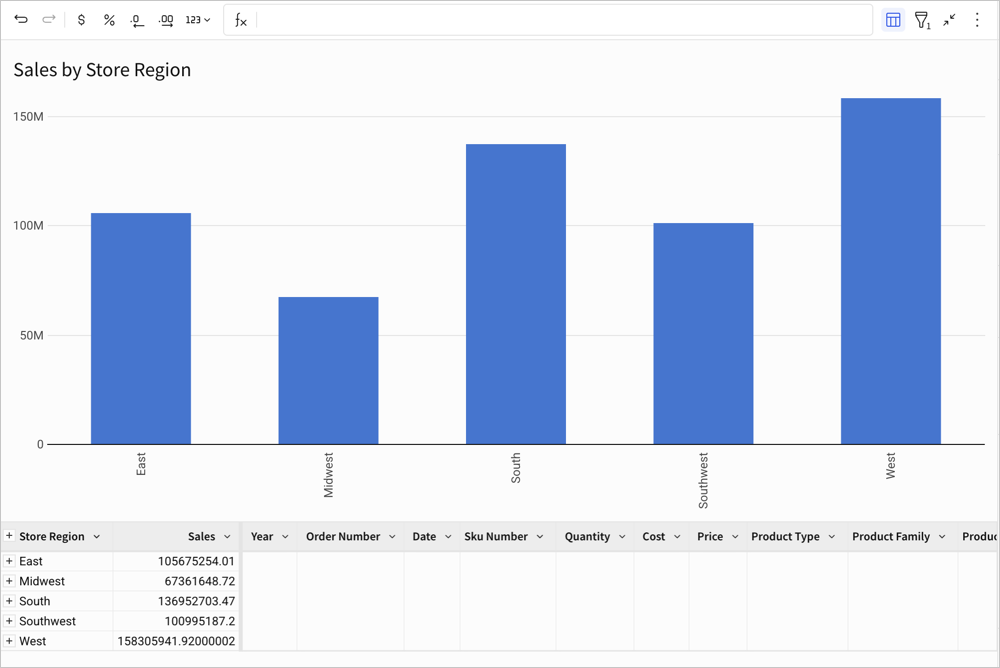
If you [maximize the chart](/docs/view-underlying-data), you can see the structure of the underlying data table updates accordingly. Instead of being grouped by *Year*, the data is now grouped by *Store Region*:
3. (Optional) After drilling down, you can select
(**Drill down**).

2. In the **Drill down** modal, select a column to drill into that data. For example, choose the *Store Region* column.

The chart changes to show the new data slice. For example, when drilling into *Store Region* for the *Year* 2023, Sigma adds a date filter and changes the **X-axis** value from *Year* to *Store Region*. The resulting chart shows the sum of sales by region for the year 2023:

If you [maximize the chart](/docs/view-underlying-data), you can see the structure of the underlying data table updates accordingly. Instead of being grouped by *Year*, the data is now grouped by *Store Region*:

3. (Optional) After drilling down, you can select  **Drill up** to return to the original chart structure.
## Customize the drill down column list for a chart
To focus the available columns for drill anywhere to specific ones, for example, to limit the list of columns to only those that make sense with the **X-axis** of the current chart, edit the column list:
1. Open the workbook for editing.
2. Click a value on your chart to open the context menu, then click (**Drill down**).
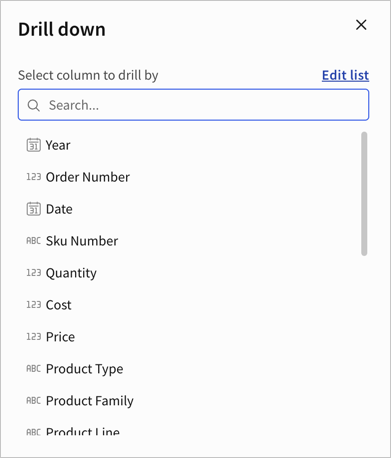
3. In the **Drill down** modal, click **Edit list**.
4. Use the checkboxes to select only the columns you want available. For example, deselect the checkbox for columns that might produce too many values to be viewed on the chart, or are otherwise not useful.
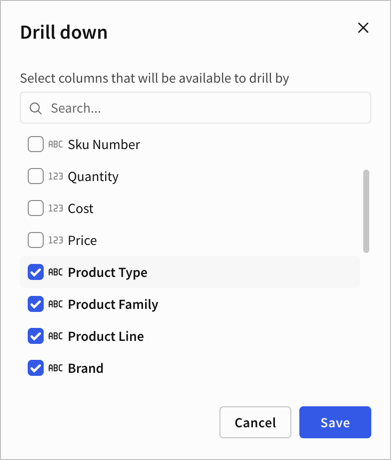
5. Click **Save** to return to the **Drill down** modal. The displayed options are limited to only the selected columns.
## Related resources
* [Intro to charts](/docs/intro-to-visualizations)
* [Filter data in data elements](/docs/data-element-filters)
* [Drill down control](/docs/drill-down-control)
**Drill up** to return to the original chart structure.
## Customize the drill down column list for a chart
To focus the available columns for drill anywhere to specific ones, for example, to limit the list of columns to only those that make sense with the **X-axis** of the current chart, edit the column list:
1. Open the workbook for editing.
2. Click a value on your chart to open the context menu, then click (**Drill down**).
3. In the **Drill down** modal, click **Edit list**.

4. Use the checkboxes to select only the columns you want available. For example, deselect the checkbox for columns that might produce too many values to be viewed on the chart, or are otherwise not useful.

5. Click **Save** to return to the **Drill down** modal. The displayed options are limited to only the selected columns.
## Related resources
* [Intro to charts](/docs/intro-to-visualizations)
* [Filter data in data elements](/docs/data-element-filters)
* [Drill down control](/docs/drill-down-control)