> For clean Markdown of any page, append .md to the page URL.
> For a complete documentation index, see https://help.sigmacomputing.com/llms.txt.
> For AI client integration (Claude Code, Cursor, etc.), connect to the MCP server at https://help.sigmacomputing.com/_mcp/server.
# Tutorial: Intro to data models
> Tutorial to guide users through creating data models, enabling business users to explore and analyze data from curated and constrained sources.
Data teams can create data models in Sigma to enable business users to explore and analyze data from curated and constrained sources, making analyses more efficient and easier to perform.
This step-by-step tutorial introduces you to data modeling in Sigma and walks you through creating a data model that joins and relates data from multiple sources so that it can be accessed and explored cohesively. It covers the basics of creating calculated columns, joining tables, forming relationships between tables, and granting access and sharing data models for exploration by business users. After completing this tutorial, you will have a working example of a data model that uses the **Sigma Sample Database** to model realistic sales data from several different data sources.
## User requirements
To complete the steps in this data modeling tutorial:
* You must be assigned an [account type](/docs/account-type-and-license-overview) with the **Create, edit, and publish data models** permissions enabled.
## Create a data model
Data models are documents in Sigma, like workbook, that allow you to share consistent, modeled data across multiple workbooks. After you create a data model, you can start adding data sources and begin to create downstream analyses with it.
Create a data model to use for this tutorial and add a data source that contains realistic sales data from the **Sigma Sample Database** you can model:
1. At the top of the home page, click **Create new** and select **Data model**.
A new data model opens.
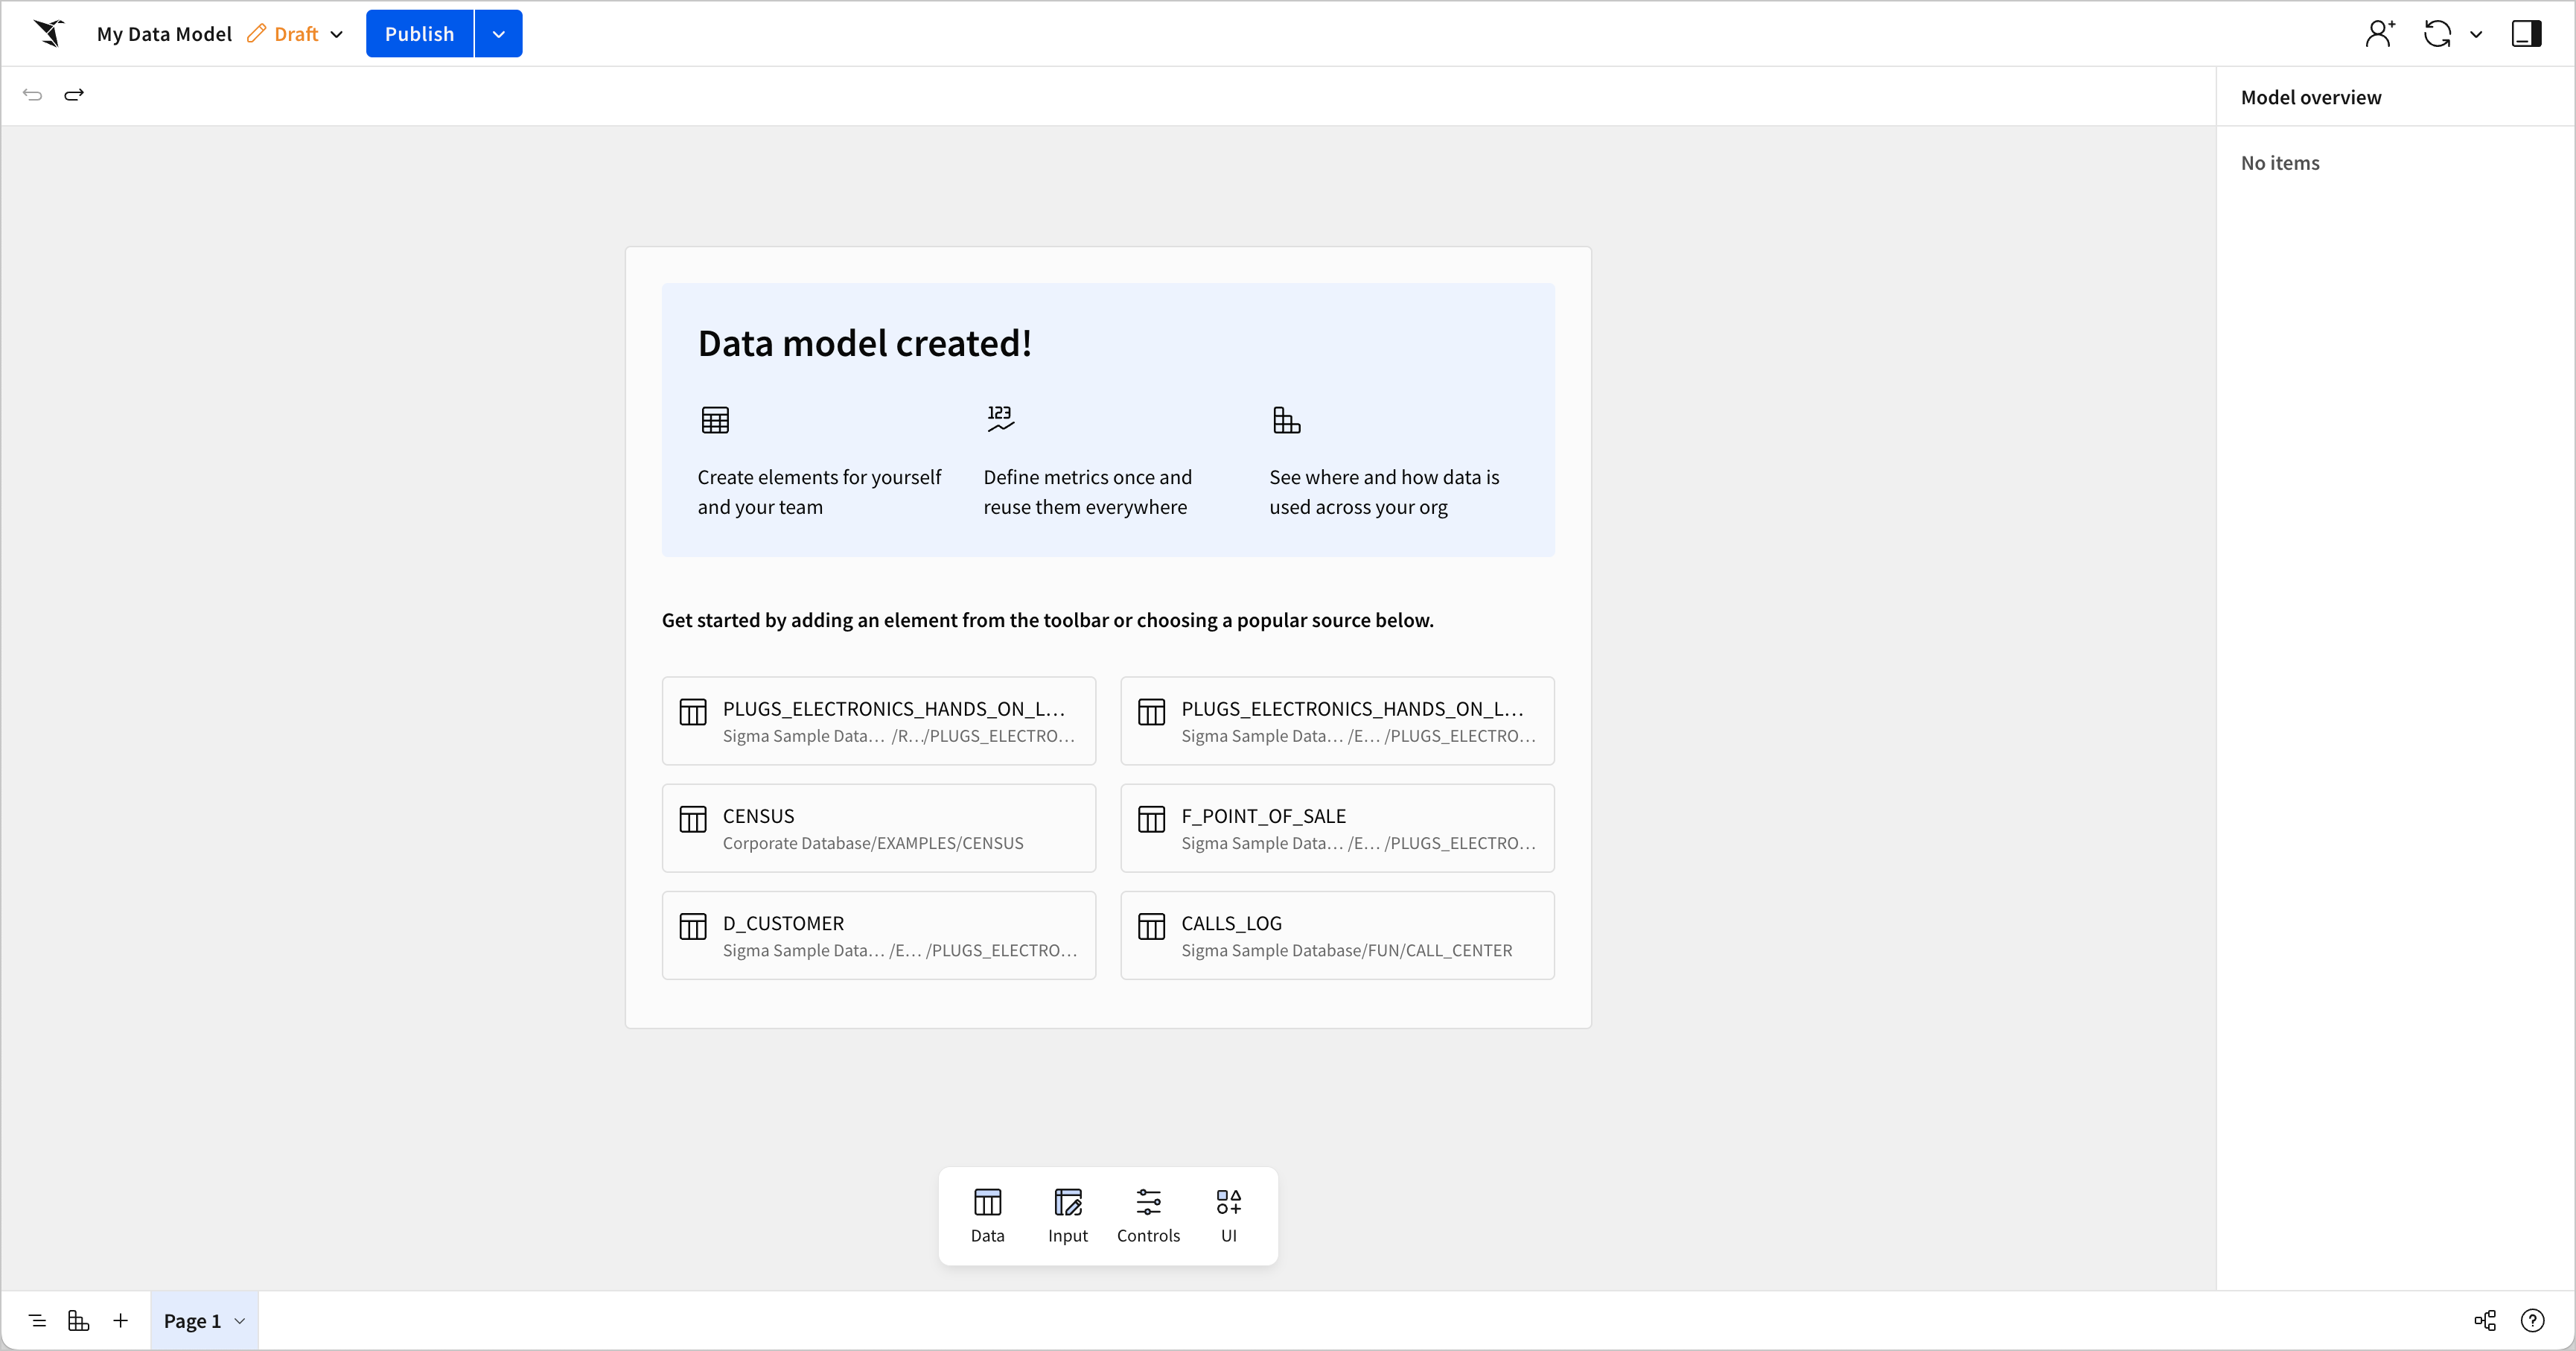
2. From the **Add element** bar, select **Data** > **Table**.
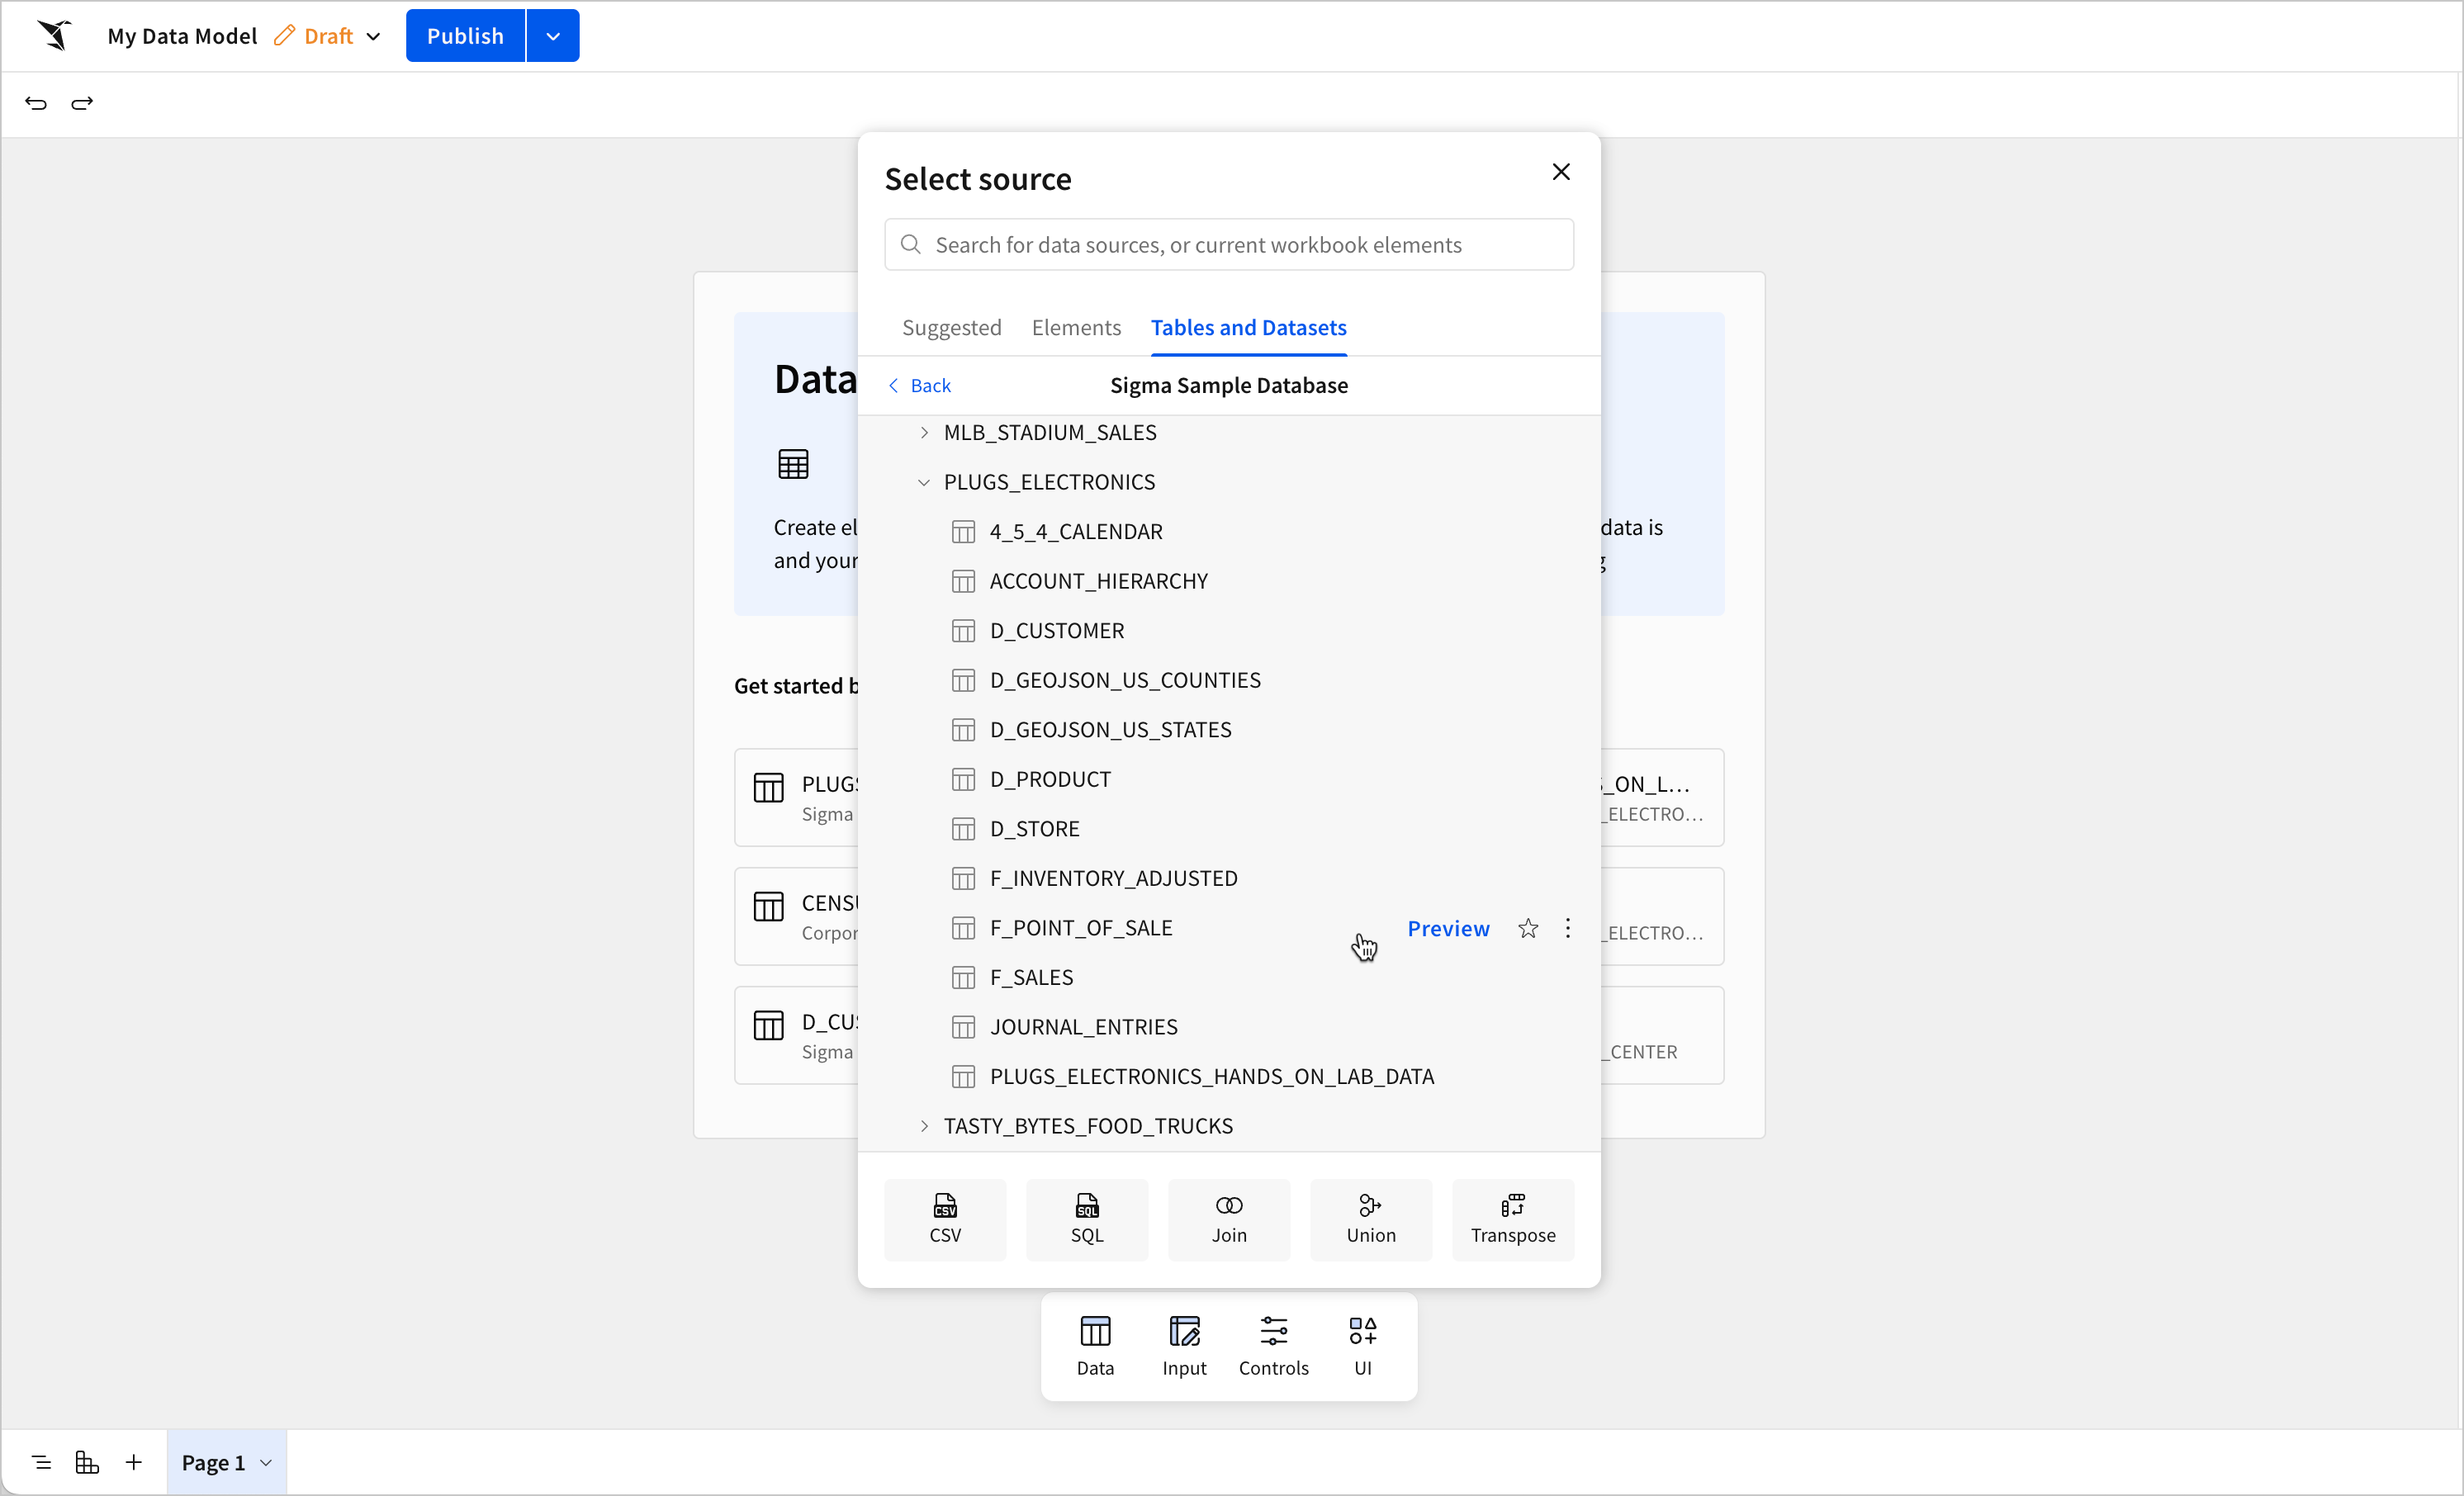
3. From the **Select source** modal, click **Connections** and then select the **Sigma Sample Database**.
4. Select the **RETAIL** > **PLUGS\_ELECTRONICS** > **F\_POINT\_OF\_SALE** table as your data source.
A table element containing the **F\_POINT\_OF\_SALE** data opens on the data model page.
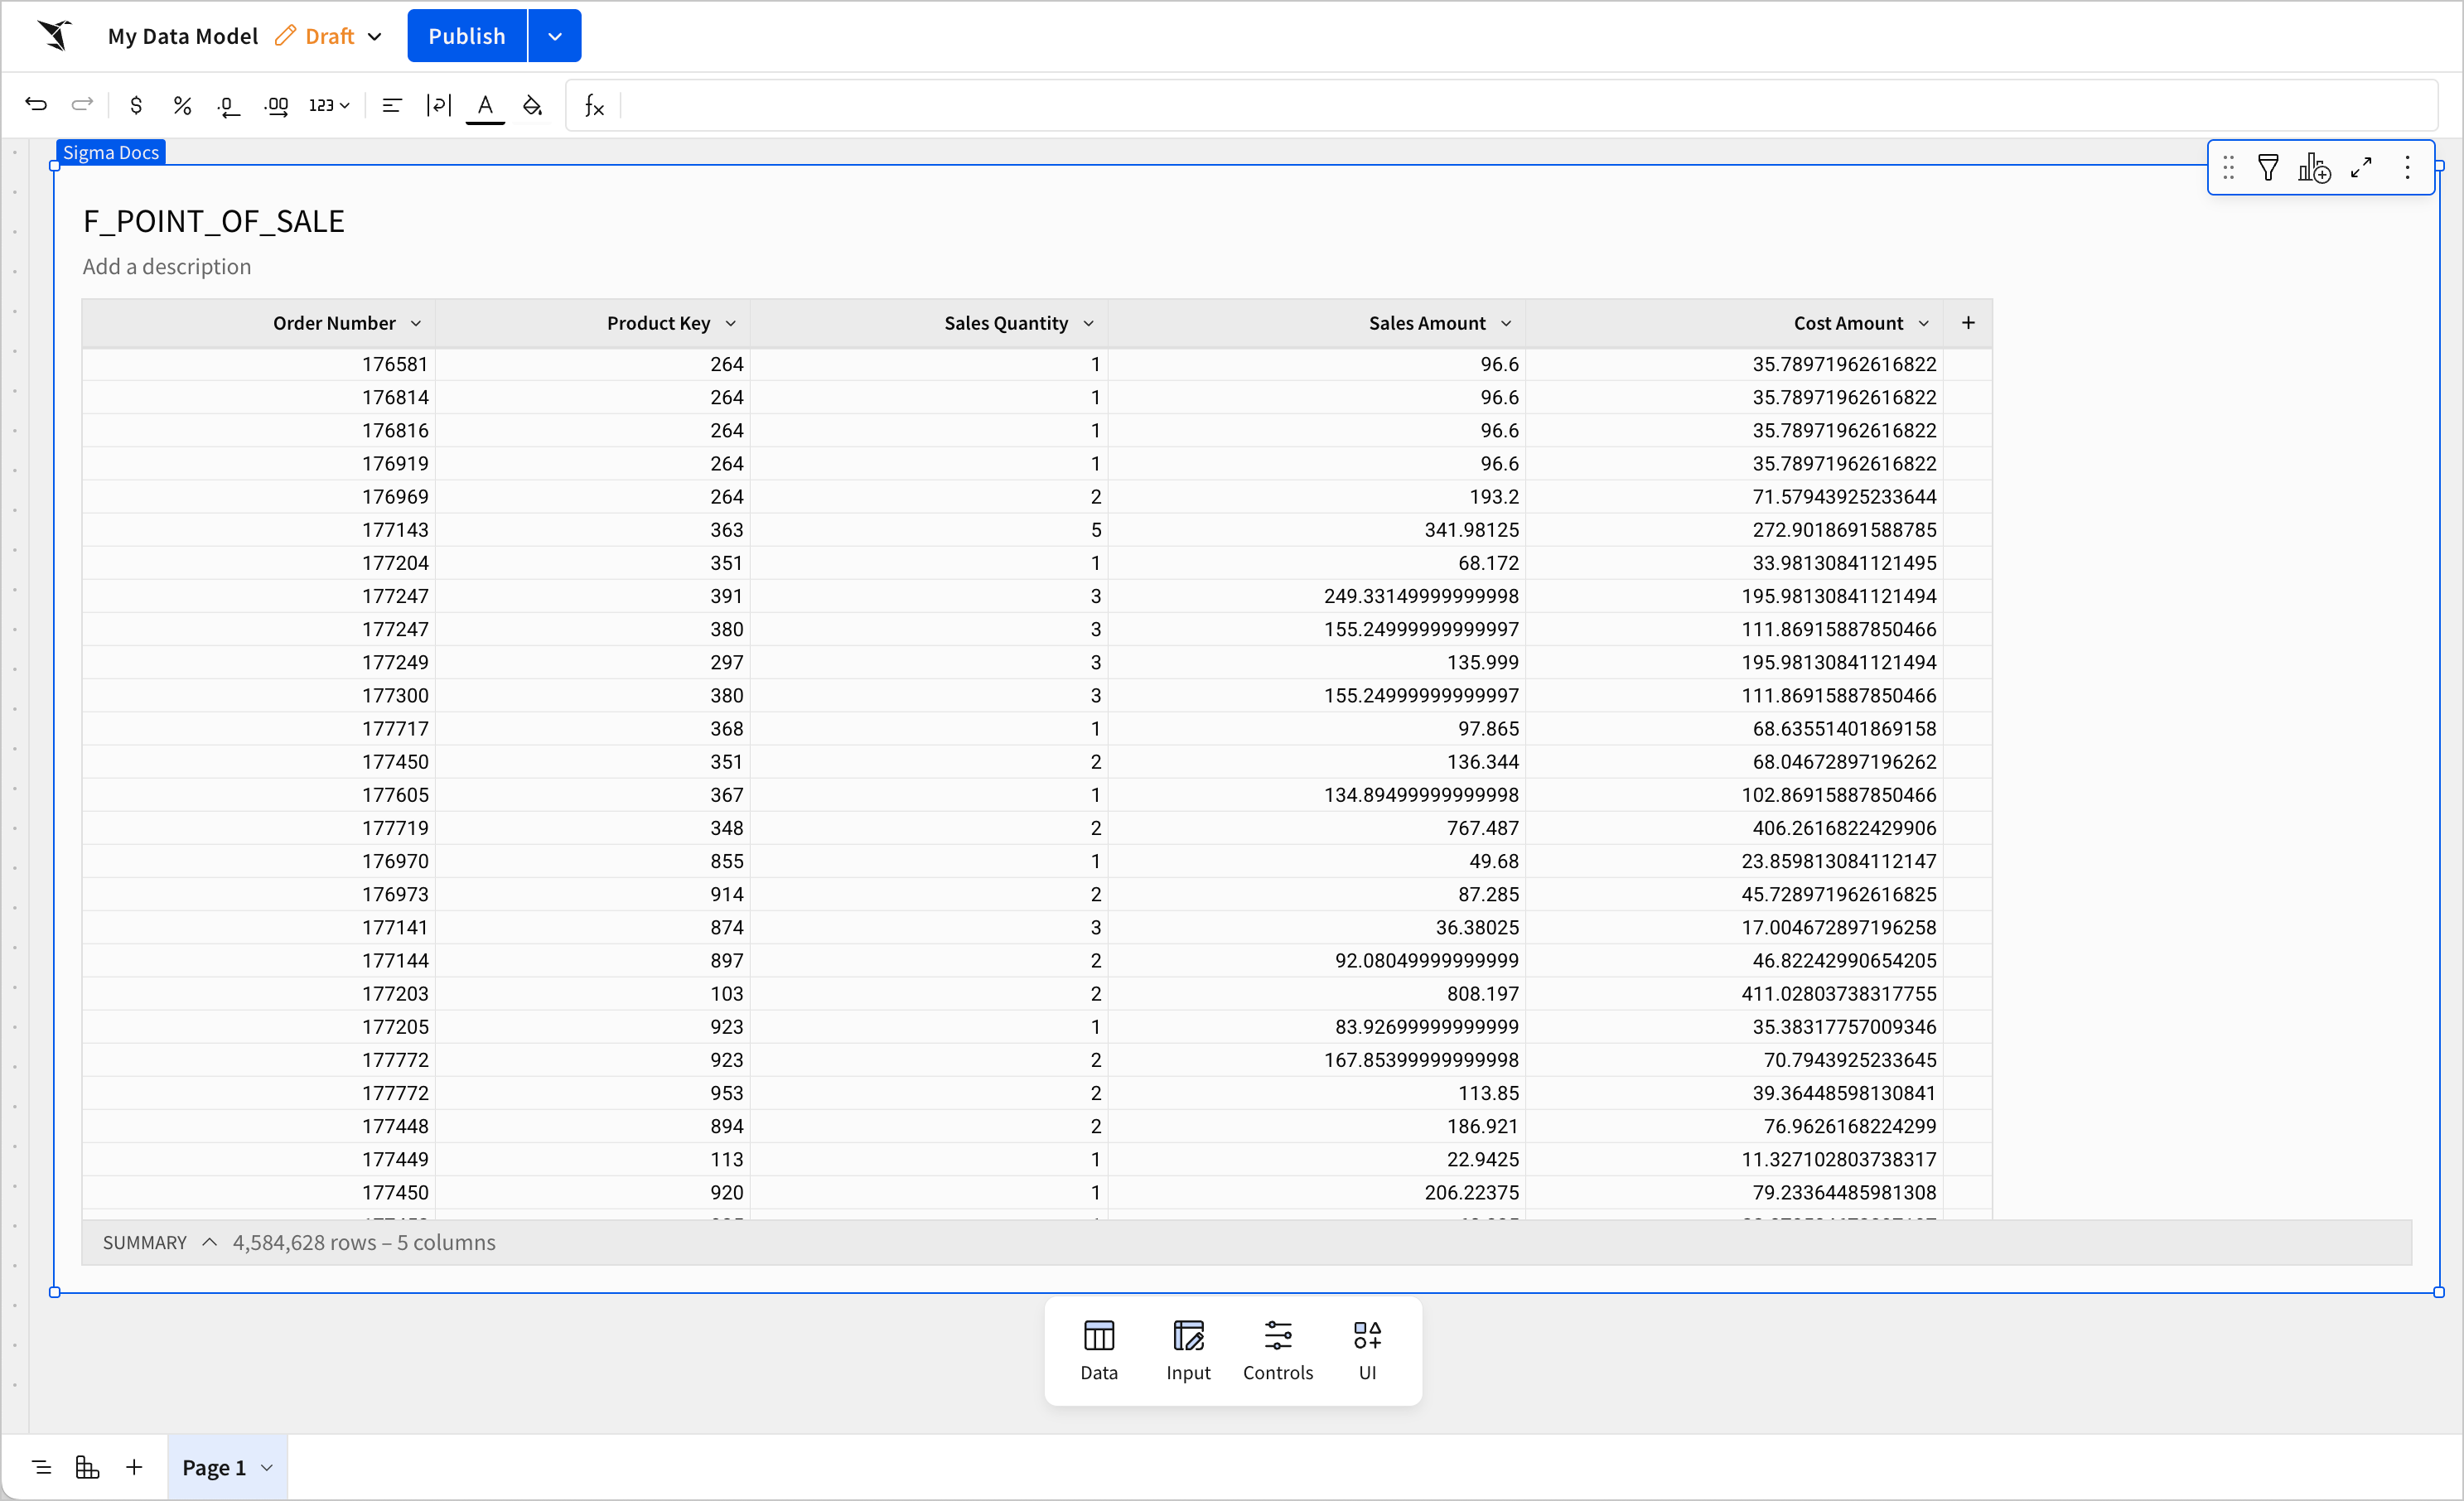
5. From the document menu, select **File** > **Rename** and rename the data model to `Data Modeling Tutorial`.
6. Click **Publish** and then select **Go to published version** from the **Publish** menu to see the data model overview.
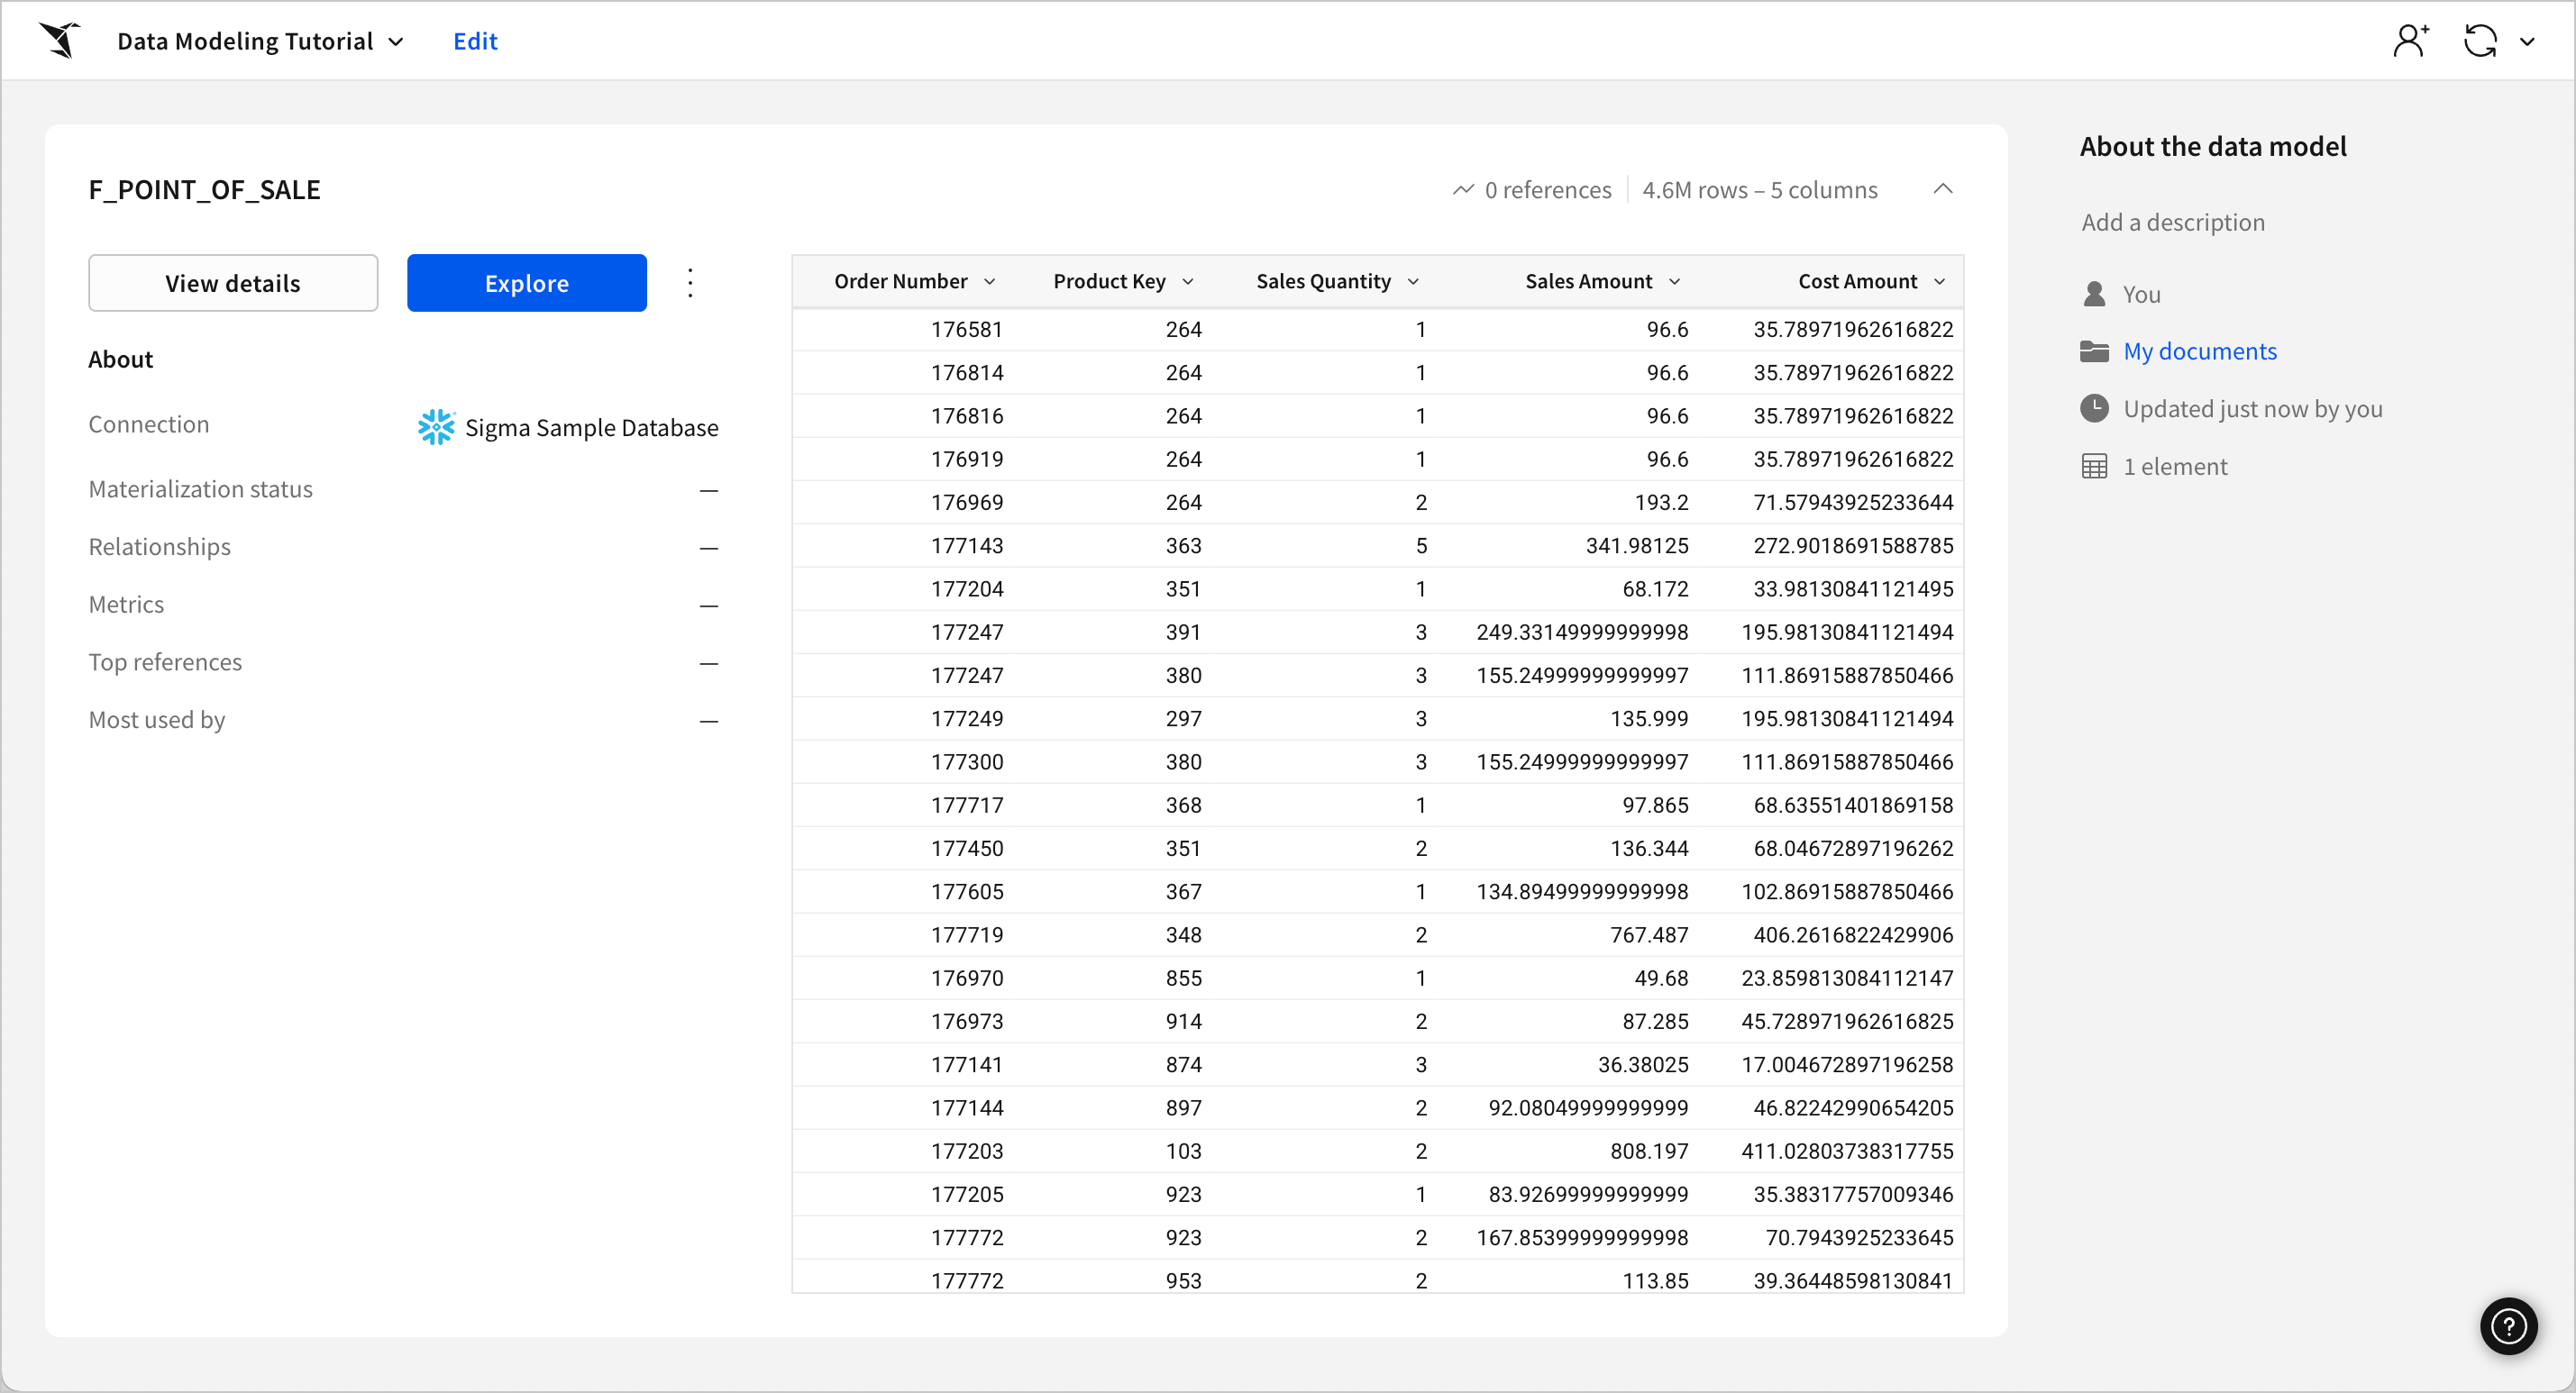
You now have a working data model with a connected data source that can be used across different workbooks and other downstream applications. The next step is to add some calculations and metrics to make it easier for your business users to view and work with important data points in your model.
## Create calculations and metrics for a data model
In a data model, you can add both calculated columns and metrics to help ensure consistency in the way your data is used. Metrics and calculated columns are similar, but have different use cases:
* Calculated columns save time for both users who use the data model in their downstream analyses as well as users who build the data models, as users performing analyses do not need to add common calculations manually and users building the data models do not need to spend as much effort debugging custom formulas.
* Metrics allow you to create a custom, reusable aggregate calculation that is associated with your data model. They are helpful for ensuring consistent and efficient aggregate calculations are being used and performed by your business users downstream.
For more information, see [Choosing between metrics and calculated columns](/docs/about-metrics).
### Create a calculated column
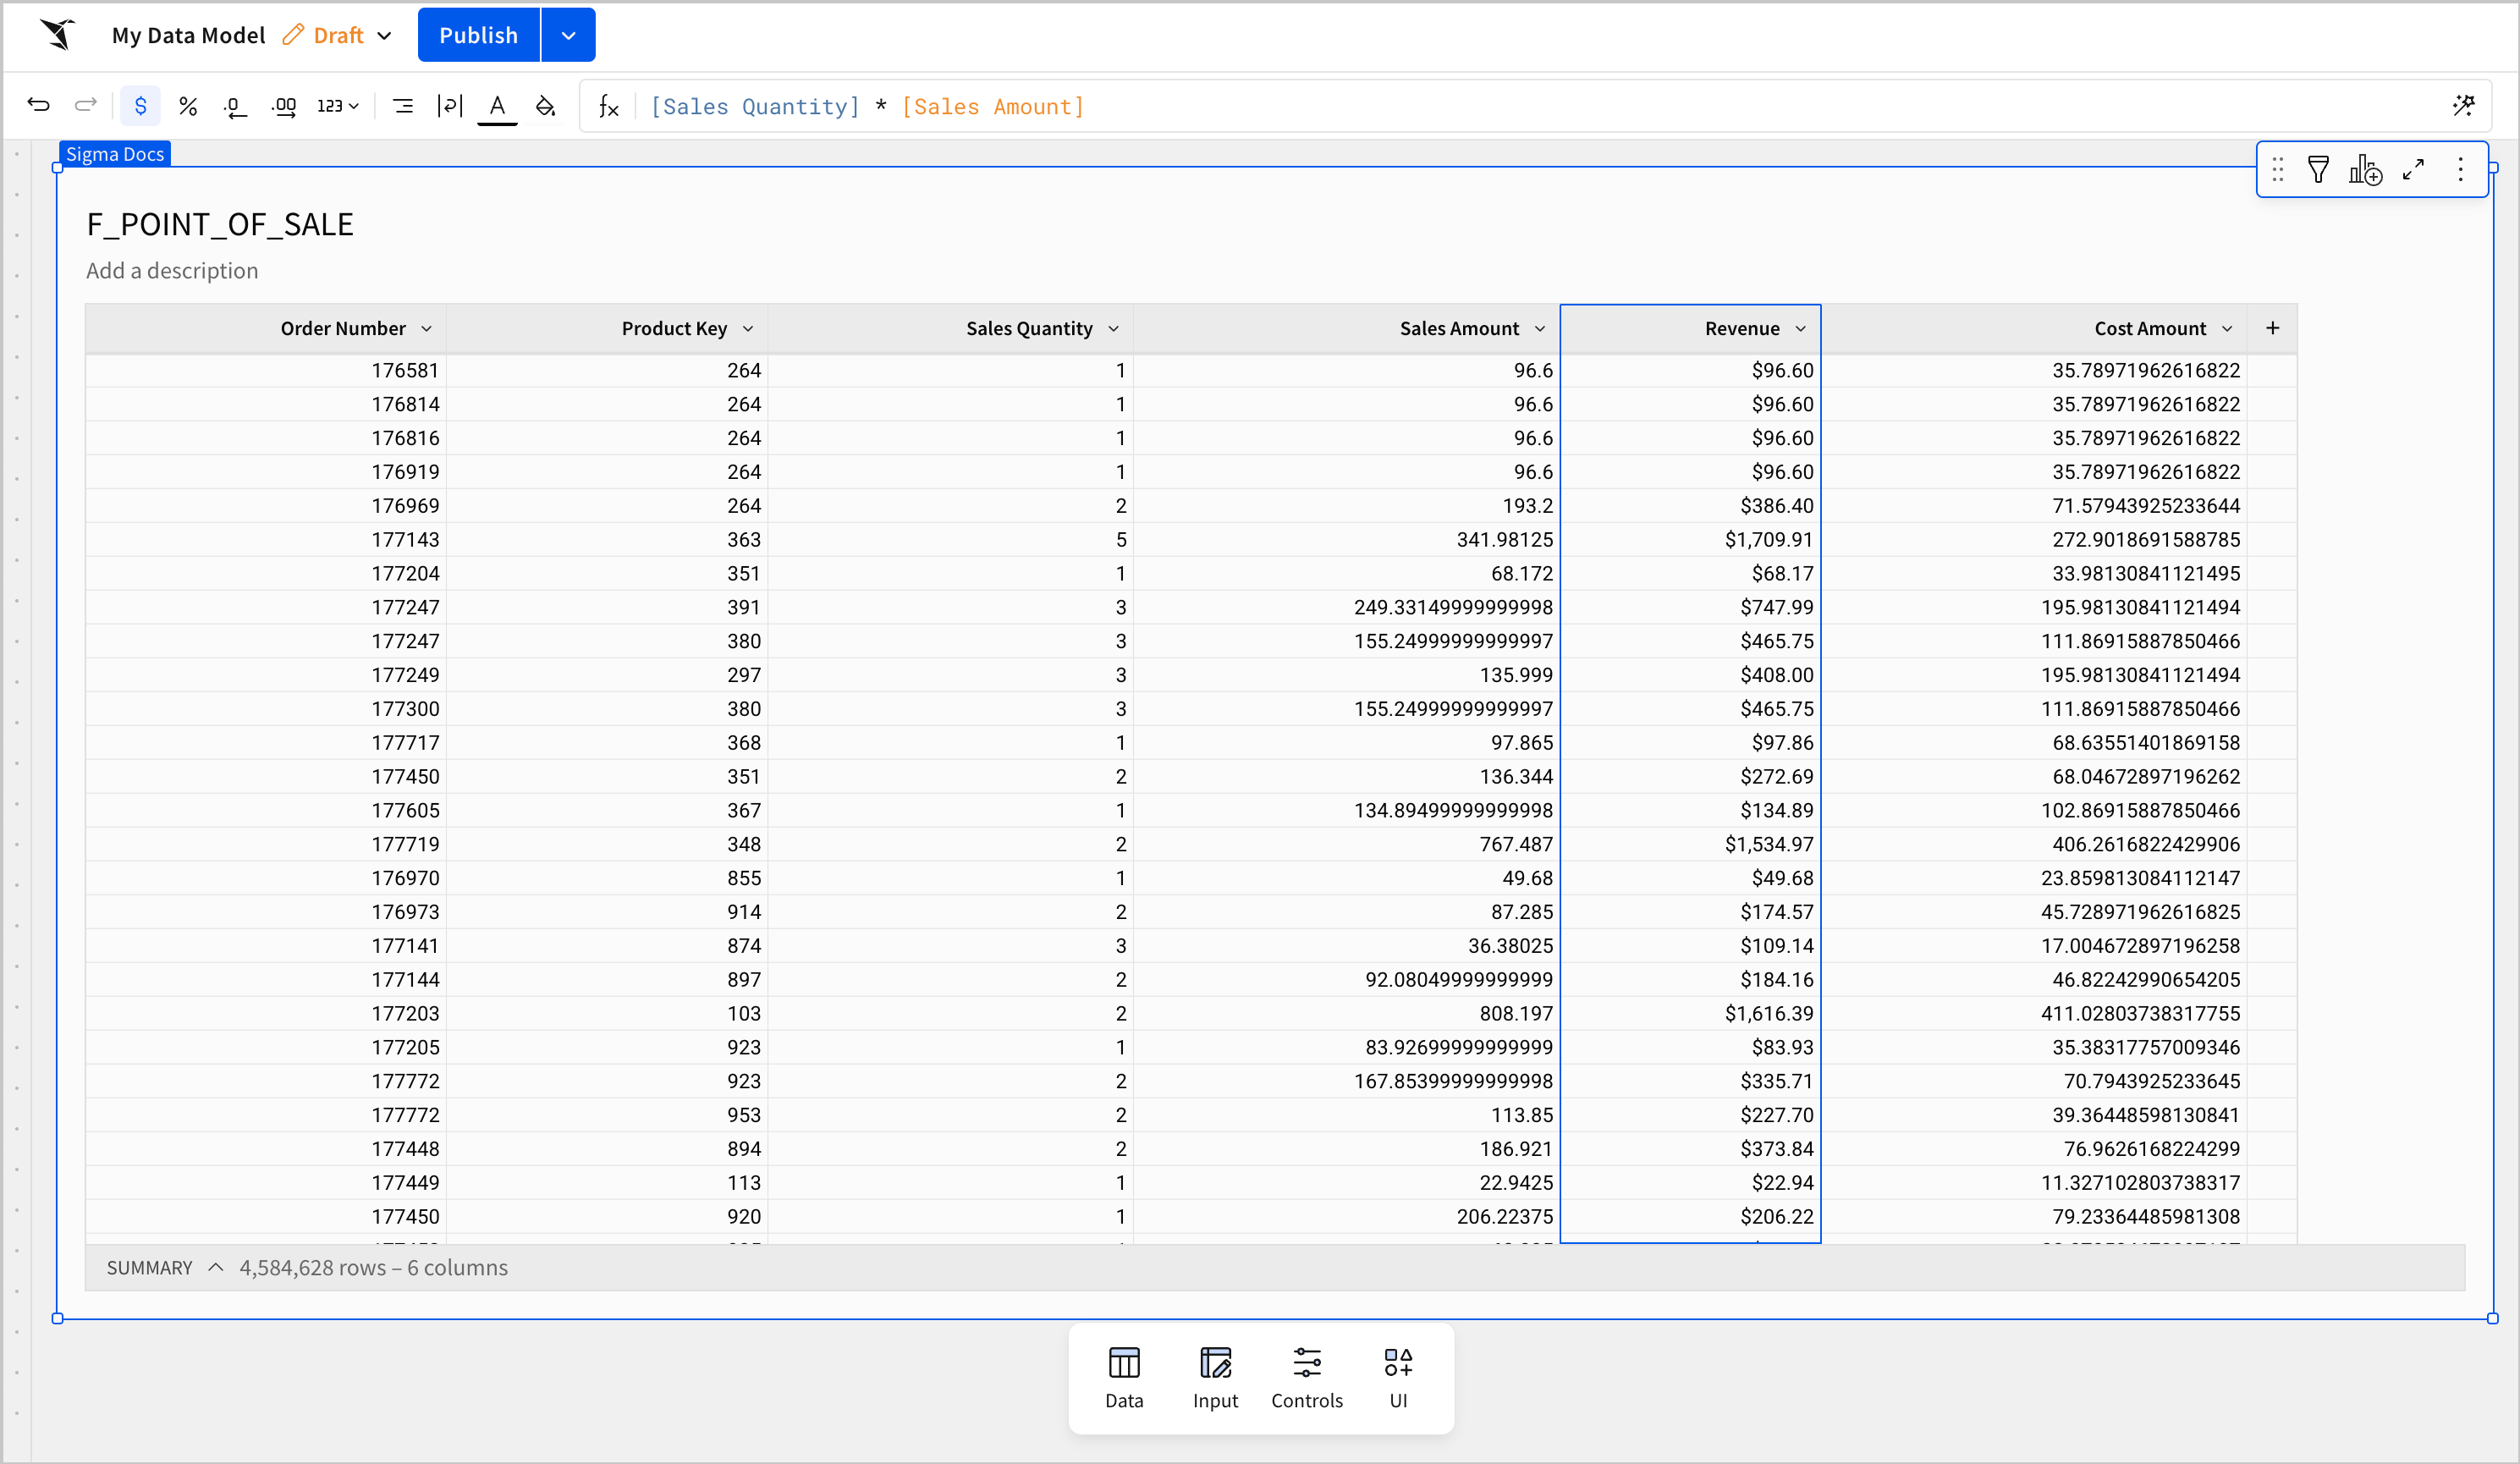
For this **F\_POINT\_OF\_SALE** table, it is possible to calculate revenue using the **Sales Amount** and **Sales Quantity** columns. However, because some of your users might not know the difference between these two columns and a column like **Cost Amount**, it is useful to create calculated **Revenue** or **Cost of Goods Sold** columns for them ahead of time so they can create calculations and perform sales analyses without the risk of miscalculating.
Add calculated columns for your business users that calculate the revenue and cost for each order:
1. Click the down arrow ( ) on the **Sales Amount** column to open the column menu.
2. Select **Add new column**.
3. In the formula bar of the new column, enter `[Sales Amount] * [Sales Quantity]`.
4. To rename the column, double click the new column's name on the table column header and enter `Revenue` to rename the column.
5. In the formatting toolbar, select **Format as currency** to make the column data display as currency.
6. Repeat the previous steps to create a **Cost of Goods Sold (COGS)** calculated column:
* Formula: `[Cost Amount] * [Sales Quantity]`\
Column name: `COGS`
The **Revenue** and **COGS** columns are now available in your data model for your users to use in their explorations and analyses. Users cannot see or modify the original calculations, but they can reference them or nest them within their calculations.
### Create a metric
The **Revenue** and **COGS** calculated columns allow your users to create new columns and charts that make use of the revenue and cost data without needing to calculate them from the source data on their own. However, you might want to define more complex aggregate calculations, such as averages and sums, ahead of time as well. To create reusable aggregate calculations in your data model, you need to use metrics.
Create a metric for your data model that shows your business users the average profit per item sold that they can reuse in their own calculations and workbooks:
1. Select the table on the workbook page.
2. In the **Metrics** section of the editor panel, select
) on the **Sales Amount** column to open the column menu.
2. Select **Add new column**.
3. In the formula bar of the new column, enter `[Sales Amount] * [Sales Quantity]`.
4. To rename the column, double click the new column's name on the table column header and enter `Revenue` to rename the column.
5. In the formatting toolbar, select **Format as currency** to make the column data display as currency.

6. Repeat the previous steps to create a **Cost of Goods Sold (COGS)** calculated column:
* Formula: `[Cost Amount] * [Sales Quantity]`\
Column name: `COGS`
The **Revenue** and **COGS** columns are now available in your data model for your users to use in their explorations and analyses. Users cannot see or modify the original calculations, but they can reference them or nest them within their calculations.
### Create a metric
The **Revenue** and **COGS** calculated columns allow your users to create new columns and charts that make use of the revenue and cost data without needing to calculate them from the source data on their own. However, you might want to define more complex aggregate calculations, such as averages and sums, ahead of time as well. To create reusable aggregate calculations in your data model, you need to use metrics.
Create a metric for your data model that shows your business users the average profit per item sold that they can reuse in their own calculations and workbooks:
1. Select the table on the workbook page.
2. In the **Metrics** section of the editor panel, select  **Add metric**.
The **Add a metric** modal opens.
3. In the **Name** field, enter `Average profit per item sold`. This is the metric's name that is displayed to downstream users of the metric.
4. In the **Description** field, enter `The average of Revenue - COGS across every row with data` to provide more context for downstream users.
The description is displayed when a user clicks on the metric in the data model overview page or hovers over the metric in a workbook.
5. For **Formula**, enter `Avg([Revenue] - [COGS])`.
6. In the **Preview** section of the **Add a metric** modal, click **Format as currency** to ensure your revenue metric is displayed correctly.
![The Sigma Edit metric modal opened in a data model, with the Name text field set to Average profit per item sold, the description set to The average of Revenue - COGS across every row with data, the Formula set to Avg(\[Revenue\]) - \[COGS\]), and a Sales Data table with revenue and cost statistics next to a preview of a profit per item sold metric displaying an average of \$112.45.](https://files.buildwithfern.com/sigma.docs.buildwithfern.com/4c9c81528d8b83ec9d39da70cdca0a7abef476cd36d95125daeda240bc09c826/assets/docs-images/591437cf1cb8dbd1f6be7d7061d6cac340da657a9dbaec5655217f408551f41d-avgmetric_datamodelingtut_2.png)
7. Click **Publish** and then select **Go to published version** from the **Publish** menu to view the metric from the data model overview.
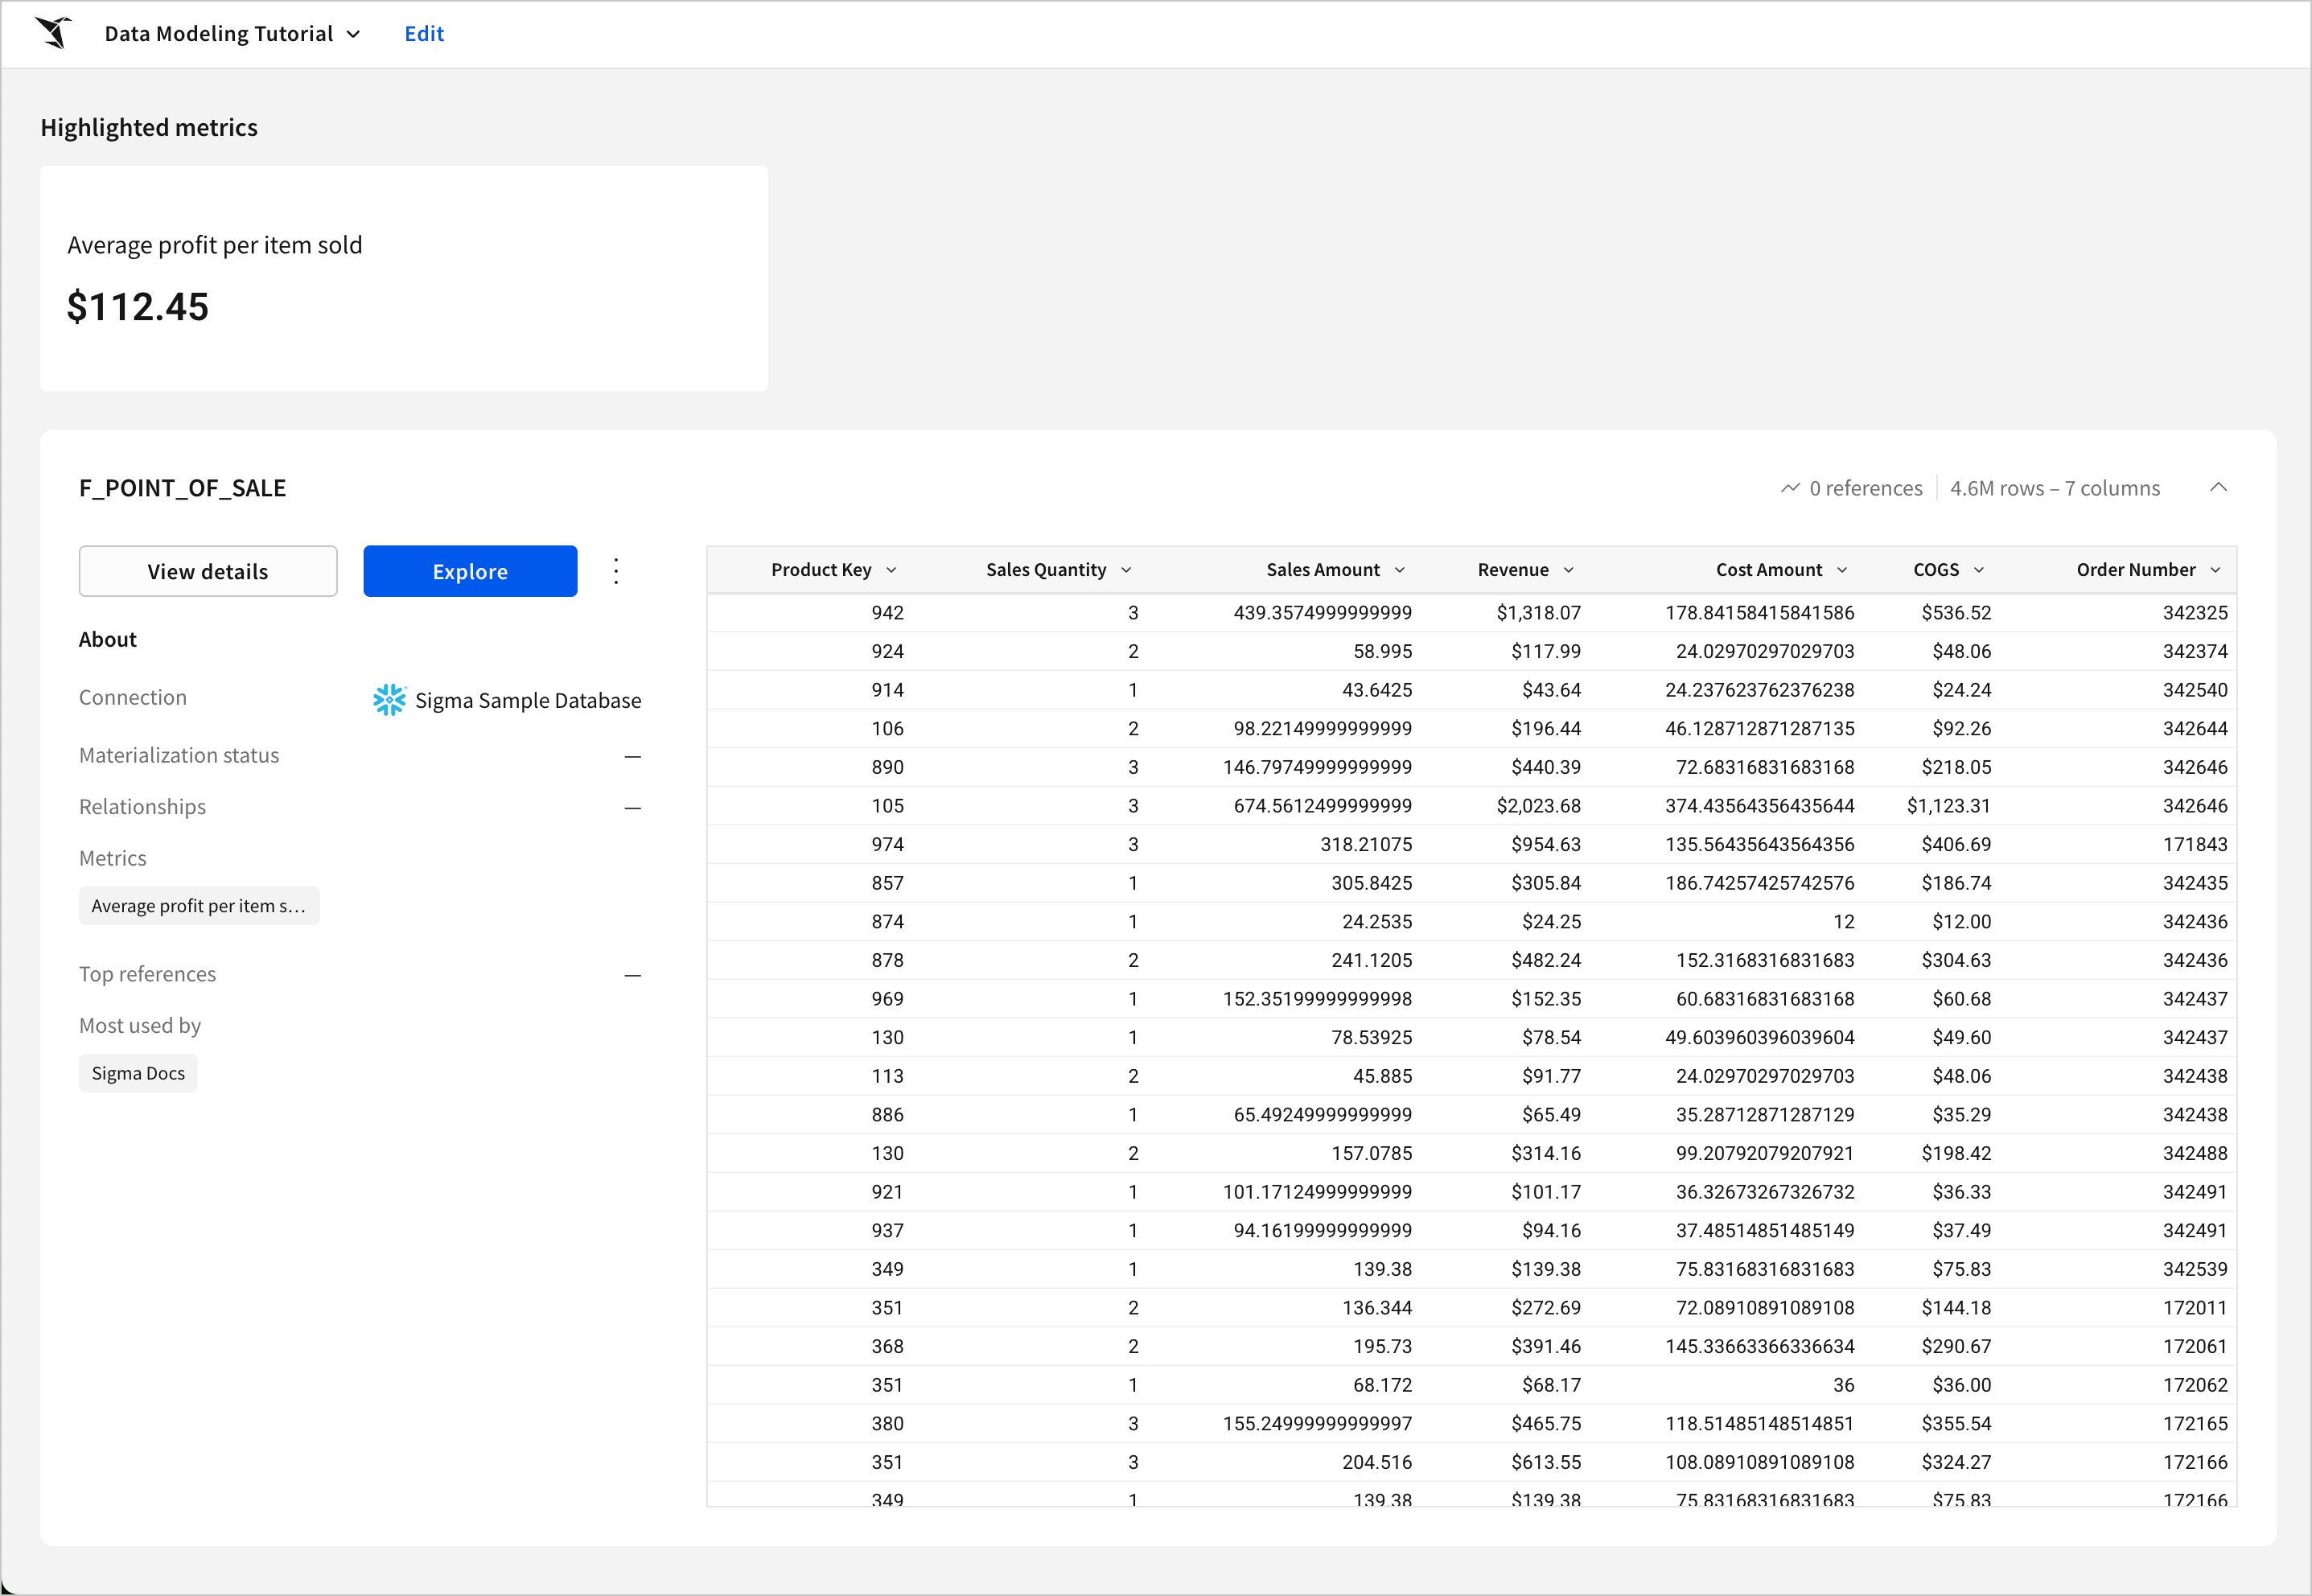
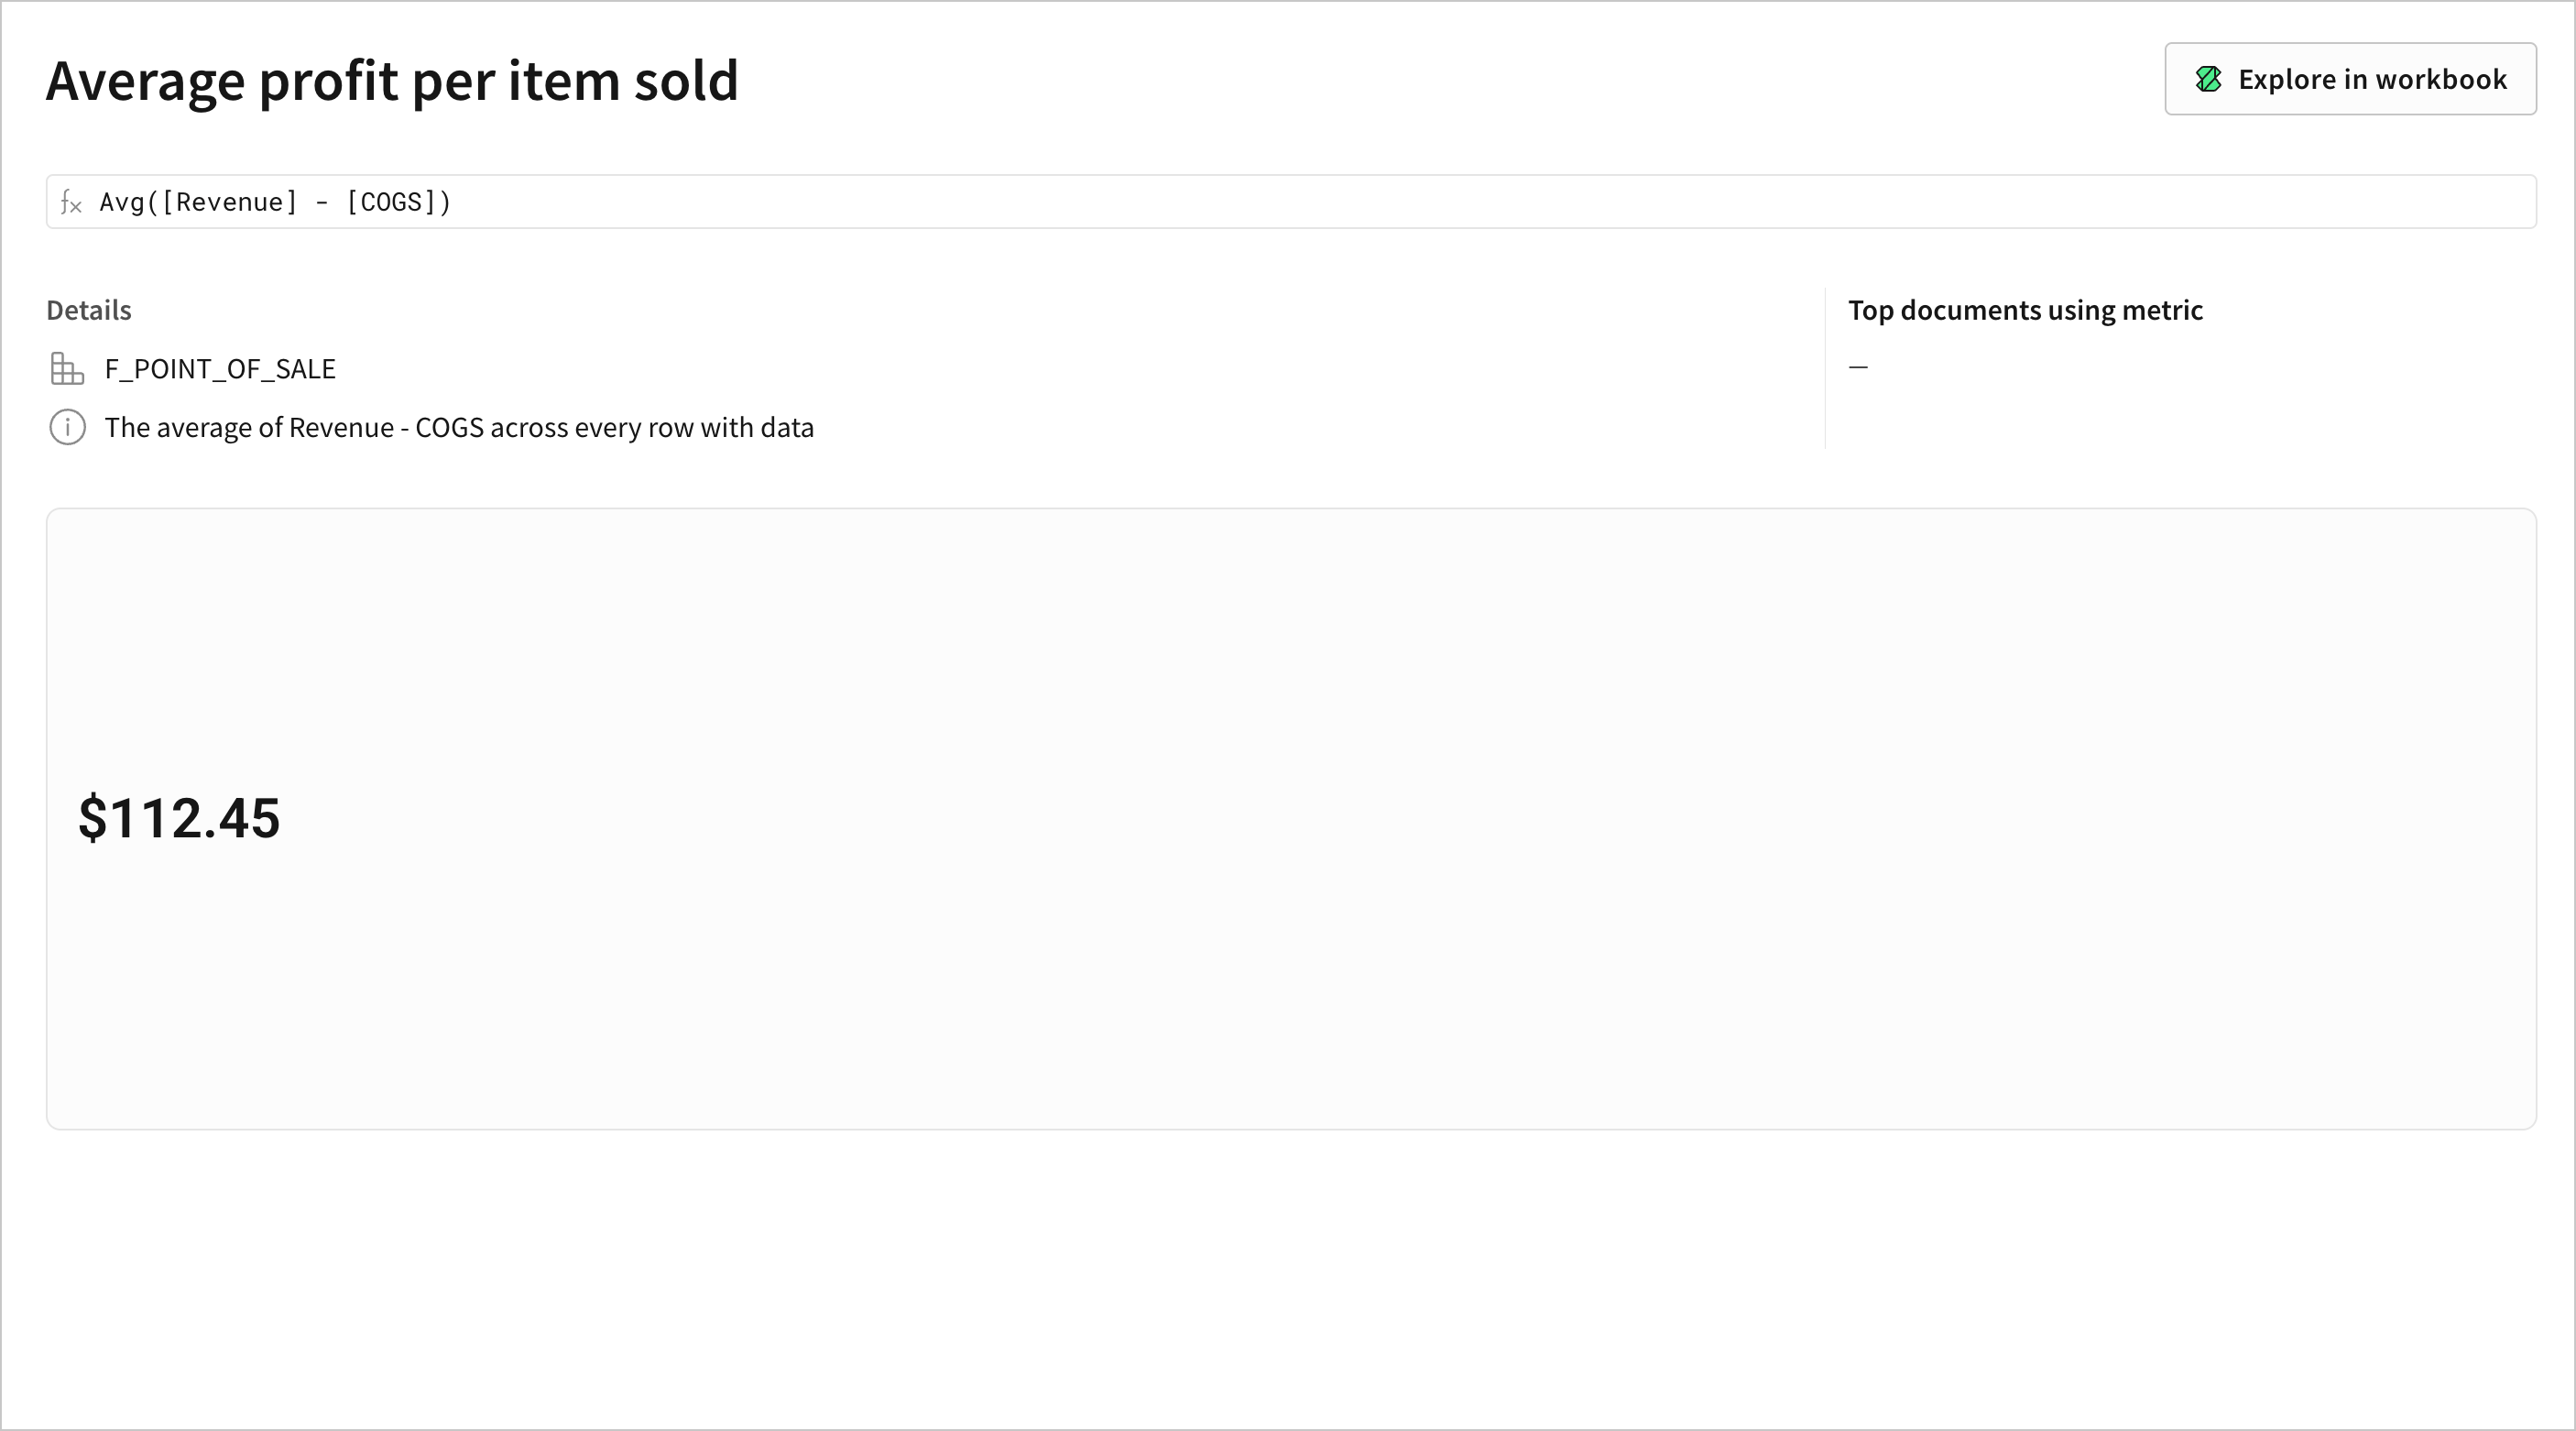
Your **Average profit per item sold** metric is now available in the data model overview and ready to use in your business users' workbooks. Users can click on the metric to see further information, view the metric's original formula, open a custom view of the metric, and create workbooks that reference it.
## Add related data sources to a data model
Now that you have metrics and calculated columns set up, you might want to add more data for analysis by joining your table with other relevant tables in your database. For example, in the **Sigma Sample Database**, there are several other tables related to the **F\_POINT\_OF\_SALE** table, including **F\_SALE**, **D\_STORE**, **D\_CUSTOMER**, **D\_PRODUCT**. You can join these tables with the **F\_POINT\_OF\_SALE** table to add new columns directly, but you can also create relationships to define the logic and parameters for a join ahead of time.
Joins are useful when you want to add data to your data model that you know is useful for most of the users accessing it. Relationships allow your users to access source columns from the related table and add them to their analysis if needed, without performing expensive and complicated joins every time they access the data model. The join is only performed if a user adds source columns from a related table.
### Join additional tables
You can use the **Order Number** column from the **F\_POINT\_OF\_SALE** table as a join key to perform a join with the **F\_SALES** and **D\_STORE** tables because they all have a matching **Order Number** column. The **F\_SALES** and **D\_STORE** tables contain the essential data points, such as the date of the transaction and information about the store, that all users of this data model need to access downstream, so a join makes more sense than defining a relationship. Sigma supports left, right, full, and inner join types, as well as lookups. See [Join types](/docs/joins-overview) for more information.
Join the **F\_POINT\_OF\_SALE** table with relevant tables to add more context to the data model using a left outer join:
1. Click **Edit** to continue editing the data model.
2. Select the **F\_POINT\_OF\_SALE** table on the data model page and click
**Add metric**.
The **Add a metric** modal opens.
3. In the **Name** field, enter `Average profit per item sold`. This is the metric's name that is displayed to downstream users of the metric.
4. In the **Description** field, enter `The average of Revenue - COGS across every row with data` to provide more context for downstream users.
The description is displayed when a user clicks on the metric in the data model overview page or hovers over the metric in a workbook.
5. For **Formula**, enter `Avg([Revenue] - [COGS])`.
6. In the **Preview** section of the **Add a metric** modal, click **Format as currency** to ensure your revenue metric is displayed correctly.
![The Sigma Edit metric modal opened in a data model, with the Name text field set to Average profit per item sold, the description set to The average of Revenue - COGS across every row with data, the Formula set to Avg(\[Revenue\]) - \[COGS\]), and a Sales Data table with revenue and cost statistics next to a preview of a profit per item sold metric displaying an average of \$112.45.](https://files.buildwithfern.com/sigma.docs.buildwithfern.com/4c9c81528d8b83ec9d39da70cdca0a7abef476cd36d95125daeda240bc09c826/assets/docs-images/591437cf1cb8dbd1f6be7d7061d6cac340da657a9dbaec5655217f408551f41d-avgmetric_datamodelingtut_2.png)
7. Click **Publish** and then select **Go to published version** from the **Publish** menu to view the metric from the data model overview.

Your **Average profit per item sold** metric is now available in the data model overview and ready to use in your business users' workbooks. Users can click on the metric to see further information, view the metric's original formula, open a custom view of the metric, and create workbooks that reference it.

## Add related data sources to a data model
Now that you have metrics and calculated columns set up, you might want to add more data for analysis by joining your table with other relevant tables in your database. For example, in the **Sigma Sample Database**, there are several other tables related to the **F\_POINT\_OF\_SALE** table, including **F\_SALE**, **D\_STORE**, **D\_CUSTOMER**, **D\_PRODUCT**. You can join these tables with the **F\_POINT\_OF\_SALE** table to add new columns directly, but you can also create relationships to define the logic and parameters for a join ahead of time.
Joins are useful when you want to add data to your data model that you know is useful for most of the users accessing it. Relationships allow your users to access source columns from the related table and add them to their analysis if needed, without performing expensive and complicated joins every time they access the data model. The join is only performed if a user adds source columns from a related table.
### Join additional tables
You can use the **Order Number** column from the **F\_POINT\_OF\_SALE** table as a join key to perform a join with the **F\_SALES** and **D\_STORE** tables because they all have a matching **Order Number** column. The **F\_SALES** and **D\_STORE** tables contain the essential data points, such as the date of the transaction and information about the store, that all users of this data model need to access downstream, so a join makes more sense than defining a relationship. Sigma supports left, right, full, and inner join types, as well as lookups. See [Join types](/docs/joins-overview) for more information.
Join the **F\_POINT\_OF\_SALE** table with relevant tables to add more context to the data model using a left outer join:
1. Click **Edit** to continue editing the data model.
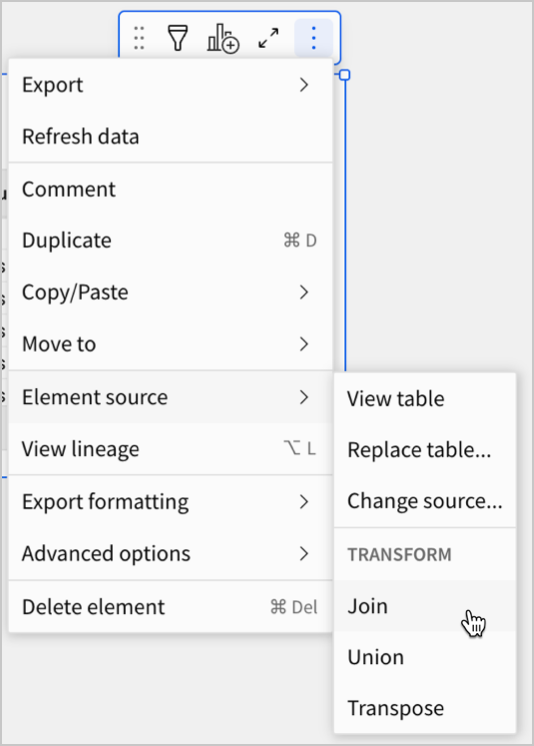
2. Select the **F\_POINT\_OF\_SALE** table on the data model page and click  **More** on the element toolbar.
3. Click **Element source** > **Join** to open the **Select source** modal.
4. Select the **RETAIL** > **PLUGS\_ELECTRONICS** > **F\_SALES** table from the **Sigma Sample Database** connection to see a preview of the data.
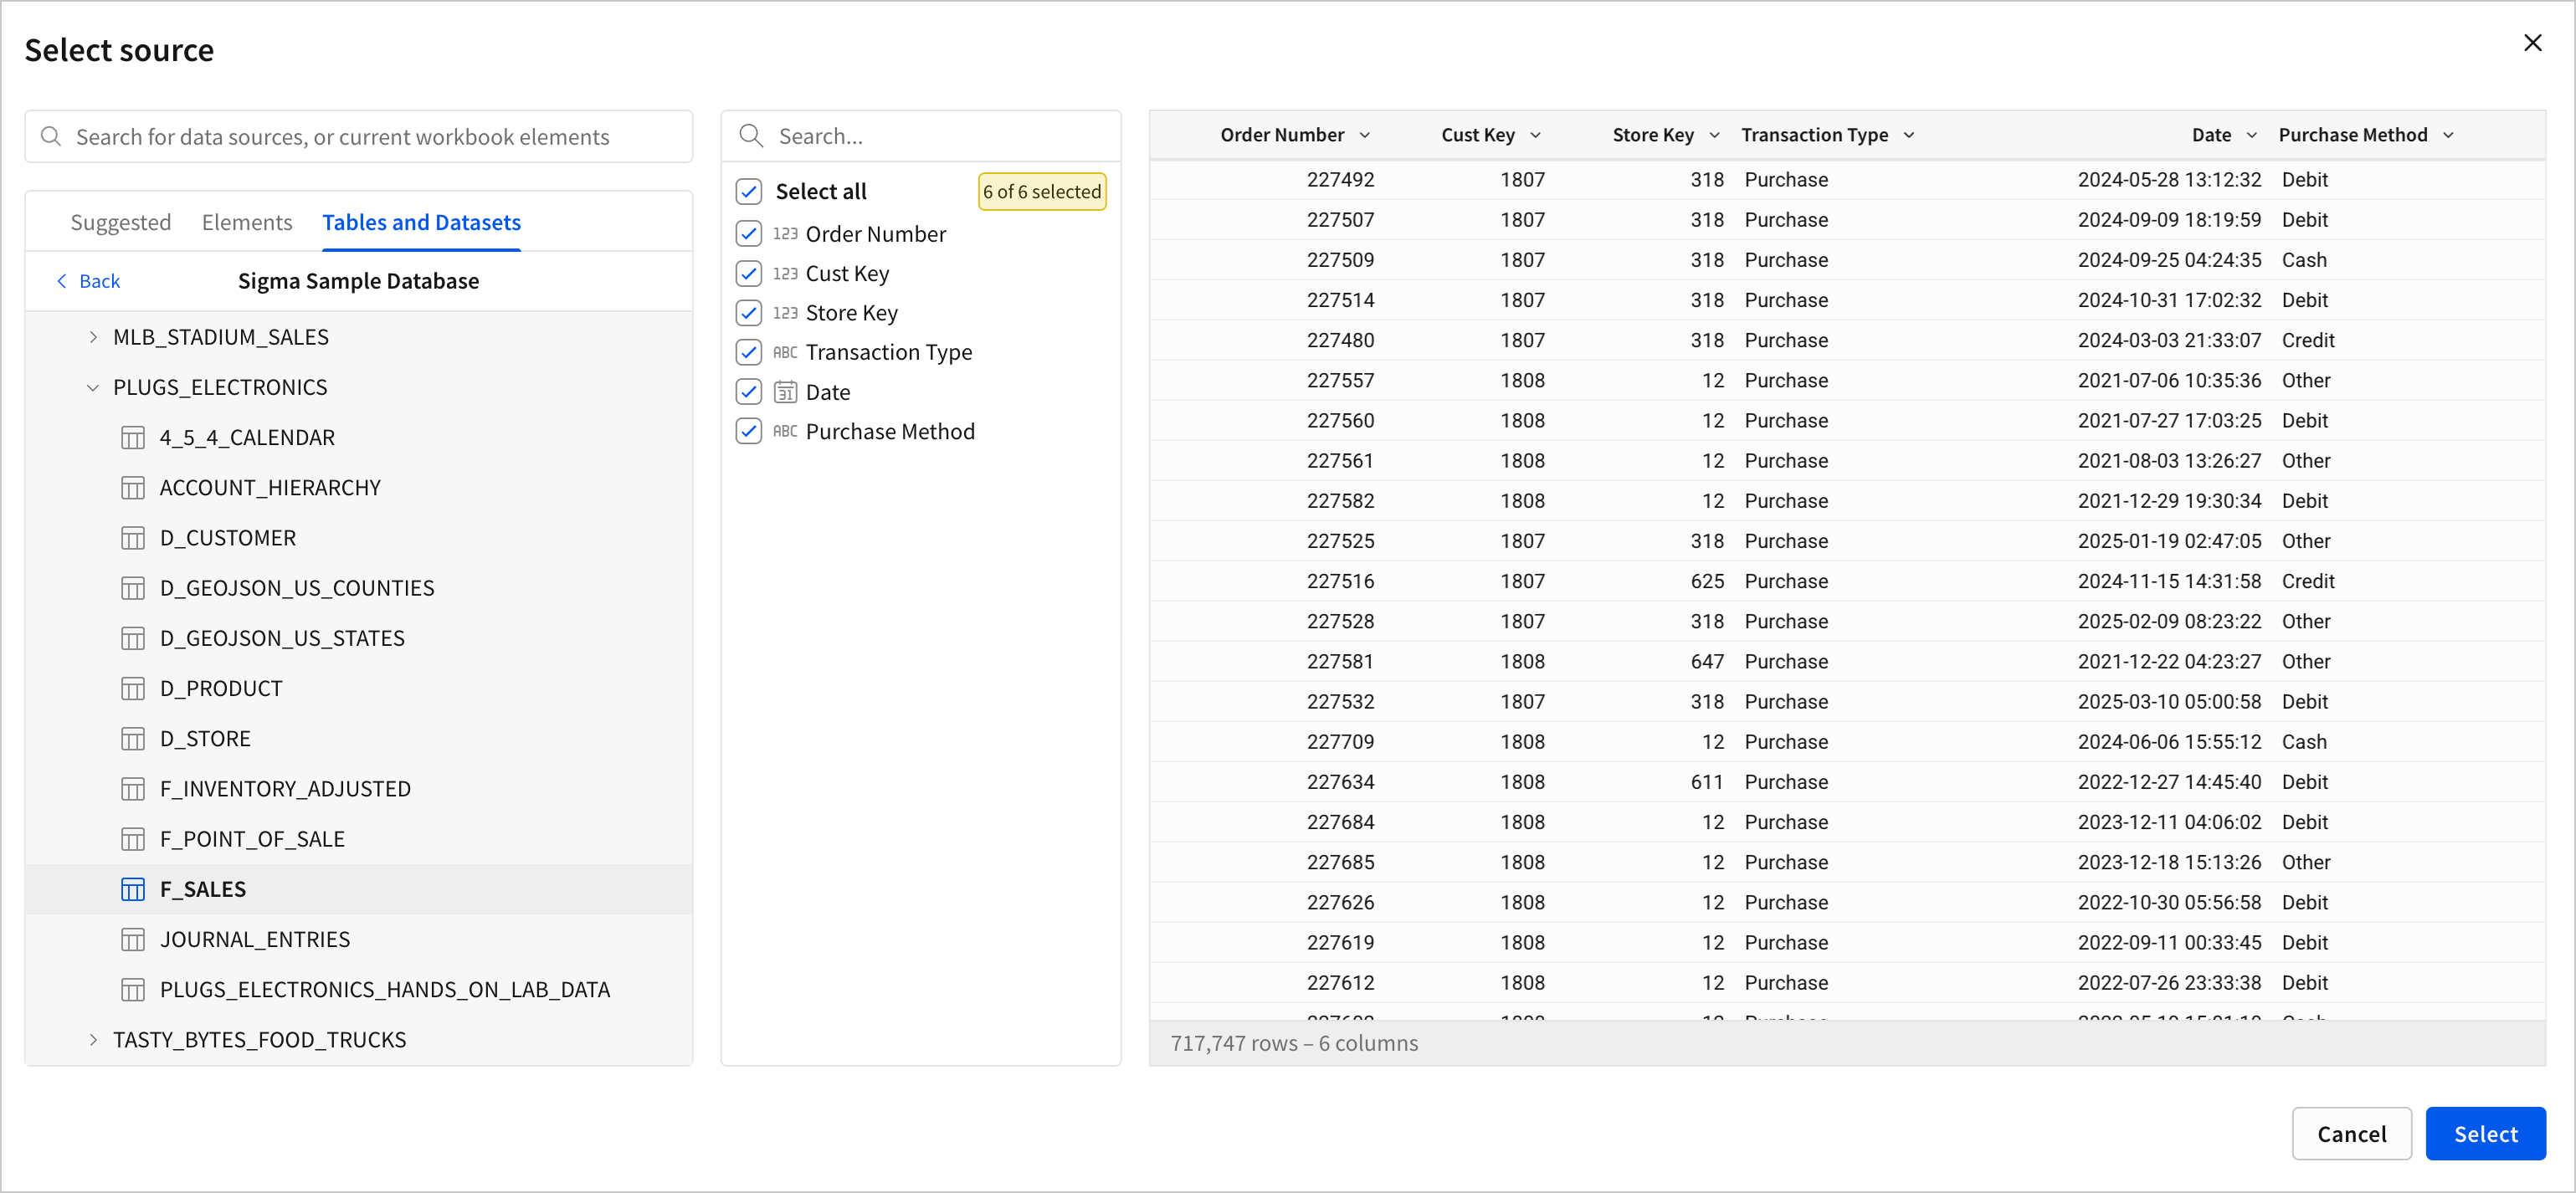
5. Click **Select** to set the **F\_SALES** table as the join source and open the **Create join** page.
6. For **Join type,** ensure the default join type, **Left outer join**, is selected.
7. Set both join keys to the **Order Number** column.\
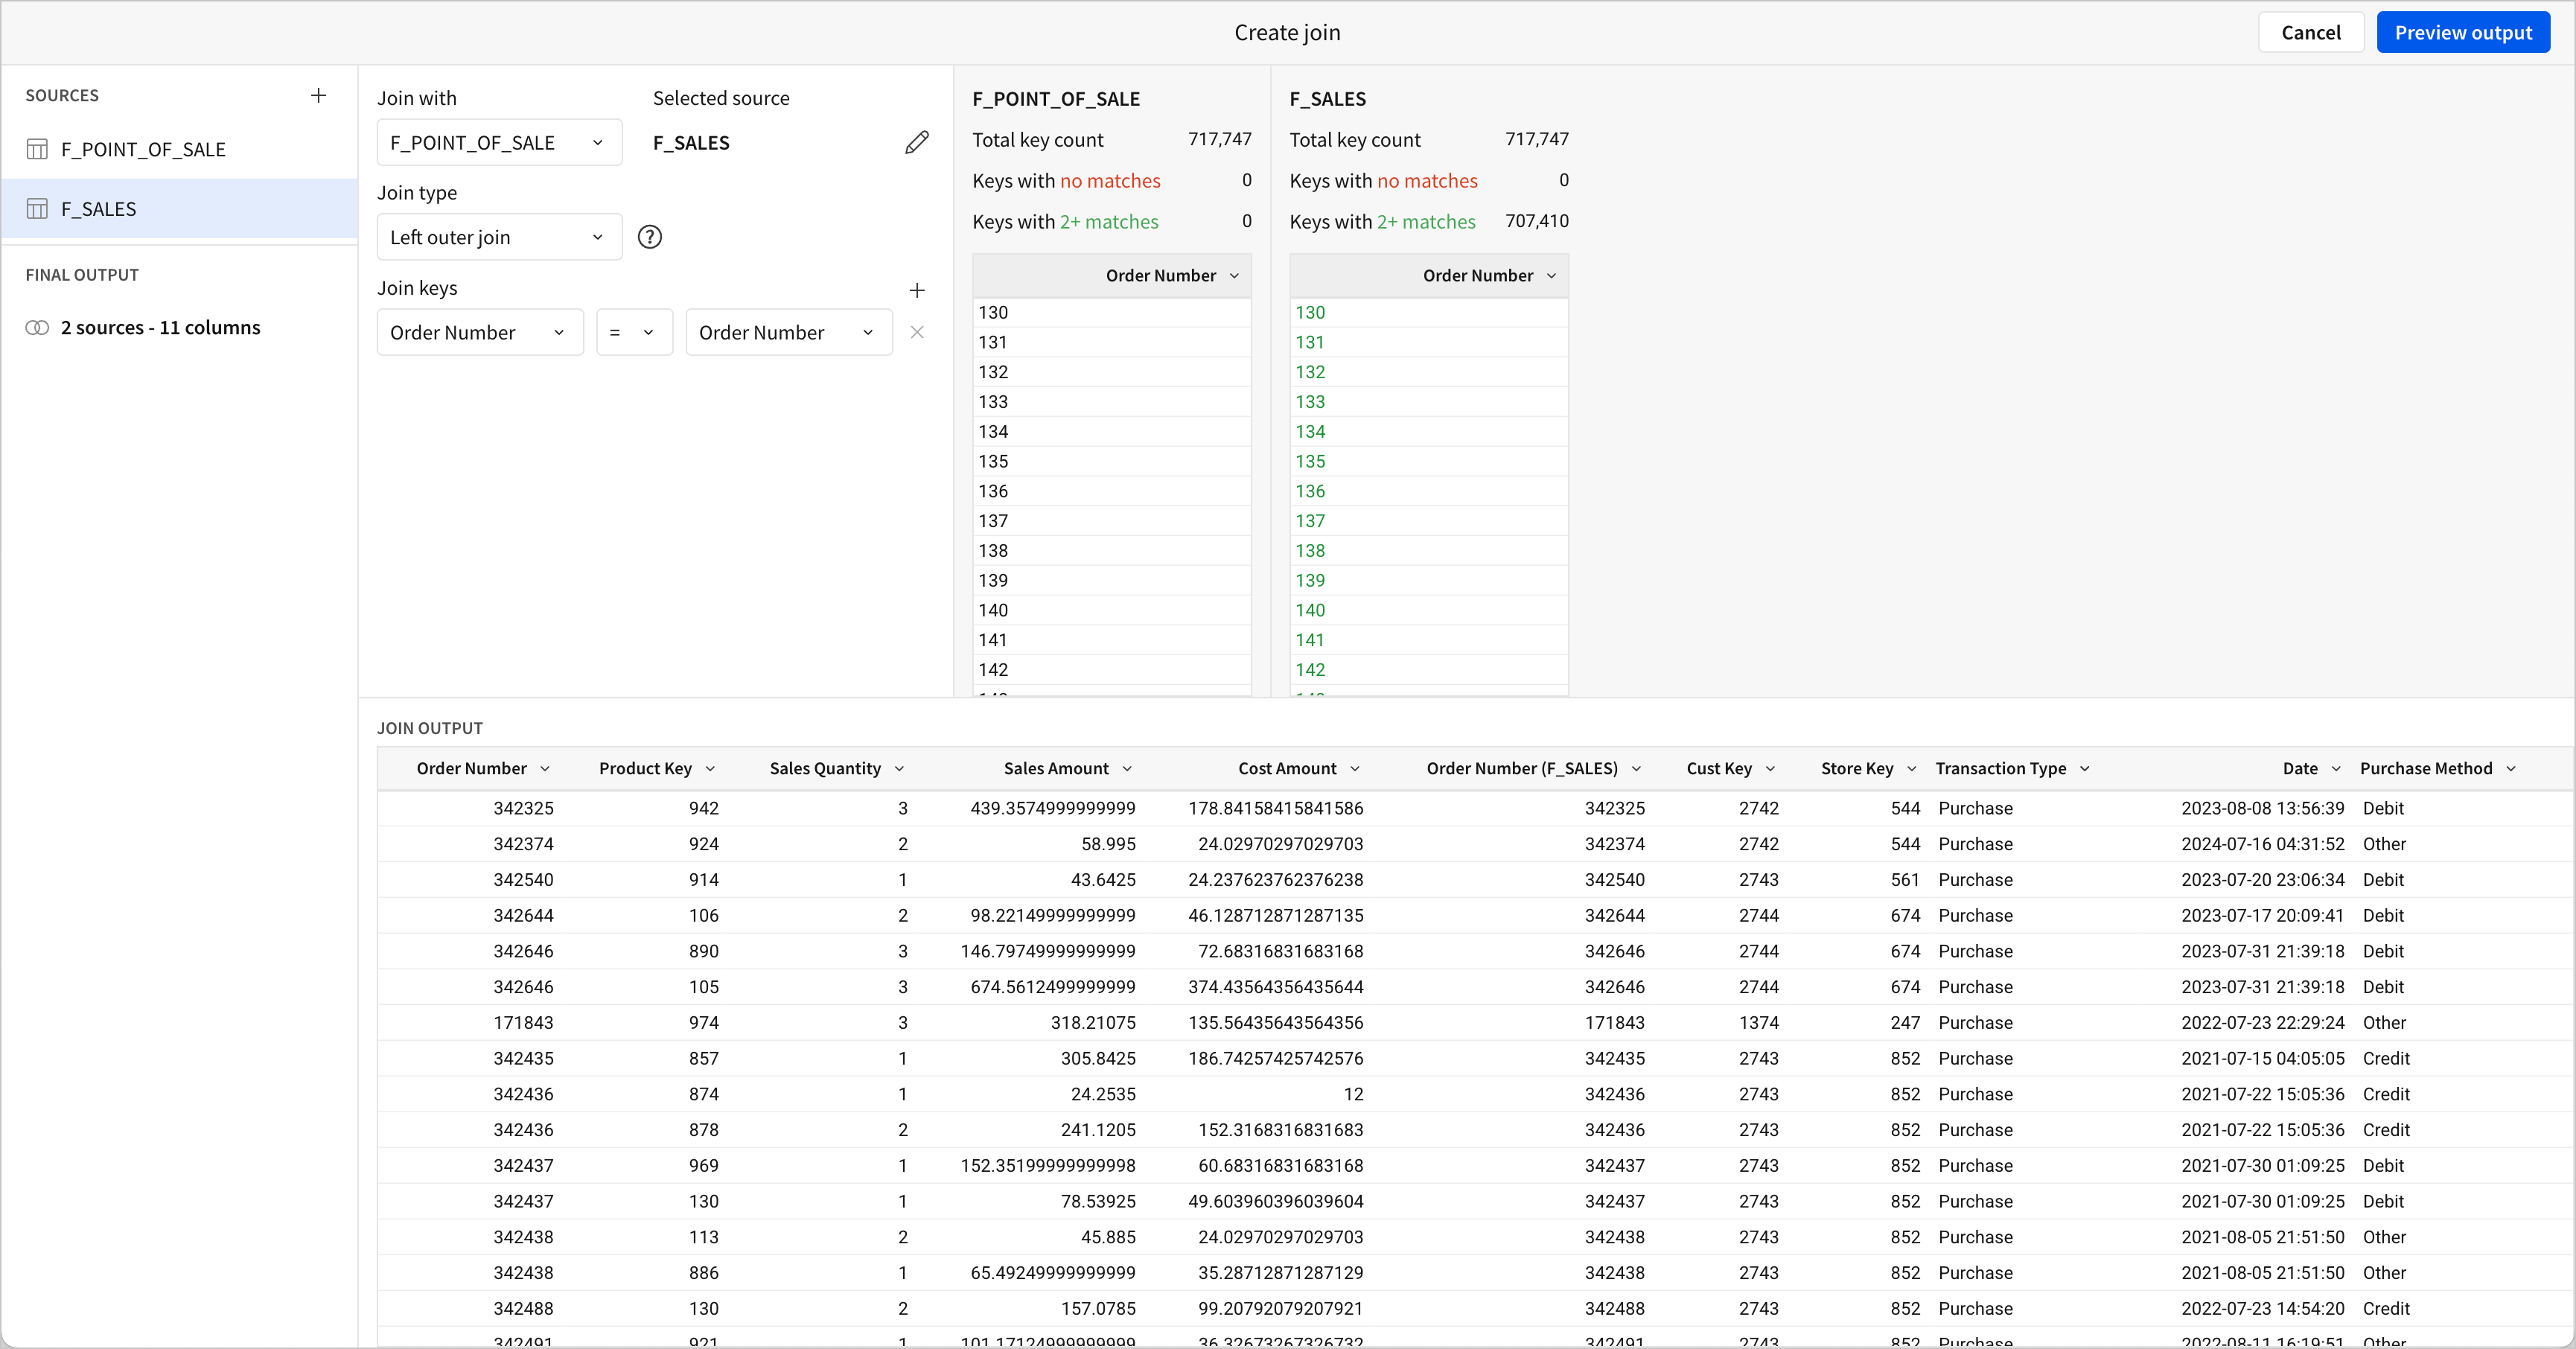
8. Click **Preview output** and verify that the columns from **F\_SALES** have been added and that they correctly align on their *Order Number* values.
9. Deselect the checkbox for **Order Number** under the **F\_SALES** section so there are no duplicate columns.
10. Click **Done** to return to the data model page. The columns from **F\_SALES** are now visible on the **F\_POINT\_OF\_SALE** table.
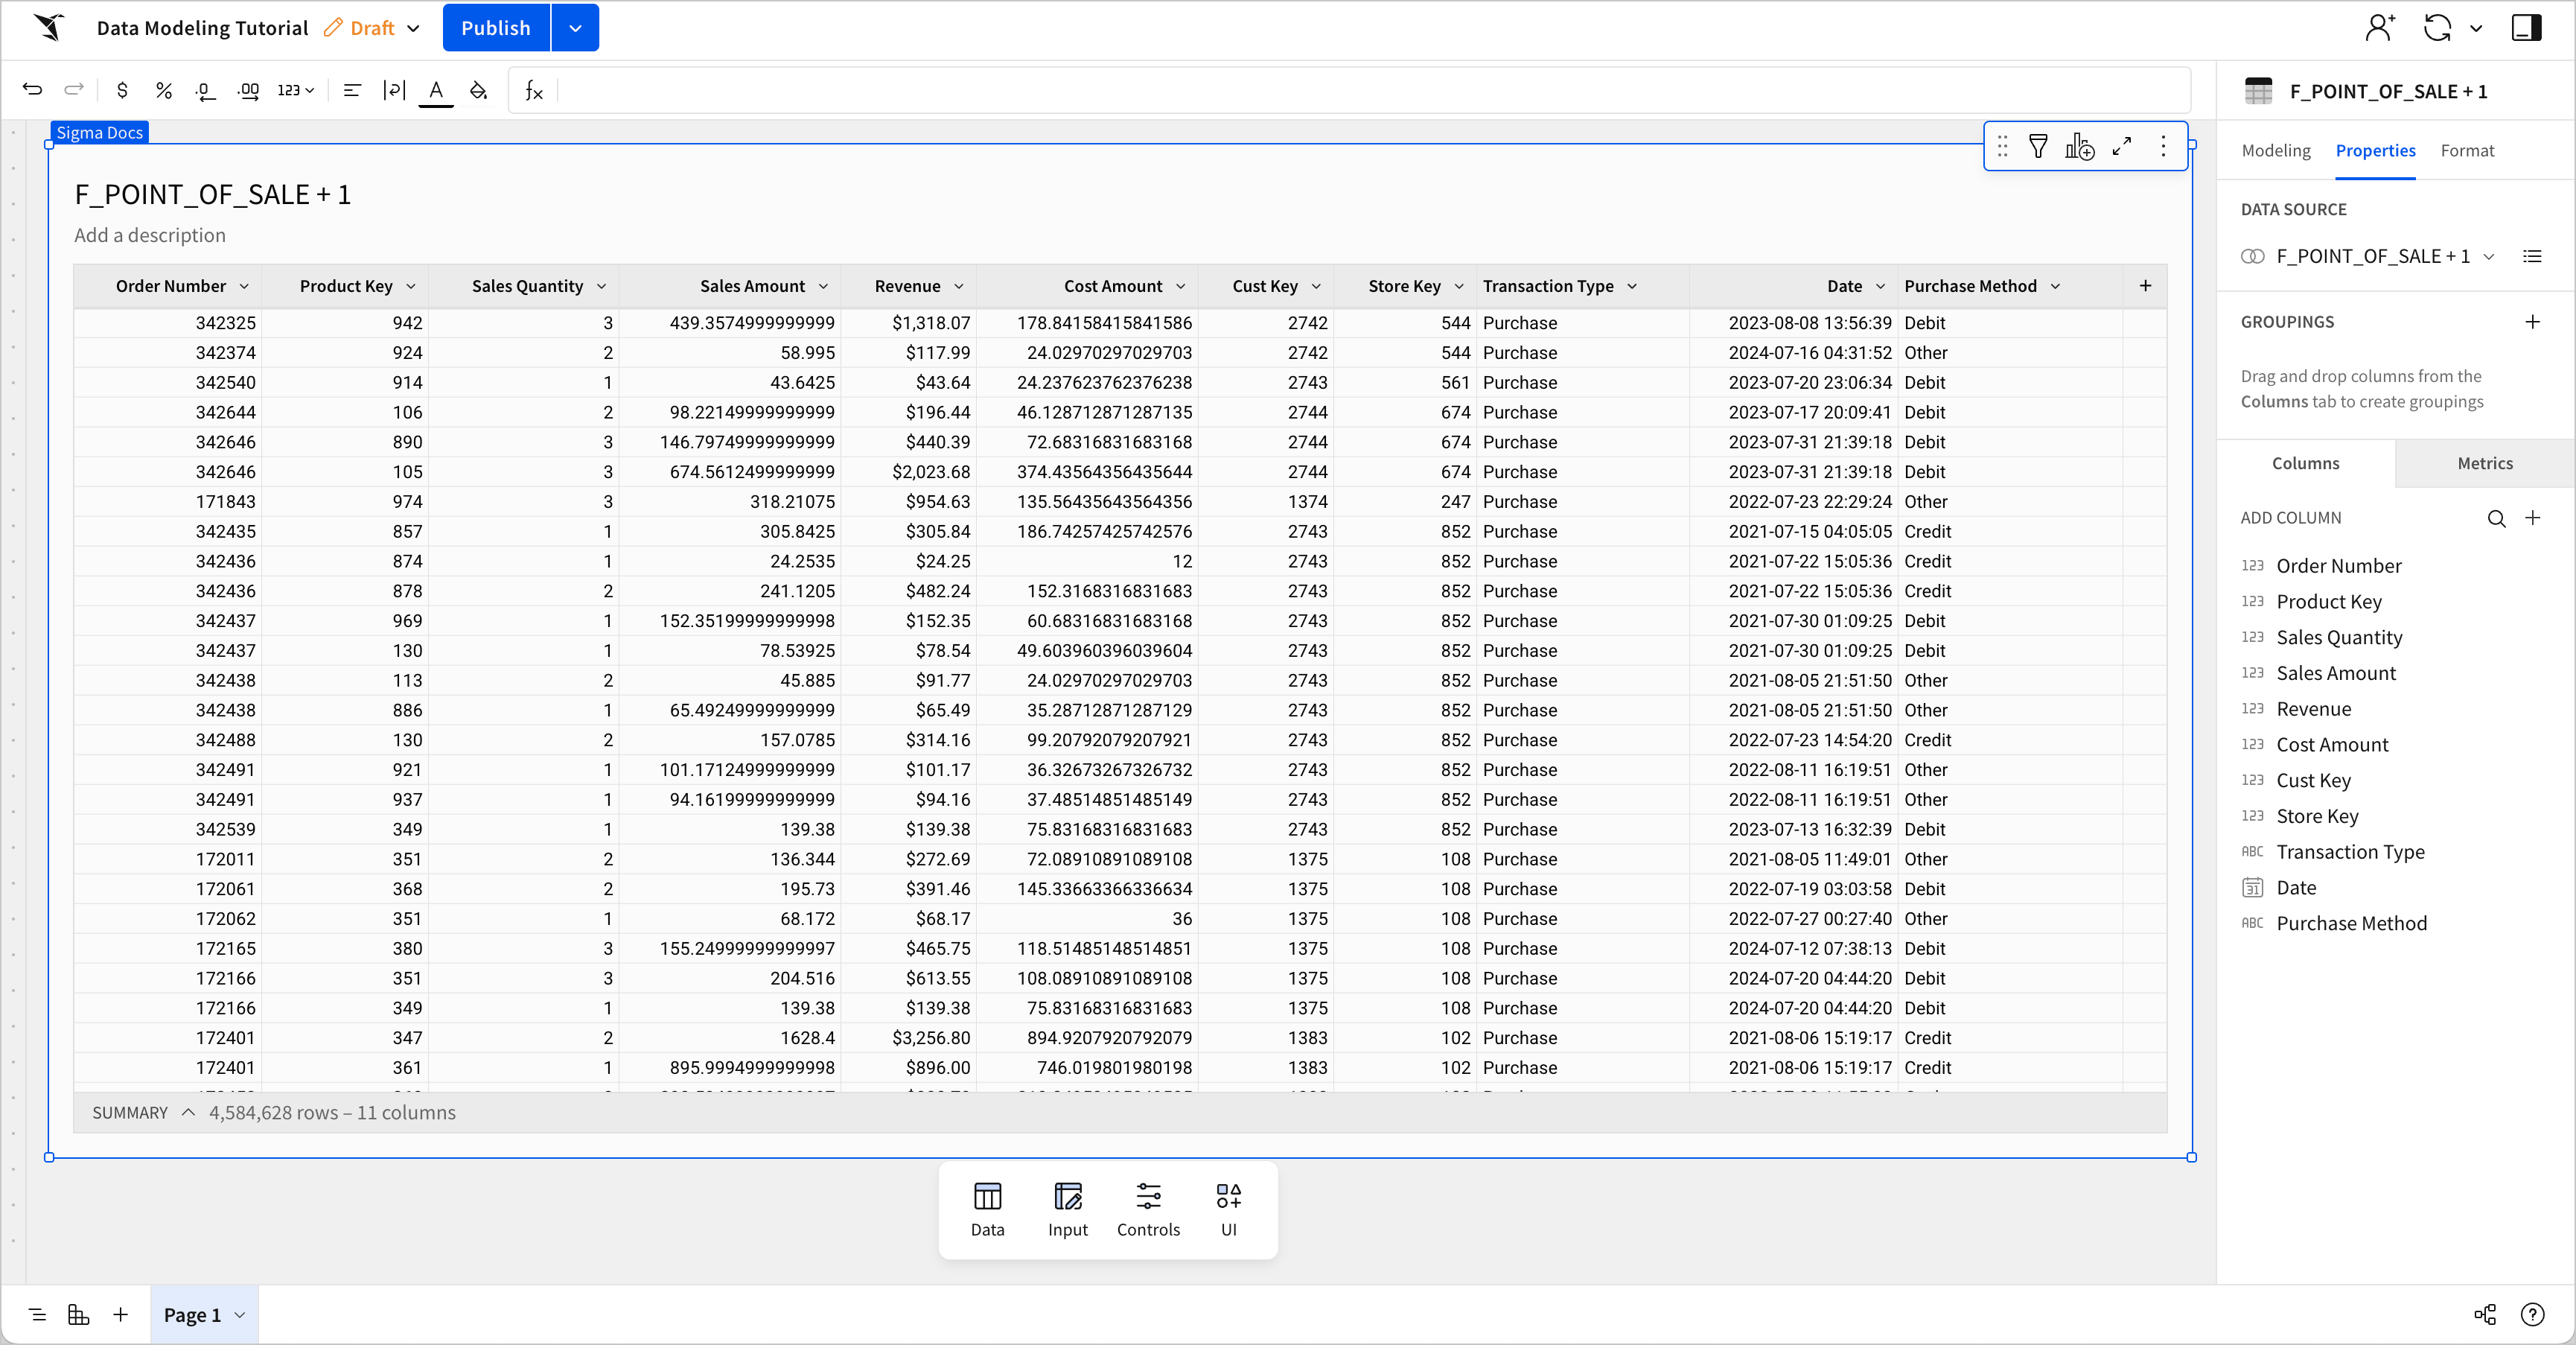
11. Join additional tables by clicking **More** on the element toolbar and selecting **Edit join** to open the **Create join** page.
12. Click **Add source** to open the **Select source** modal. Then, repeat the steps above for the **D\_STORE** table using the following configuration:
* Join keys: **Store Key**
* Columns: **Store Name, Store City, Store State, Store Json Field**
For **D\_STORE**, make sure that **Join with** is set to **F\_SALES** and not **F\_POINT\_OF\_SALE** to ensure proper results.
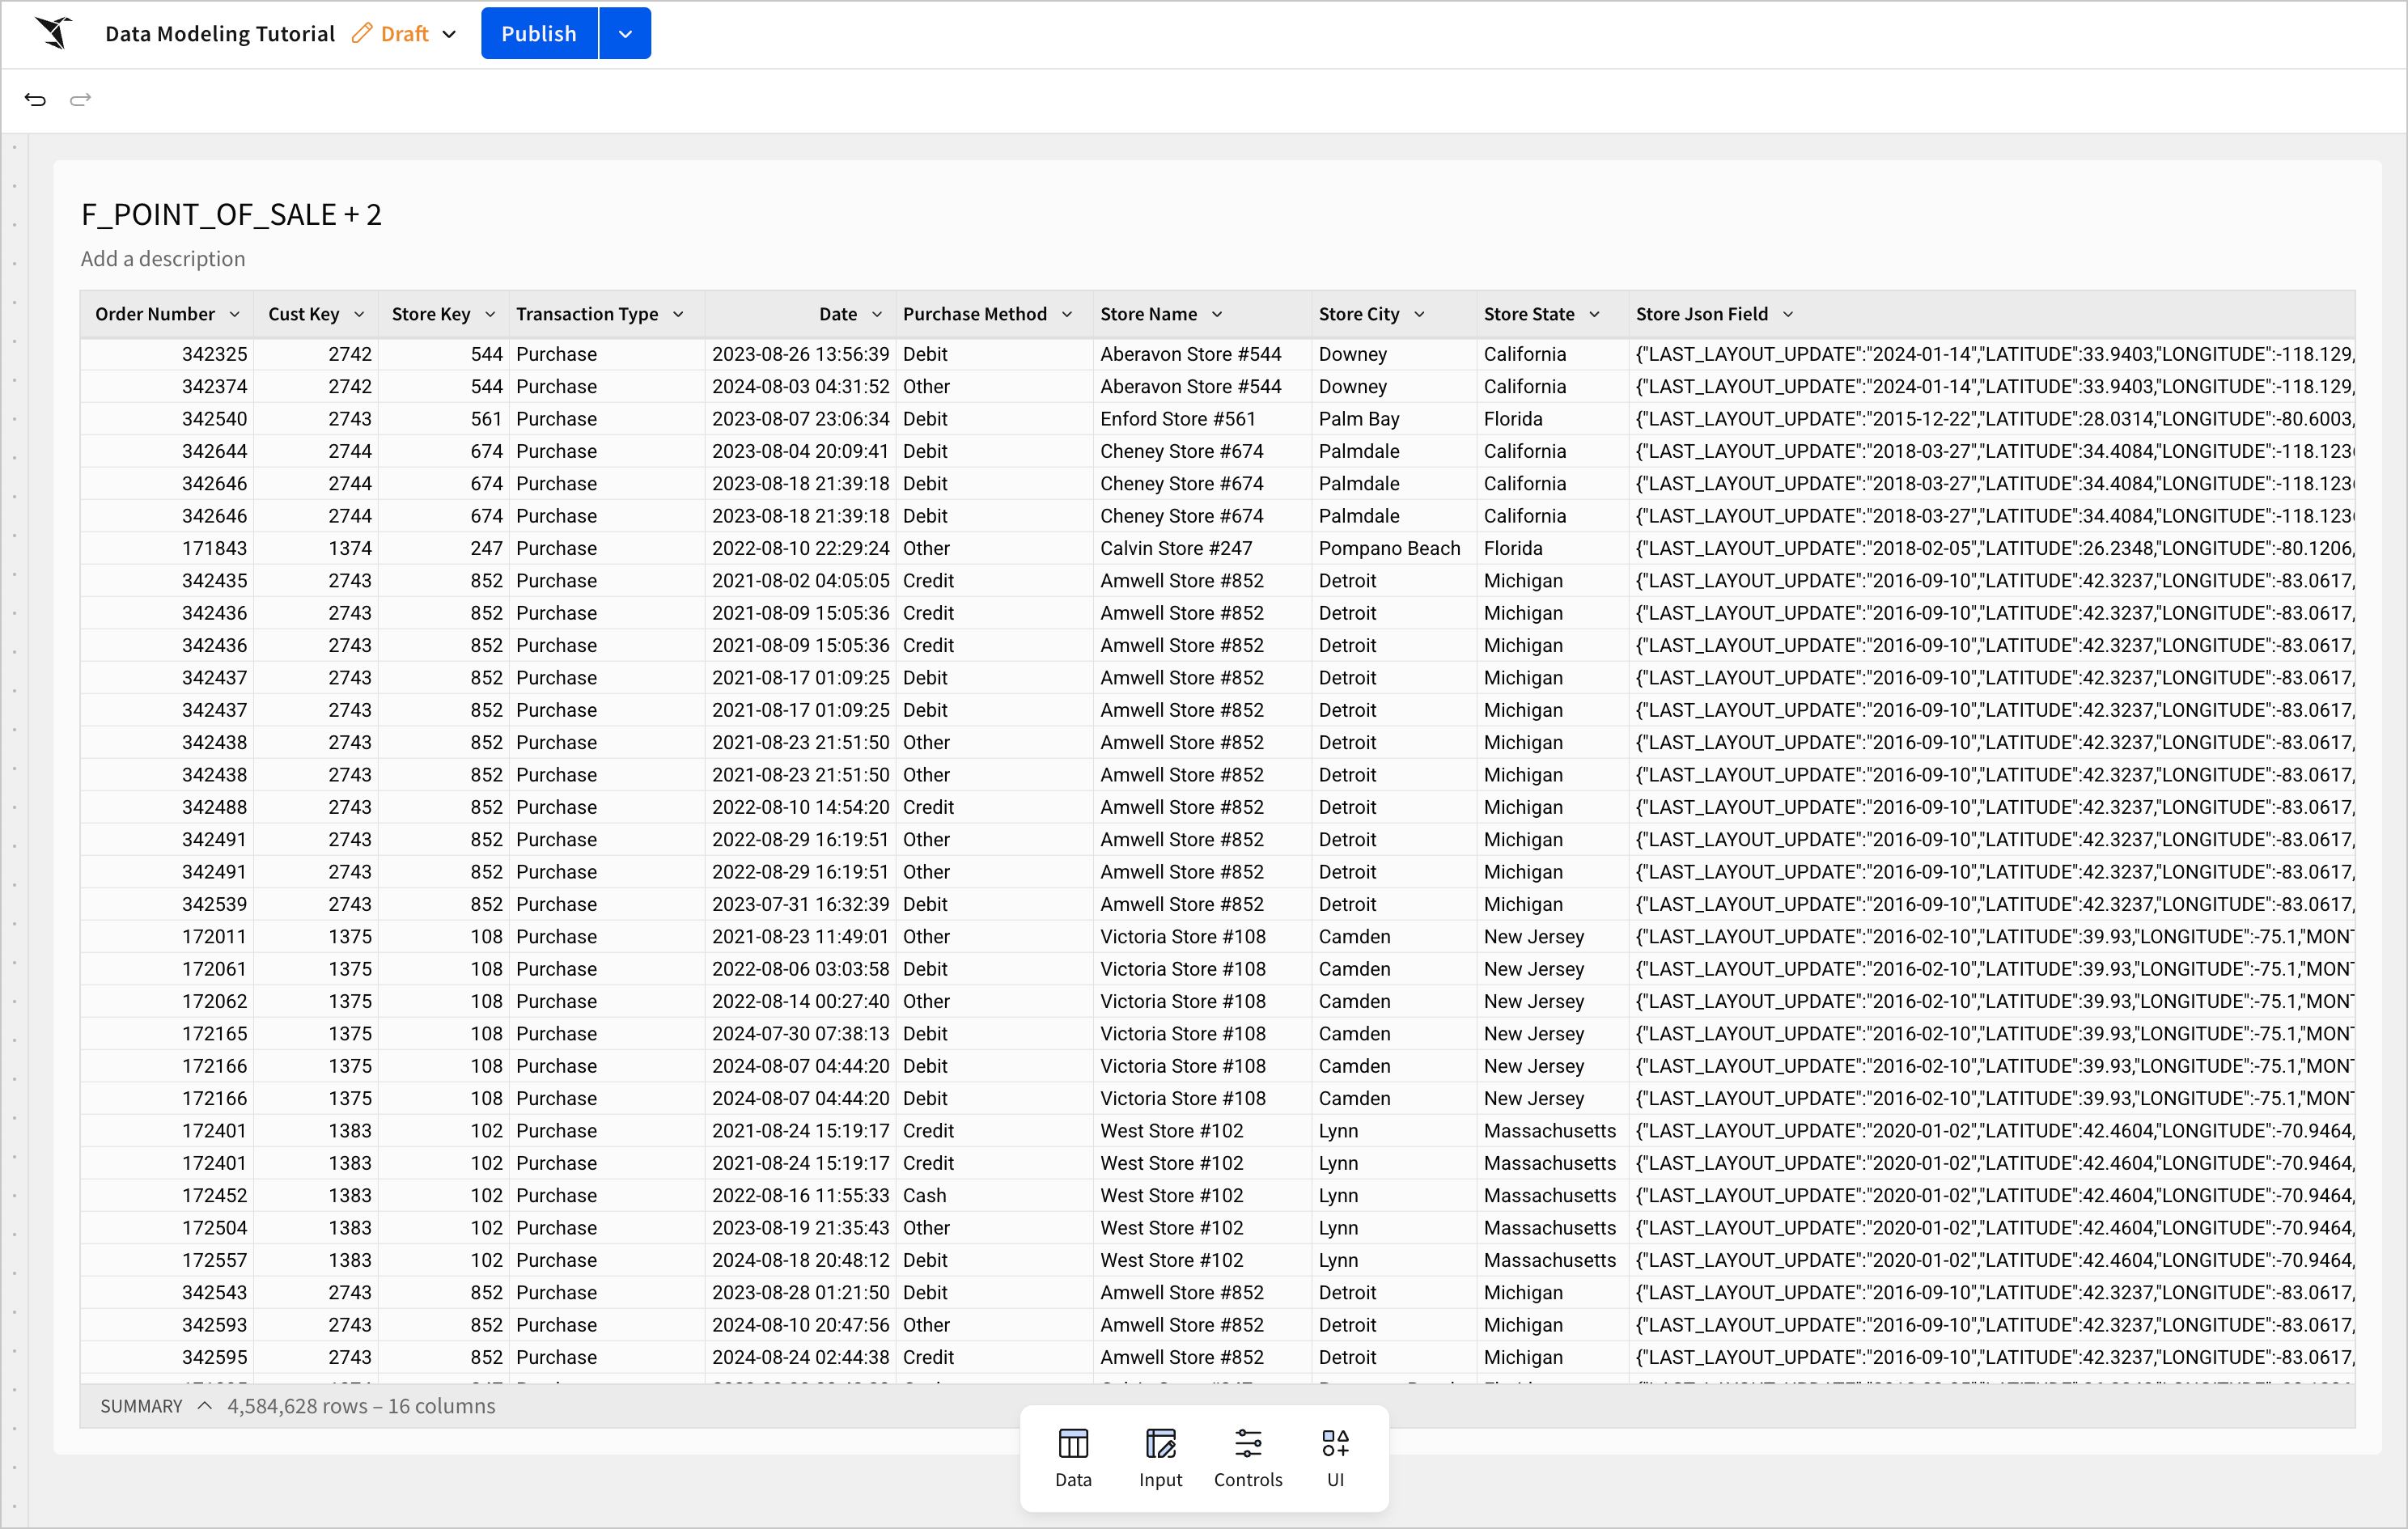
The new columns from the **F\_SALES** and **D\_STORE** tables have been added to the original **F\_POINT\_OF\_SALE** table, and the table's name has been changed to **F\_POINT\_OF\_SALE + 2** to indicate that two tables have been joined with the **F\_POINT\_OF\_SALE** table.
Rename the table to make it easier to work with as you continue building the data model and also easier for your business users to identify as a data source downstream:
1. In the editor panel, double-click on the **F\_POINT\_OF\_SALE** title to edit the table name.
2. Enter `Sales Data` as the table's name.
3. Click **Publish**.
### Create relationships between tables
Most of the people using your data model are interested only in the data you added from **F\_SALES** and **D\_STORE**, and you do not want to overwhelm them with unneeded data or perform large, potentially costly joins each time they view it. However, some users, such as those handling inventory or marketing, need to see data about customers and product sold. Because most users will not need that data, but a few do, defining a relationship between **Sales Data** and the **F\_SALES** and **D\_STORE** tables makes sense.
Relationships in Sigma are directional and only support many-to-one or one-to-one joins, which means every row in the source table must have only one possible result in the target table. See [Define relationships in data models](/docs/define-relationships-in-data-models) for more information.
Create a one-to-one relationship with the **Sales Data** fact table and the **D\_PRODUCT** and **D\_CUSTOMER** dimension tables to allow users to access them without performing the join for each user:
1. From the **Add element** bar, select **Data** > **Table**.
2. Select the **RETAIL** > **PLUGS\_ELECTRONICS** > **D\_PRODUCT** table to add it to the data model. It appears below the **Sales Data** table.
3. Select the **Sales Data** table on the workbook page.
4. In the editor panel, under the **Modeling** tab, click **Add relationship**.
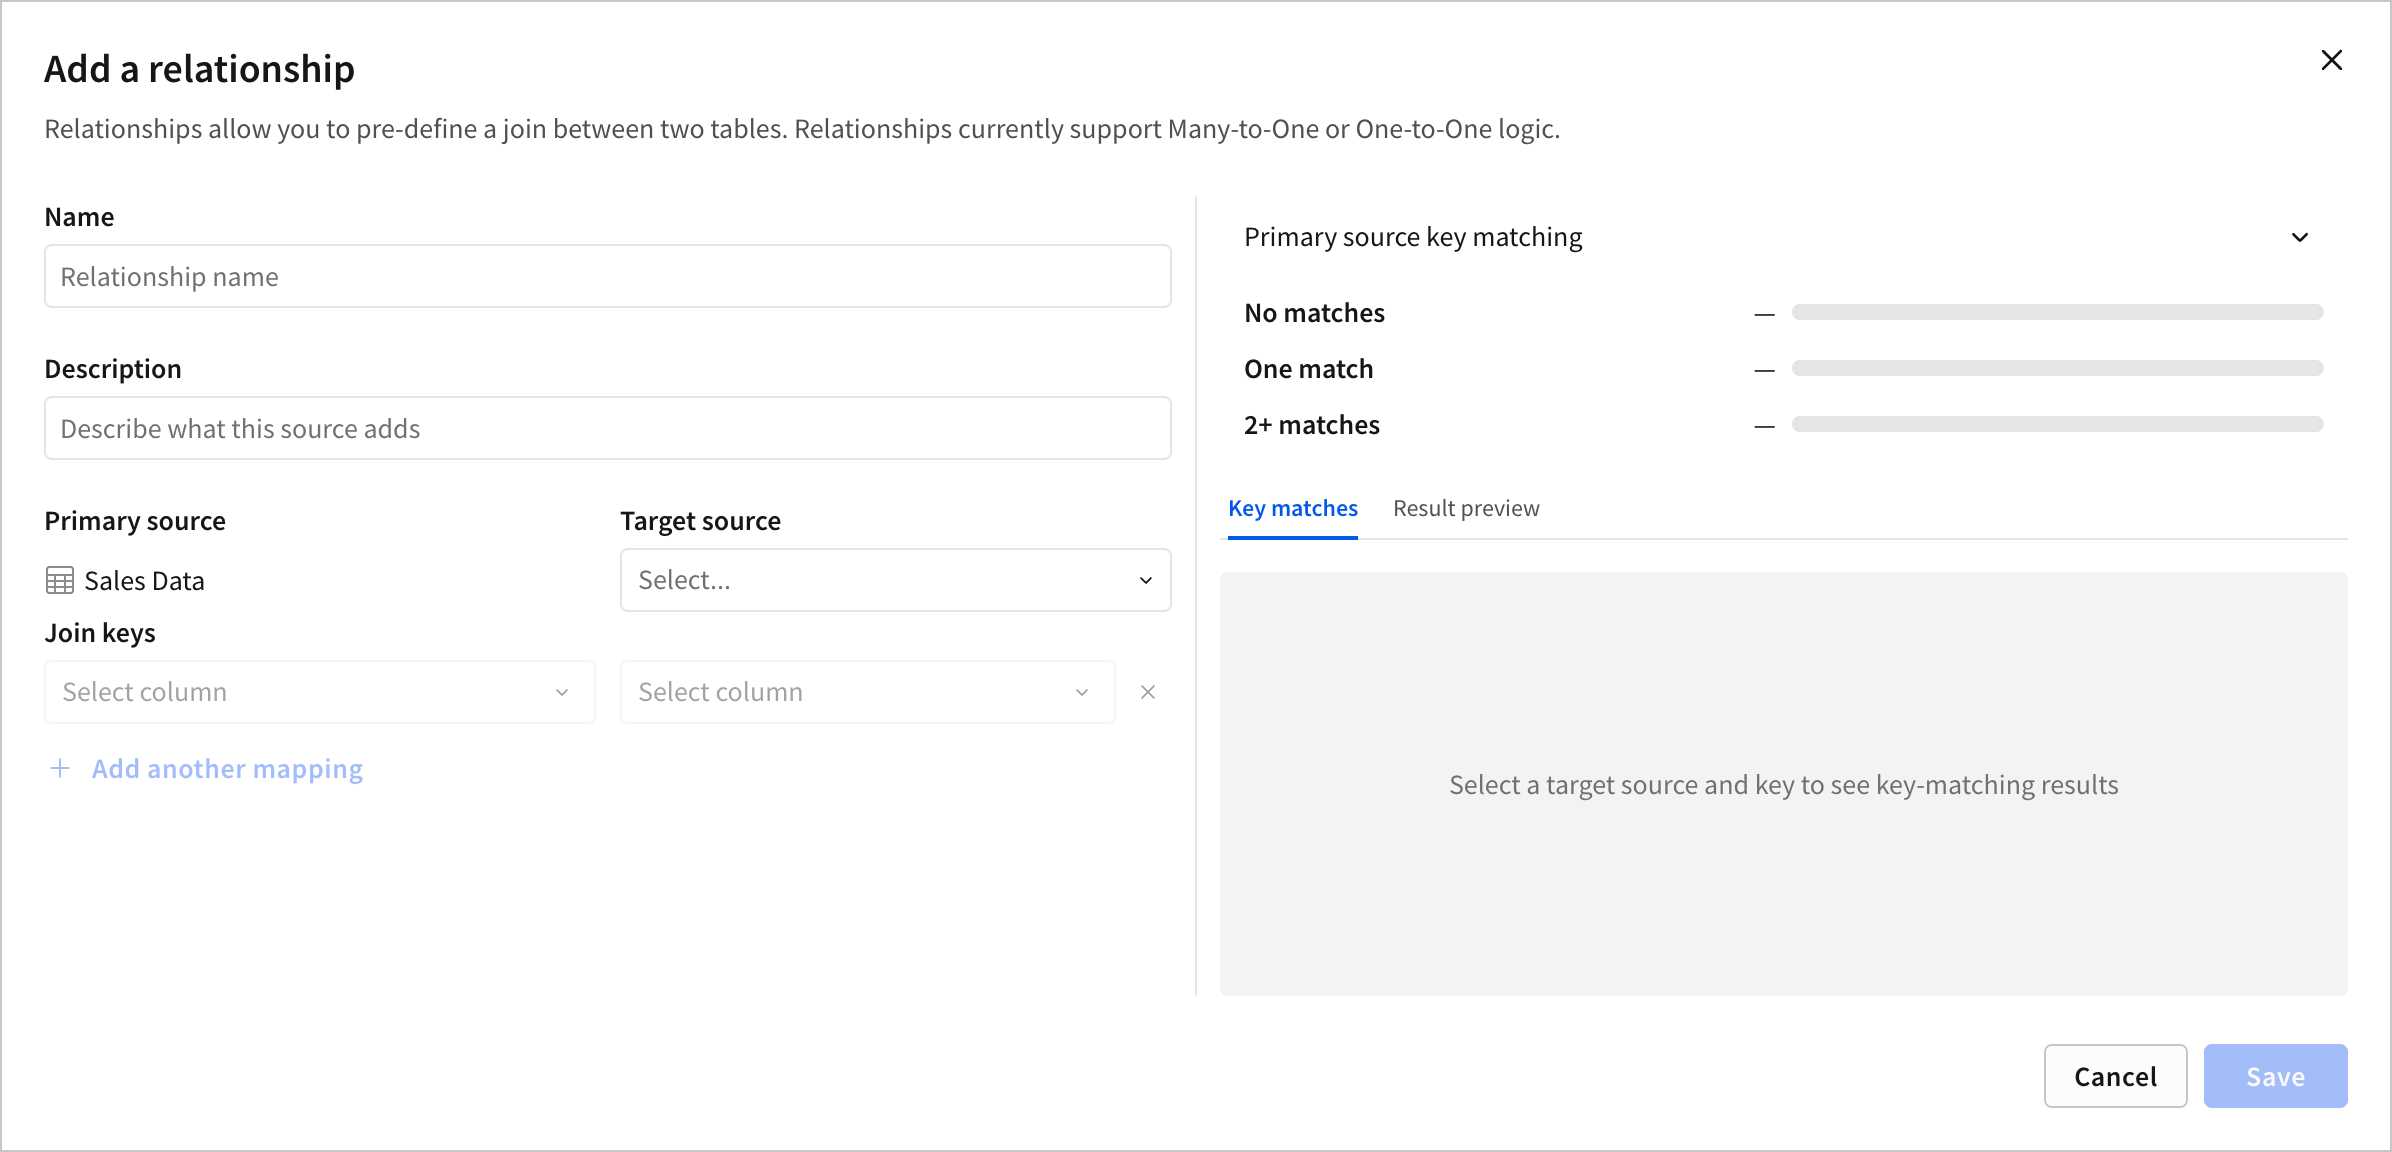
The **Add a relationship** modal opens.
5. Define a relationship between your original table and the **D\_PRODUCT** table.
1. In the **Name** field, enter `Product data`.
2. In the **Description** field, enter `Data about the product sold`.
3. Under **Target source**, select the **D\_PRODUCT** table.
4. For the **Join keys**, set both to **Product Key**.
5. Click **Save** to create the relationship.
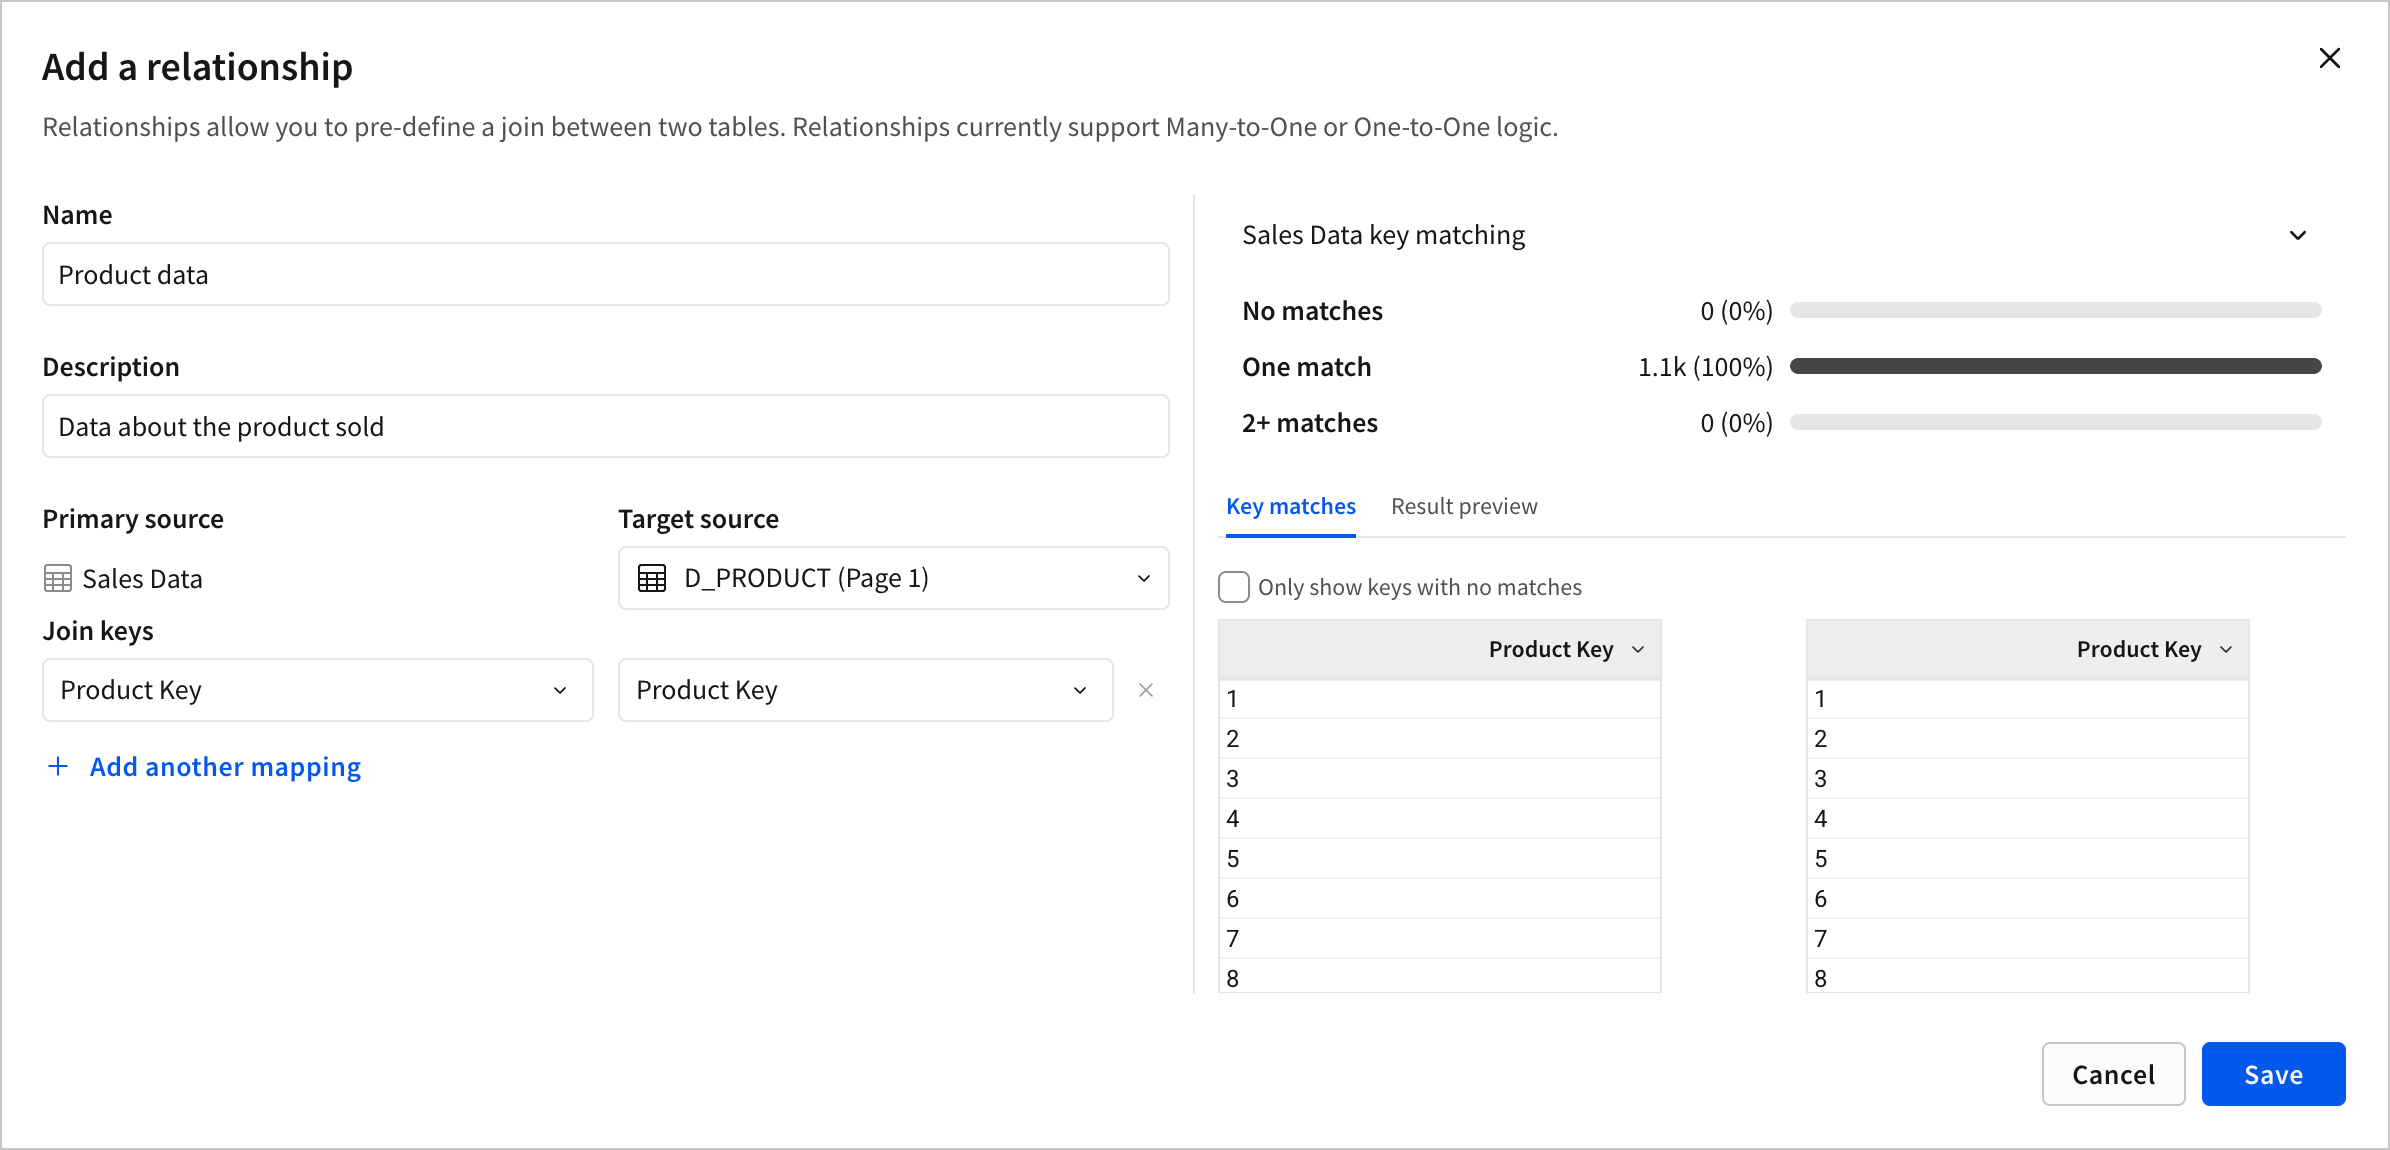
The table still looks the same, and no columns have been added yet. However, in the editor panel, the **Product data** relationship is listed in the **Relationships** section. When a user adds this data model as a data source to their workbook, they can access these related columns by adding them as source columns. See [Use related columns in a workbook](/docs/use-related-columns-in-a-workbook) for more information.
6. Repeat the above steps to define a relationship between the **Sales Data** table and the **D\_CUSTOMER** table using the following configuration:
* Target source: **D\_CUSTOMER**
* Relationship name: `Customer data`
* Join keys: **Customer Key**
Users who need to work with the **D\_PRODUCT** or **D\_CUSTOMER** data can now access it without needing to clutter the screen or perform expensive, time-consuming joins for users who do not need to see it. After the source columns have been added to a workbook, users can work with the data from the relationship as they would with any other data.
## Manage data visibility
This tutorial has covered a number of different ways to add more data to a data model for your business users to access in their explorations. However, data models are also equally useful for limiting what data your users can actually see and use when performing an analysis.
You can hide individual columns or even entire tables from view in the published version without affecting your ability to use them for calculations, metrics, or relationships. Hiding data allows you to clean up and curate your data model's columns for your downstream users but does not limit the amount of data you have access to when building a data model.
Managing data visibility differs from data security features such as row-level and column-level security. Hiding columns and tables in a data model limits the availability, but not your users' ability to access to the data. As such, hiding columns and data elements are not recommended methods of securing sensitive or confidential data. To learn about securing confidential data in Sigma, see [Configure column-level security](/docs/column-level-security) and [Set up row-level security](/docs/set-up-row-level-security).
### Hide a column
When you joined the **D\_STORE** and **D\_CUSTOMER** tables with the **F\_POINT\_OF\_SALE** table, a few columns, such as the **Store Json Field** column, were added that your business users do not need to see. However, the **Store Json Field** column stores a lot of valuable data that you might want to access as you continue to build your data model, so you do not want to delete it entirely. You can hide this column from your business users, making it unavailable in the overview page or any workbooks using your data model that do not have the hidden columns added as source columns.
Hide the **Store Json Field** column from your business users so they are not overwhelmed with this excess data:
1. Select the **Sales Data** table.
2. In the editor panel, select the **Properties** tab.
3. Click the down arrow () on the **Store Json Field** column.
4. Select **Hide column**.
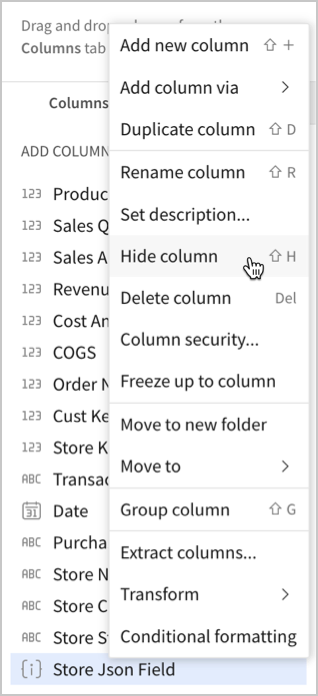
The **Store Json Field** column is no longer visible on the table to you or your users. Your users can no longer use it in calculations without adding it back to the table as a source column, but any metrics that reference the column are not affected.
You can also apply filters to a column or the entire table before publishing to limit the information displayed in the published view of the data model. These filters cannot be removed or changed by users using your data model in their workbooks downstream. See [Filter data in data elements](/docs/data-element-filters) for more information.
### Hide a data element as a source
You can also hide entire data elements from the published version of your data model to prevent those elements from being used as data sources downstream. Managing the visibility of entire data elements is helpful for when you create relationships between tables in your data model and only want the primary fact table to display when viewing the data model or choosing your data model as a data source in their workbook, such as with the **D\_PRODUCT** and **D\_CUSTOMER** tables in this data model. Users who need to use the related columns can add them as source columns, but the related table itself should not appear as an available data source.
Hide the **D\_PRODUCT** and **D\_CUSTOMER** tables to reduce clutter and ensure users can only access the columns through the **Product data** and **Customer data** relationships:
1. Select the **D\_PRODUCT** table on the data model page.
2. In the editor panel, select the **Modeling** tab.
3. Turn off the **Visible as source** toggle.
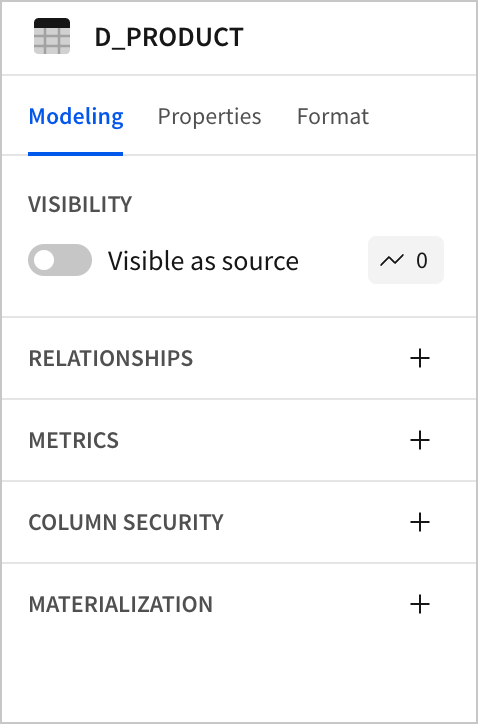
The **D\_PRODUCT** table is still visible in **Edit** mode.
4. Repeat the above steps to hide the **D\_CUSTOMER** table.
5. Click **Publish** and return to published view to confirm the **D\_PRODUCT** and **D\_CUSTOMER** tables have been hidden.
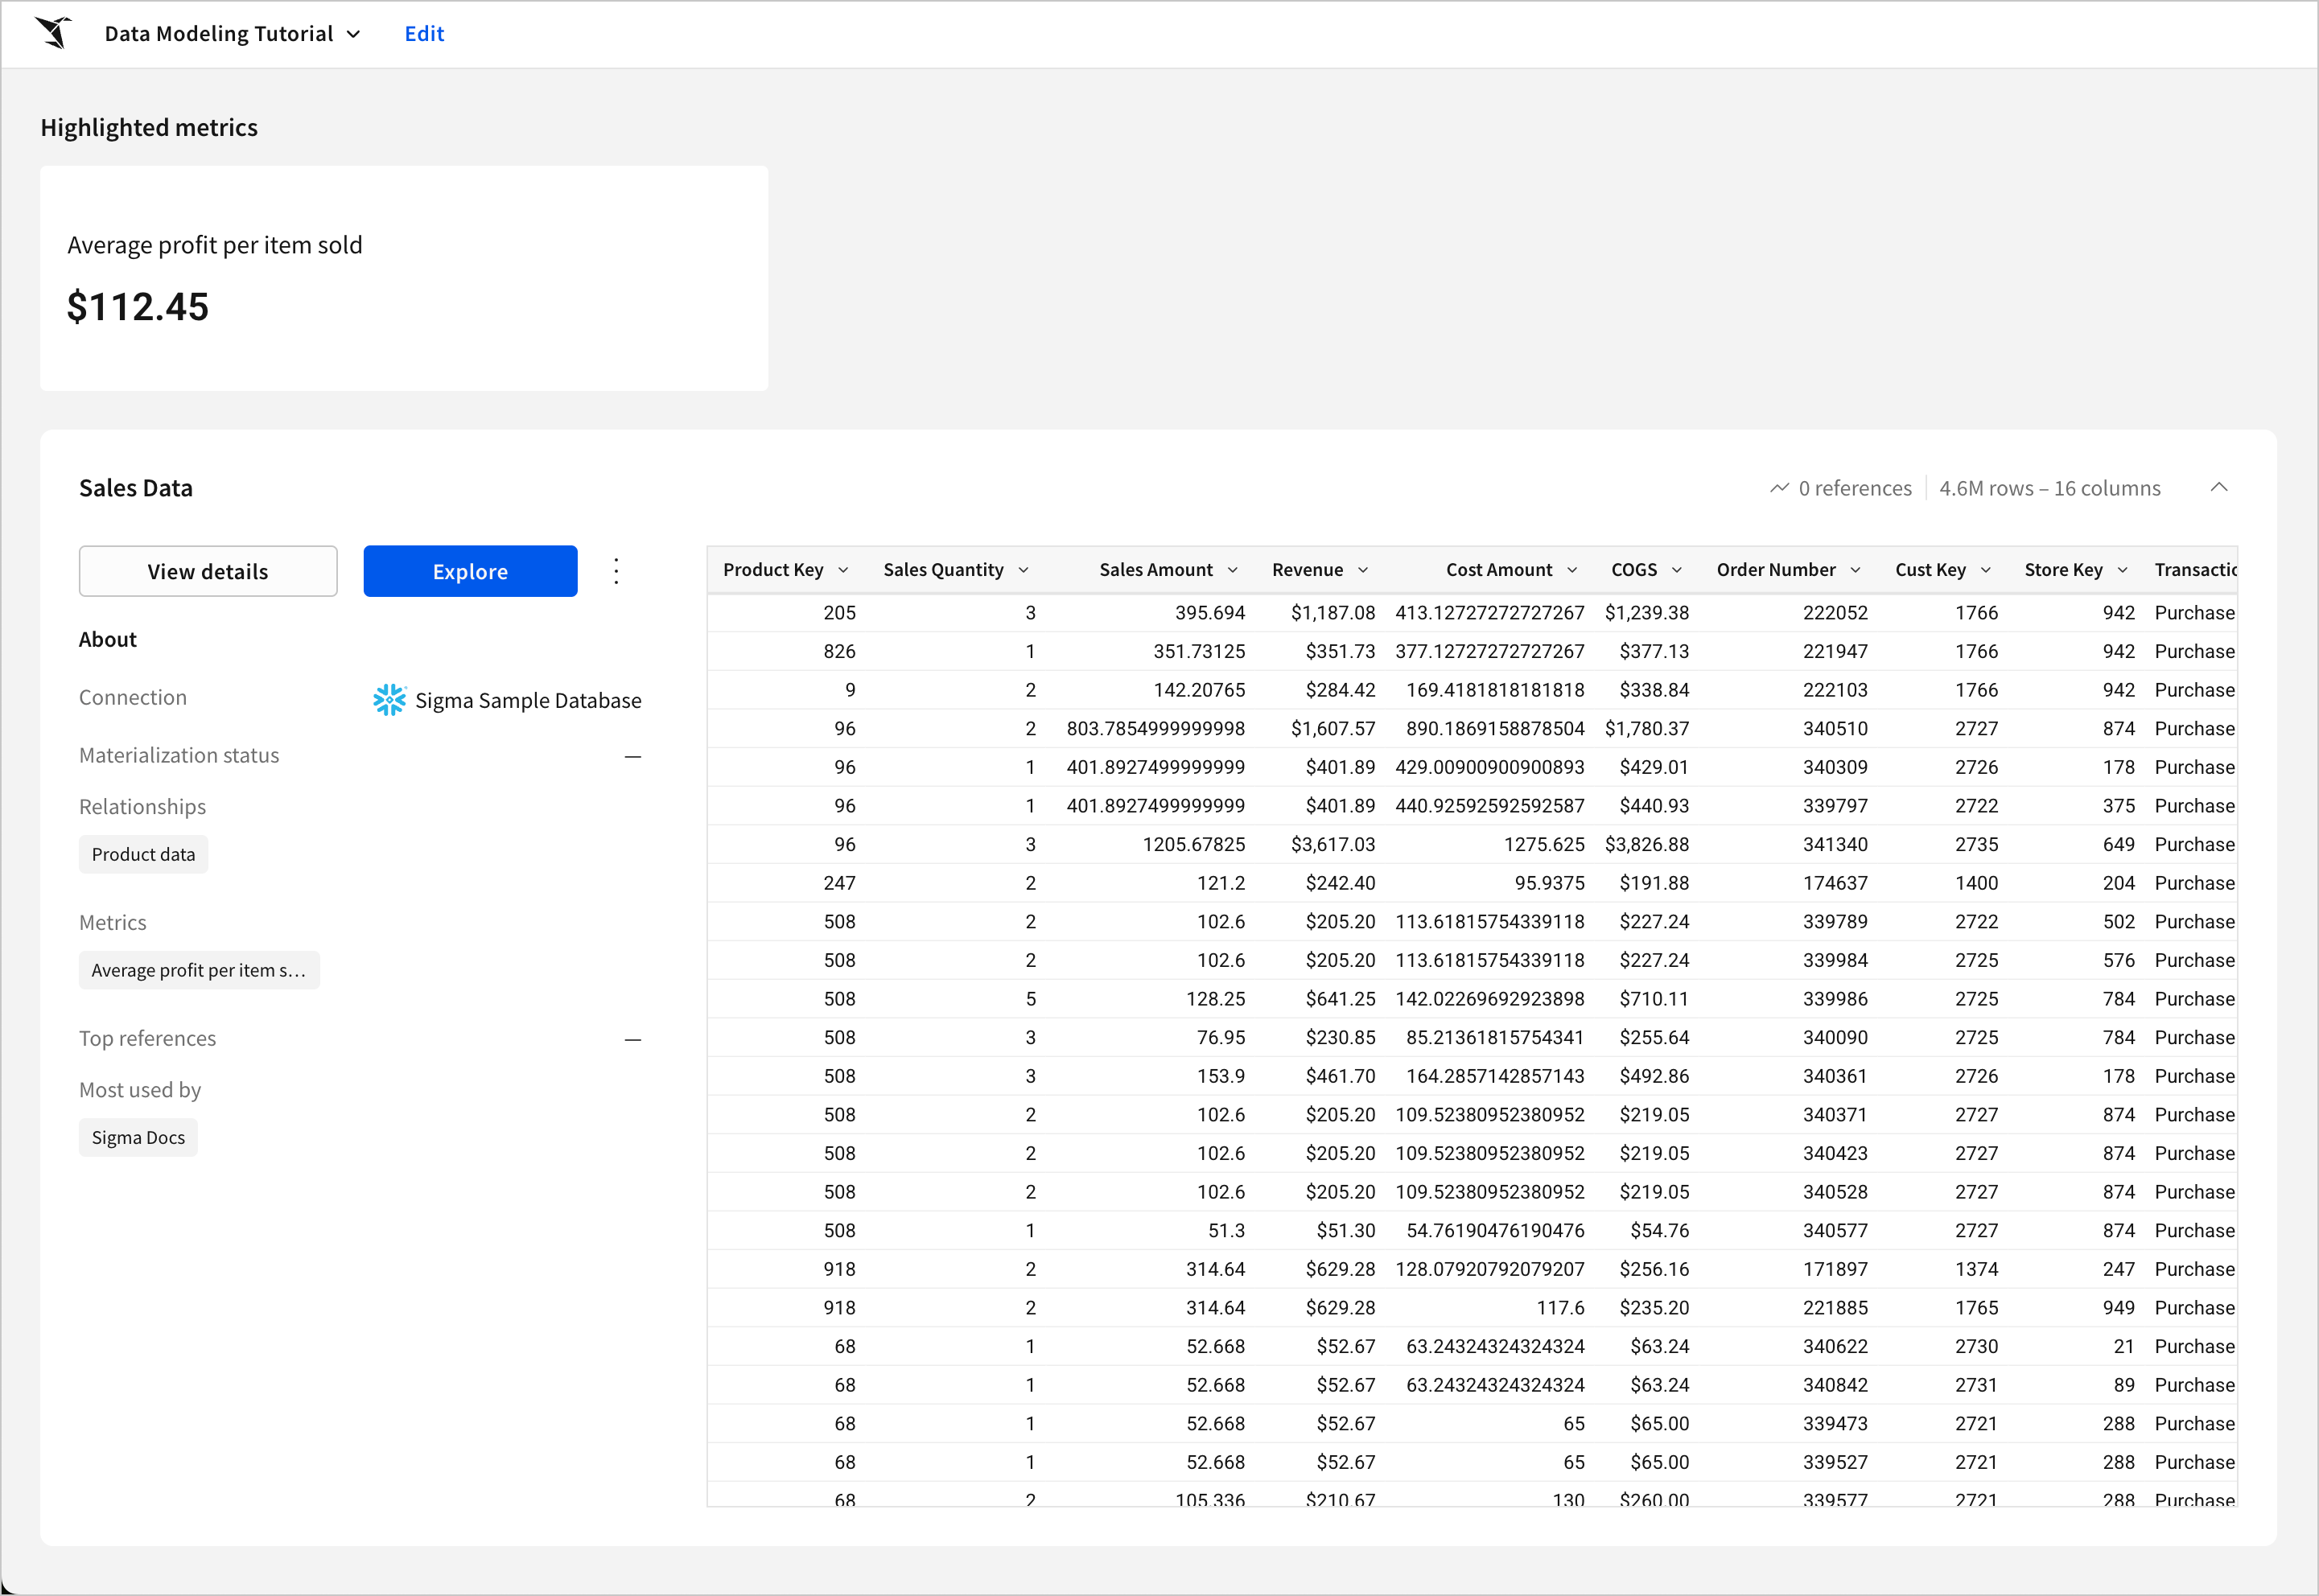
The **D\_PRODUCT** and **D\_CUSTOMER** tables are not visible from the data model overview, but the **Product data** and **Customer data** relationships are still available from the **Sales Data** table as source columns in workbooks that use this data model as a data source.
## Publish and share a data model
Once you have finished building your data model, the final step is to share it with your business users so they can begin using it in their own downstream applications and workbooks. However, because data models are likely to be used downstream as a crucial data source, it is important to properly prepare the data model for use by your downstream users before you actually grant them access.
### Add a description and badges to a data model
Sigma provides a number of ways to allow you to add additional context and information to your data model, such as badges and descriptions.
Badges and descriptions also provide more information that Sigma Assistant can use to answer queries. See [How Sigma Assistant selects data sources when answering user questions](/docs/configure-ai-features-for-your-organization#how-ask-sigma-selects-data-sources-when-answering-user-questions) for more information on how Sigma Assistant uses descriptions and badges.
#### Add a badge
Add an **Endorsed** badge with a badge note to your data model so users know it is updated and ready for use:
1. From the document menu, select **File** > **Set badge...** to open the **Set badge for data model** modal.
2. Under **Select badge**, select **Endorsed**.
3. In the **Badge note** text field, enter `This data model is ready to use.`
4. Click **Update** to add the badge and close the modal.
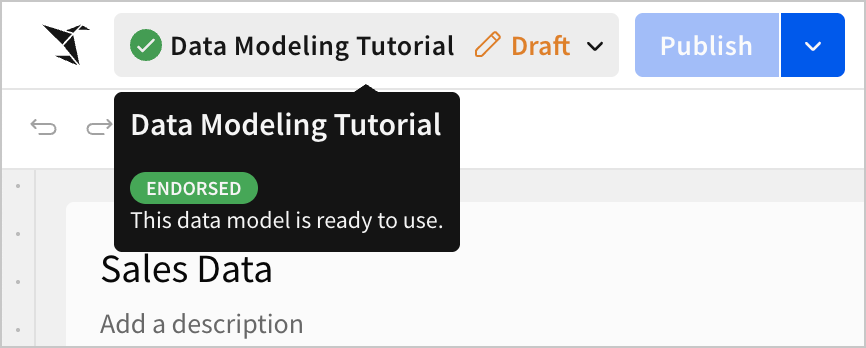
The **Endorsed** badge icon now appears before the data model name and the badge note displays when you mouse over the data model name.
#### Add a description
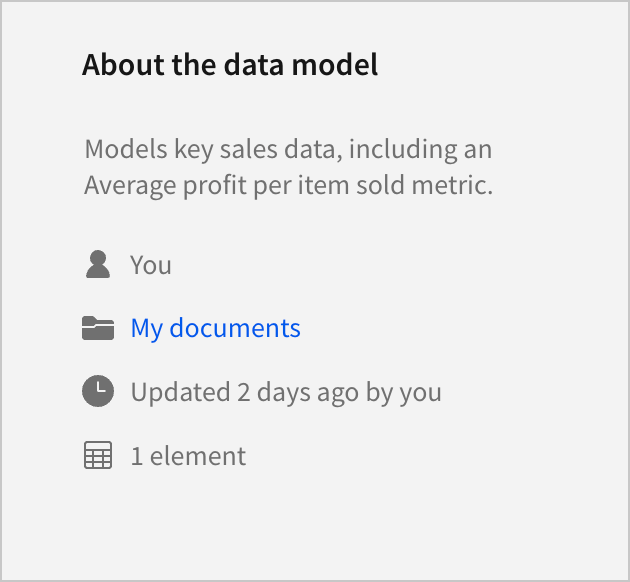
You can also add a description of your data model that displays, among other places, on the data model overview page and in a tooltip when you mouse over the data model's name in the document menu. You can use a data model description for displaying a list of procedures and best practices for using your data model, providing further metadata for search and discovery reasons, informing users of the data model creators and points of contact, and much more.
Add a brief description to your data model letting people know what it does:
1. Click **Publish** and return to the published version view.
2. Below **About the data model**, click the **Add a description** text field.
3. In the text field, enter `Models key sales data, including a total revenue metric` as the description.
### Grant access and share
Sigma provides a number of different options for configuring how your data model is shared. You can share it with individual users, give access to entire teams, or even invite people to your Sigma organization using their email address. From there, you can decide whether they have **Can view** or **Can edit** access to the data model. When you share a data model with a user, they can use it as a data source in their own workbooks.
1. In the data model header, select the document name to open the document menu, then select **Share...**.
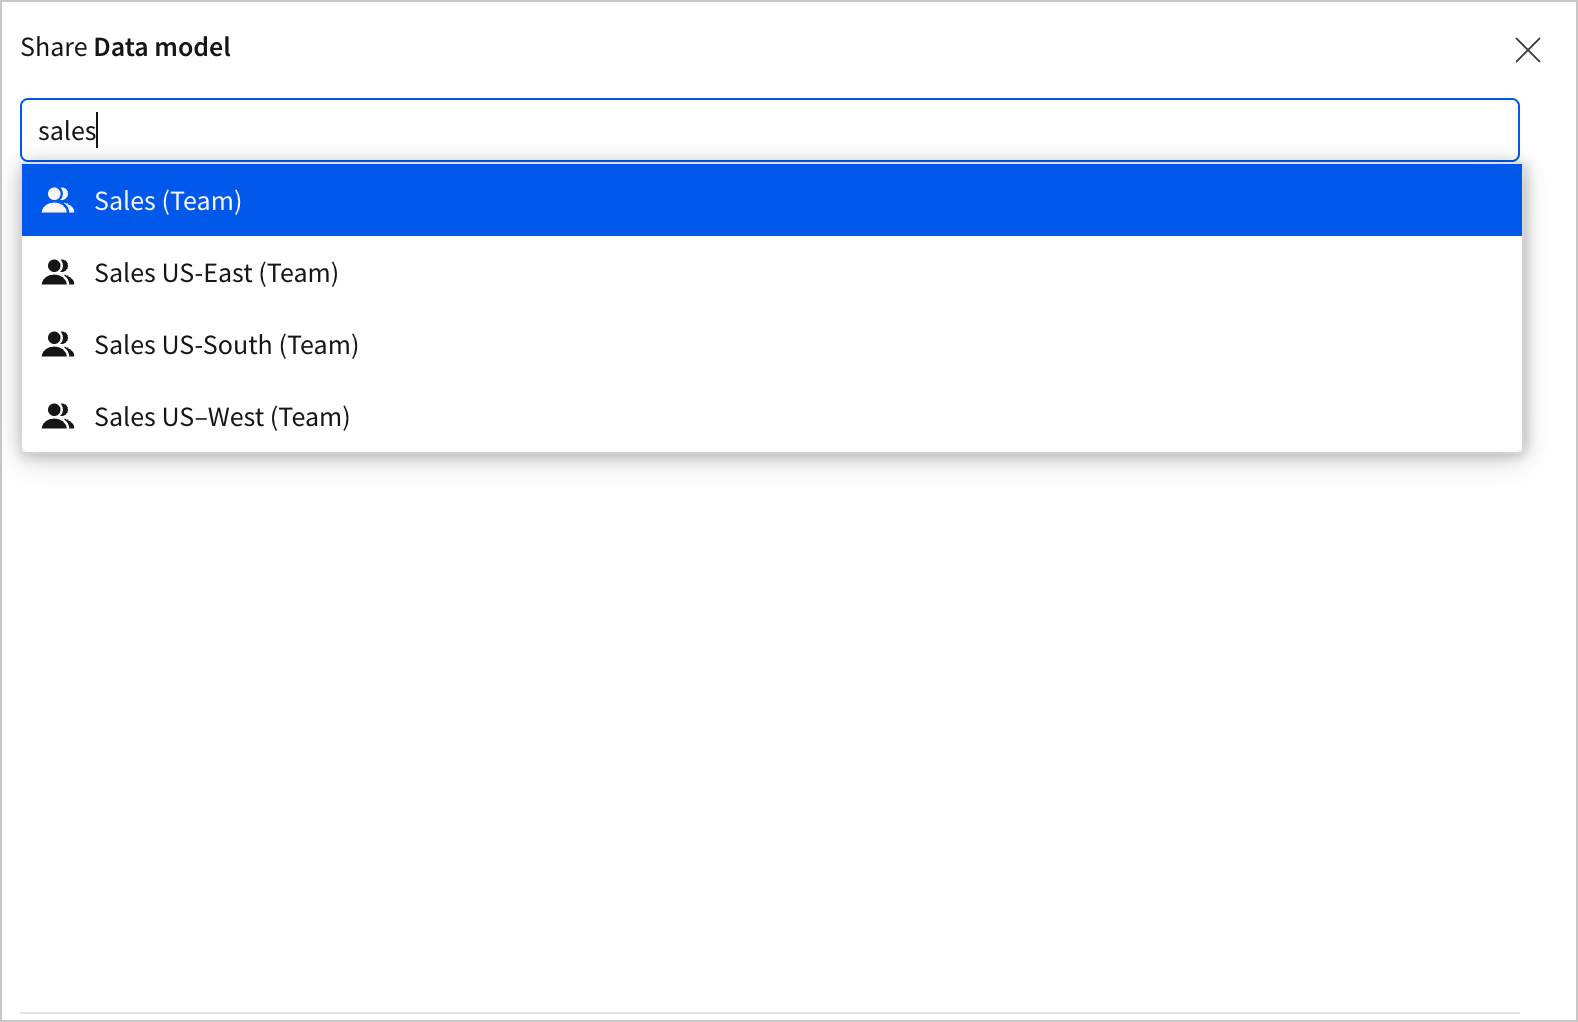
2. In the **Share Data model** modal, use the text field to search for the name of the desired user or team and select them when they appear.
3. Under **Permission**, select an option:
* **Can view** allows selected users to view and use the data model and its reusable elements.
* **Can edit** allows selected users to view, use, and edit the data model and its reusable elements.
4. (Optional) Check the **Send email** checkbox and enter a message for the email body in the **Add a message** text field.
5. Click **Share** to grant access to your data model.
Your data model is now shared with the users at your organization who need to work with it, and they can immediately begin creating downstream applications and [workbooks that use it as a data source](/docs/use-metrics-in-a-workbook).
## Conclusion
Your data model is now complete and ready for use downstream. The calculated columns and metrics you created ensure consistent calculations and analyses performed with this data model as a data source, and the metadata you added in the badge and description has made it easier to discover through browsing, search, and Sigma Assistant.
Now, you can begin adding more data through joins and relationships, create more complex metrics and calculated columns using the functions in the [function index](/docs/function-index), [visualize the data in workbooks using charts](/docs/intro-to-visualizations), [organize and structure the data for rapid review with pivot tables](/docs/working-with-pivot-tables), optimize your costs and enhance query performance by [scheduling materializations for your data model](/docs/schedule-materialization-for-a-data-model-or-workbook), and much more.
**More** on the element toolbar.
3. Click **Element source** > **Join** to open the **Select source** modal.

4. Select the **RETAIL** > **PLUGS\_ELECTRONICS** > **F\_SALES** table from the **Sigma Sample Database** connection to see a preview of the data.

5. Click **Select** to set the **F\_SALES** table as the join source and open the **Create join** page.
6. For **Join type,** ensure the default join type, **Left outer join**, is selected.
7. Set both join keys to the **Order Number** column.\

8. Click **Preview output** and verify that the columns from **F\_SALES** have been added and that they correctly align on their *Order Number* values.
9. Deselect the checkbox for **Order Number** under the **F\_SALES** section so there are no duplicate columns.
10. Click **Done** to return to the data model page. The columns from **F\_SALES** are now visible on the **F\_POINT\_OF\_SALE** table.

11. Join additional tables by clicking **More** on the element toolbar and selecting **Edit join** to open the **Create join** page.
12. Click **Add source** to open the **Select source** modal. Then, repeat the steps above for the **D\_STORE** table using the following configuration:
* Join keys: **Store Key**
* Columns: **Store Name, Store City, Store State, Store Json Field**
For **D\_STORE**, make sure that **Join with** is set to **F\_SALES** and not **F\_POINT\_OF\_SALE** to ensure proper results.

The new columns from the **F\_SALES** and **D\_STORE** tables have been added to the original **F\_POINT\_OF\_SALE** table, and the table's name has been changed to **F\_POINT\_OF\_SALE + 2** to indicate that two tables have been joined with the **F\_POINT\_OF\_SALE** table.
Rename the table to make it easier to work with as you continue building the data model and also easier for your business users to identify as a data source downstream:
1. In the editor panel, double-click on the **F\_POINT\_OF\_SALE** title to edit the table name.
2. Enter `Sales Data` as the table's name.
3. Click **Publish**.
### Create relationships between tables
Most of the people using your data model are interested only in the data you added from **F\_SALES** and **D\_STORE**, and you do not want to overwhelm them with unneeded data or perform large, potentially costly joins each time they view it. However, some users, such as those handling inventory or marketing, need to see data about customers and product sold. Because most users will not need that data, but a few do, defining a relationship between **Sales Data** and the **F\_SALES** and **D\_STORE** tables makes sense.
Relationships in Sigma are directional and only support many-to-one or one-to-one joins, which means every row in the source table must have only one possible result in the target table. See [Define relationships in data models](/docs/define-relationships-in-data-models) for more information.
Create a one-to-one relationship with the **Sales Data** fact table and the **D\_PRODUCT** and **D\_CUSTOMER** dimension tables to allow users to access them without performing the join for each user:
1. From the **Add element** bar, select **Data** > **Table**.
2. Select the **RETAIL** > **PLUGS\_ELECTRONICS** > **D\_PRODUCT** table to add it to the data model. It appears below the **Sales Data** table.
3. Select the **Sales Data** table on the workbook page.
4. In the editor panel, under the **Modeling** tab, click **Add relationship**.

The **Add a relationship** modal opens.
5. Define a relationship between your original table and the **D\_PRODUCT** table.
1. In the **Name** field, enter `Product data`.
2. In the **Description** field, enter `Data about the product sold`.
3. Under **Target source**, select the **D\_PRODUCT** table.
4. For the **Join keys**, set both to **Product Key**.
5. Click **Save** to create the relationship.

The table still looks the same, and no columns have been added yet. However, in the editor panel, the **Product data** relationship is listed in the **Relationships** section. When a user adds this data model as a data source to their workbook, they can access these related columns by adding them as source columns. See [Use related columns in a workbook](/docs/use-related-columns-in-a-workbook) for more information.
6. Repeat the above steps to define a relationship between the **Sales Data** table and the **D\_CUSTOMER** table using the following configuration:
* Target source: **D\_CUSTOMER**
* Relationship name: `Customer data`
* Join keys: **Customer Key**
Users who need to work with the **D\_PRODUCT** or **D\_CUSTOMER** data can now access it without needing to clutter the screen or perform expensive, time-consuming joins for users who do not need to see it. After the source columns have been added to a workbook, users can work with the data from the relationship as they would with any other data.
## Manage data visibility
This tutorial has covered a number of different ways to add more data to a data model for your business users to access in their explorations. However, data models are also equally useful for limiting what data your users can actually see and use when performing an analysis.
You can hide individual columns or even entire tables from view in the published version without affecting your ability to use them for calculations, metrics, or relationships. Hiding data allows you to clean up and curate your data model's columns for your downstream users but does not limit the amount of data you have access to when building a data model.
Managing data visibility differs from data security features such as row-level and column-level security. Hiding columns and tables in a data model limits the availability, but not your users' ability to access to the data. As such, hiding columns and data elements are not recommended methods of securing sensitive or confidential data. To learn about securing confidential data in Sigma, see [Configure column-level security](/docs/column-level-security) and [Set up row-level security](/docs/set-up-row-level-security).
### Hide a column
When you joined the **D\_STORE** and **D\_CUSTOMER** tables with the **F\_POINT\_OF\_SALE** table, a few columns, such as the **Store Json Field** column, were added that your business users do not need to see. However, the **Store Json Field** column stores a lot of valuable data that you might want to access as you continue to build your data model, so you do not want to delete it entirely. You can hide this column from your business users, making it unavailable in the overview page or any workbooks using your data model that do not have the hidden columns added as source columns.
Hide the **Store Json Field** column from your business users so they are not overwhelmed with this excess data:
1. Select the **Sales Data** table.
2. In the editor panel, select the **Properties** tab.
3. Click the down arrow () on the **Store Json Field** column.
4. Select **Hide column**.

The **Store Json Field** column is no longer visible on the table to you or your users. Your users can no longer use it in calculations without adding it back to the table as a source column, but any metrics that reference the column are not affected.
You can also apply filters to a column or the entire table before publishing to limit the information displayed in the published view of the data model. These filters cannot be removed or changed by users using your data model in their workbooks downstream. See [Filter data in data elements](/docs/data-element-filters) for more information.
### Hide a data element as a source
You can also hide entire data elements from the published version of your data model to prevent those elements from being used as data sources downstream. Managing the visibility of entire data elements is helpful for when you create relationships between tables in your data model and only want the primary fact table to display when viewing the data model or choosing your data model as a data source in their workbook, such as with the **D\_PRODUCT** and **D\_CUSTOMER** tables in this data model. Users who need to use the related columns can add them as source columns, but the related table itself should not appear as an available data source.
Hide the **D\_PRODUCT** and **D\_CUSTOMER** tables to reduce clutter and ensure users can only access the columns through the **Product data** and **Customer data** relationships:
1. Select the **D\_PRODUCT** table on the data model page.
2. In the editor panel, select the **Modeling** tab.
3. Turn off the **Visible as source** toggle.

The **D\_PRODUCT** table is still visible in **Edit** mode.
4. Repeat the above steps to hide the **D\_CUSTOMER** table.
5. Click **Publish** and return to published view to confirm the **D\_PRODUCT** and **D\_CUSTOMER** tables have been hidden.

The **D\_PRODUCT** and **D\_CUSTOMER** tables are not visible from the data model overview, but the **Product data** and **Customer data** relationships are still available from the **Sales Data** table as source columns in workbooks that use this data model as a data source.
## Publish and share a data model
Once you have finished building your data model, the final step is to share it with your business users so they can begin using it in their own downstream applications and workbooks. However, because data models are likely to be used downstream as a crucial data source, it is important to properly prepare the data model for use by your downstream users before you actually grant them access.
### Add a description and badges to a data model
Sigma provides a number of ways to allow you to add additional context and information to your data model, such as badges and descriptions.
Badges and descriptions also provide more information that Sigma Assistant can use to answer queries. See [How Sigma Assistant selects data sources when answering user questions](/docs/configure-ai-features-for-your-organization#how-ask-sigma-selects-data-sources-when-answering-user-questions) for more information on how Sigma Assistant uses descriptions and badges.
#### Add a badge
Add an **Endorsed** badge with a badge note to your data model so users know it is updated and ready for use:
1. From the document menu, select **File** > **Set badge...** to open the **Set badge for data model** modal.
2. Under **Select badge**, select **Endorsed**.
3. In the **Badge note** text field, enter `This data model is ready to use.`
4. Click **Update** to add the badge and close the modal.
The **Endorsed** badge icon now appears before the data model name and the badge note displays when you mouse over the data model name.

#### Add a description
You can also add a description of your data model that displays, among other places, on the data model overview page and in a tooltip when you mouse over the data model's name in the document menu. You can use a data model description for displaying a list of procedures and best practices for using your data model, providing further metadata for search and discovery reasons, informing users of the data model creators and points of contact, and much more.
Add a brief description to your data model letting people know what it does:
1. Click **Publish** and return to the published version view.
2. Below **About the data model**, click the **Add a description** text field.
3. In the text field, enter `Models key sales data, including a total revenue metric` as the description.

### Grant access and share
Sigma provides a number of different options for configuring how your data model is shared. You can share it with individual users, give access to entire teams, or even invite people to your Sigma organization using their email address. From there, you can decide whether they have **Can view** or **Can edit** access to the data model. When you share a data model with a user, they can use it as a data source in their own workbooks.
1. In the data model header, select the document name to open the document menu, then select **Share...**.
2. In the **Share Data model** modal, use the text field to search for the name of the desired user or team and select them when they appear.

3. Under **Permission**, select an option:
* **Can view** allows selected users to view and use the data model and its reusable elements.
* **Can edit** allows selected users to view, use, and edit the data model and its reusable elements.
4. (Optional) Check the **Send email** checkbox and enter a message for the email body in the **Add a message** text field.
5. Click **Share** to grant access to your data model.
Your data model is now shared with the users at your organization who need to work with it, and they can immediately begin creating downstream applications and [workbooks that use it as a data source](/docs/use-metrics-in-a-workbook).
## Conclusion
Your data model is now complete and ready for use downstream. The calculated columns and metrics you created ensure consistent calculations and analyses performed with this data model as a data source, and the metadata you added in the badge and description has made it easier to discover through browsing, search, and Sigma Assistant.
Now, you can begin adding more data through joins and relationships, create more complex metrics and calculated columns using the functions in the [function index](/docs/function-index), [visualize the data in workbooks using charts](/docs/intro-to-visualizations), [organize and structure the data for rapid review with pivot tables](/docs/working-with-pivot-tables), optimize your costs and enhance query performance by [scheduling materializations for your data model](/docs/schedule-materialization-for-a-data-model-or-workbook), and much more.