> For clean Markdown of any page, append .md to the page URL.
> For a complete documentation index, see https://help.sigmacomputing.com/llms.txt.
> For AI client integration (Claude Code, Cursor, etc.), connect to the MCP server at https://help.sigmacomputing.com/_mcp/server.
# Create and manage metrics
A metric is a custom aggregate calculation that can be reused across data elements that share a data source. If you define metrics in data models, datasets, or tables from a connected database or catalog, you can help users perform calculations in a consistent way both easily and efficiently.
This document explains how to create and manage metrics for improved metrics governance. For information about using metrics in workbook data elements, see [Use metrics in a workbook](/docs/use-metrics-in-a-workbook).
For more details about metrics, including limitations and best practices, see [About metrics](/docs/about-metrics).
## User requirements
The ability to create and manage metrics in *data models* requires the following:
* You must be assigned an [account type](/docs/account-type-and-license-overview) with the **Create, edit, and publish data models** permission enabled.
* You must be the dataset owner or be granted **Can edit** [access](/docs/folder-and-document-permissions) to the data model.
The ability to create and manage metrics in *datasets* requires the following:
* You must be assigned an [account type](/docs/account-type-and-license-overview) with the **Create, edit, and publish data models** permission enabled.
* You must be the dataset owner or be granted **Can edit** [access](/docs/folder-and-document-permissions) to the dataset.
The ability to create and manage metrics in *database or catalog tables* requires the following:
* You must be be granted **Can use & annotate** [data access](/docs/data-permissions-overview) for the specific table, or you must inherit the permission granted at the applicable connection, database or catalog, or schema level.
## Work with metrics in data models
Add, highlight, and update metrics in data models.
### Create a metric in a data model
1. Open the data model for editing.
2. Select the data model element that you want to add a metric to.
3. In the editor panel, select the **Modeling** tab.
If you don't see a **Modeling** tab, you can also add a metric in the **Metrics** tab of the **Element Properties**.
4. In the **Metrics** section, select **+** (**Add metric**).
The **Add a metric** modal appears.
5. In the **Name** field, enter a name to use for the metric.
6. In the **Description** field, enter a description about what the metric does. The description appears when a user hovers over the metric.
7. In the **Formula** field, define the metric logic. You can use Sigma functions, reference any column in the data model table, or reference another metric.
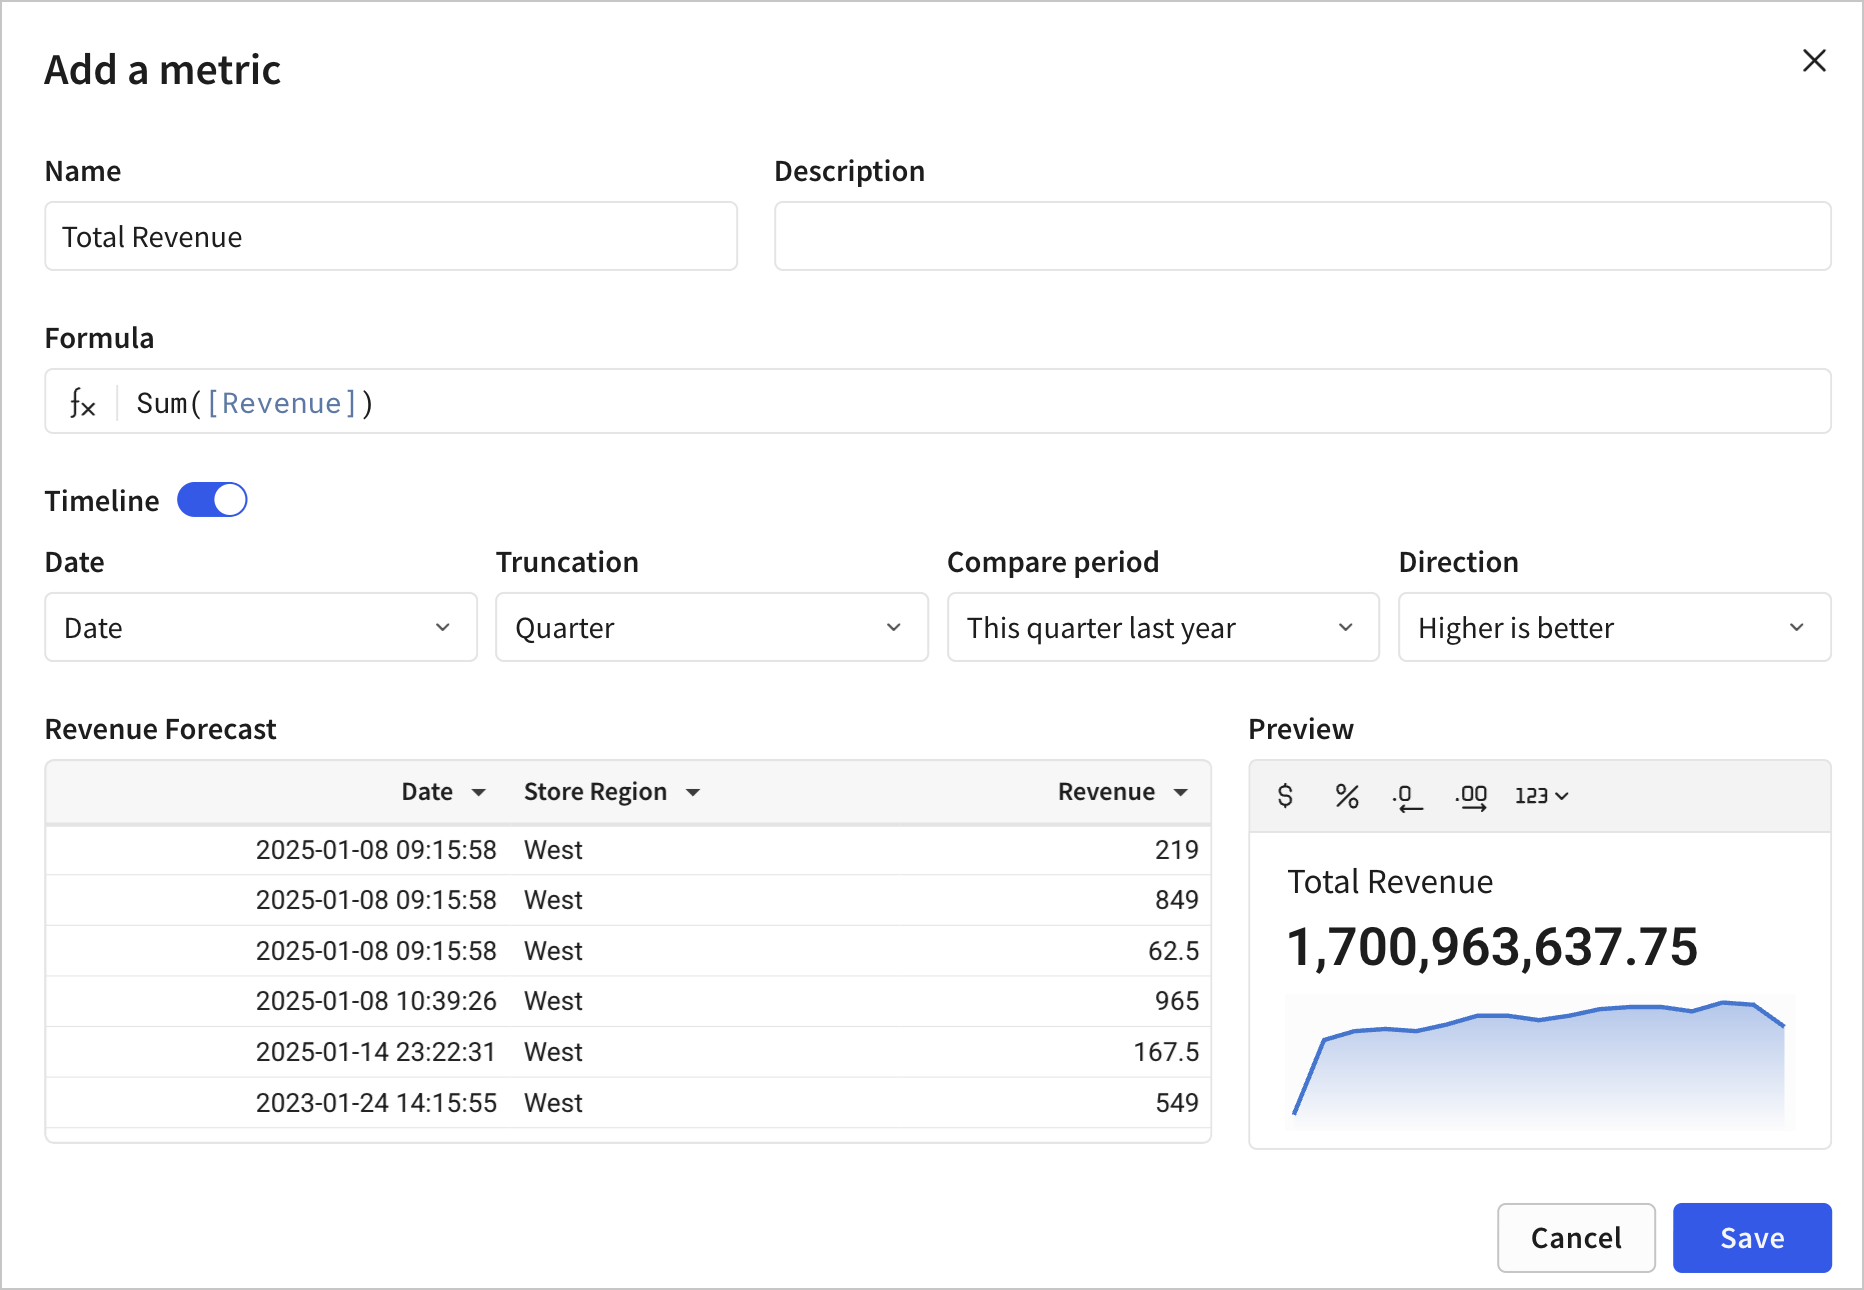
8. \[optional] Turn on the **Timeline** switch to display a timeline for the metric on the [data model overview](/docs/navigate-data-models#data-model-overview-page) page.
1. For **Date**, choose a date column in your data to use for the timeline.
2. For **Truncation**, choose how you want to truncate the date, or choose to remove the date truncation and use the existing granularity of the date column.
3. \[optional] For **Compare period**, choose the comparison period for the metric, or choose **None**.
4. \[optional] For **Direction**, choose the direction for the comparison trend, or choose **None**.
9. Review the **Preview** for your metric and optionally define a format for the output of the metric.
For example, you can specify the formula result as a currency or a percentage, set the number of decimal places, or select options from the full format menu by clicking the number format menu ( ).
Metrics define aggregate calculations. If the preview displays a null value, your formula might be missing an aggregate function, such as `Sum()`, `Avg()`, or `Count()`. For more information, see [Aggregate functions](/docs/aggregate-functions).
10. Publish the data model to make the changes available downstream.
### Highlight a metric in the data model overview
By default, up to six metrics that you create in a data model appear on the [data model overview](/docs/navigate-data-models#data-model-overview-page) page. To change which metrics appear, you can choose to highlight specific metrics on the overview page and display only those.
1. Open the data model for editing.
2. Select the data model element that you want to add a metric to.
3. In the editor panel, select the **Modeling** tab.
4. In the **Modeling** tab of the editor panel, in the **Metrics** section, locate the metric.
5. For the metric, click **More** (
).
Metrics define aggregate calculations. If the preview displays a null value, your formula might be missing an aggregate function, such as `Sum()`, `Avg()`, or `Count()`. For more information, see [Aggregate functions](/docs/aggregate-functions).
10. Publish the data model to make the changes available downstream.
### Highlight a metric in the data model overview
By default, up to six metrics that you create in a data model appear on the [data model overview](/docs/navigate-data-models#data-model-overview-page) page. To change which metrics appear, you can choose to highlight specific metrics on the overview page and display only those.
1. Open the data model for editing.
2. Select the data model element that you want to add a metric to.
3. In the editor panel, select the **Modeling** tab.
4. In the **Modeling** tab of the editor panel, in the **Metrics** section, locate the metric.
5. For the metric, click **More** ( ), then select **Highlight in overview**.
6. Publish the data model to make the changes available.
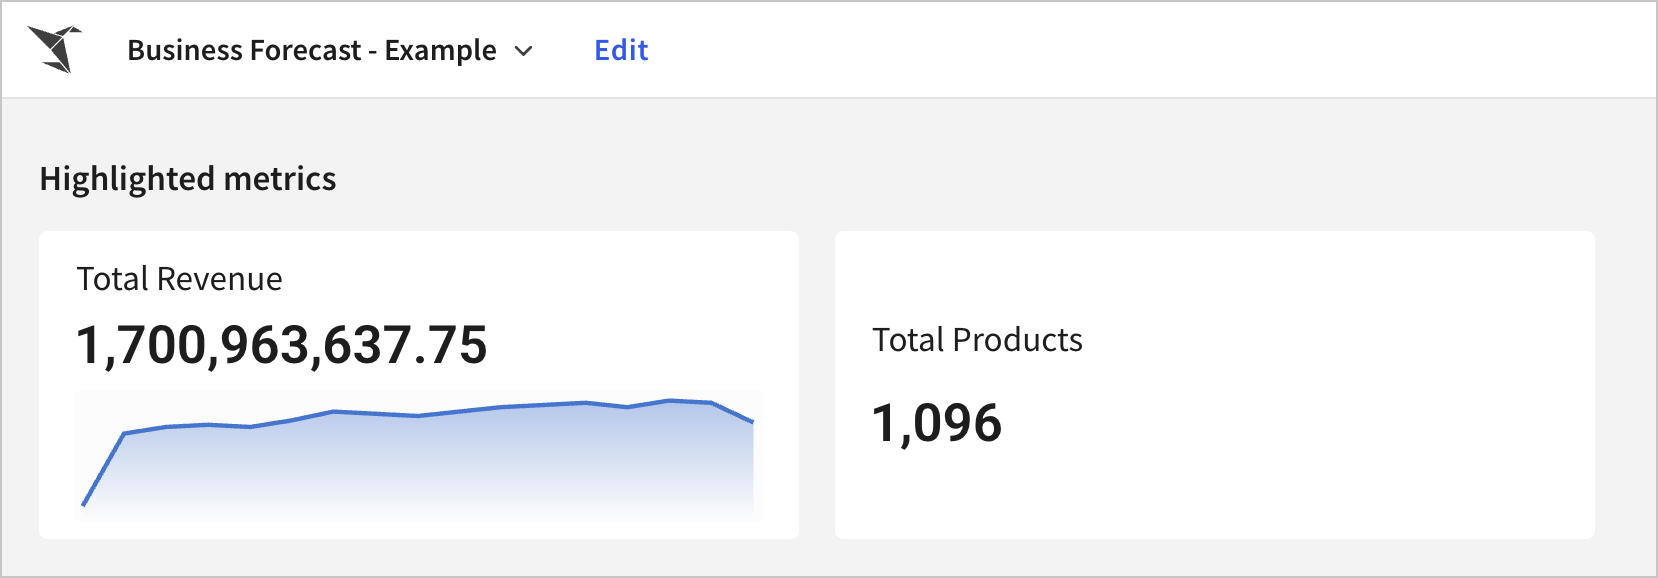
Highlighted metrics can be explored by anyone with access to the data model. For more details, see [Navigate data models](/docs/navigate-data-models).
### Edit a metric in a data model
To modify a metric, do the following:
1. Open the data model for editing.
2. Select the table on which the metric is defined.
3. In the **Modeling** tab of the editor panel, in the **Metrics** section, locate the metric.
4. Click
), then select **Highlight in overview**.
6. Publish the data model to make the changes available.

Highlighted metrics can be explored by anyone with access to the data model. For more details, see [Navigate data models](/docs/navigate-data-models).
### Edit a metric in a data model
To modify a metric, do the following:
1. Open the data model for editing.
2. Select the table on which the metric is defined.
3. In the **Modeling** tab of the editor panel, in the **Metrics** section, locate the metric.
4. Click  (**Edit metric...**).
5. Make any desired changes, then click **Save**.
6. Publish the data model to make the changes available downstream.
Columns and metrics that use the metric update to use the revised metric.
### Delete a metric in a data model
To delete a metric, do the following:
1. Open the data model for editing.
2. Select the table on which the metric is defined.
3. In the **Modeling** tab of the editor panel, in the **Metrics** section, locate the metric.
4. For the metric, click **More** (), then select **Delete**.
5. Publish the data model to make the changes available downstream.
Any columns or metrics that rely on the deleted metric display an error.
### Configure a default timeline for metrics
You can define a default configuration for metric timelines and comparisons in your data model. A default timeline configuration allows you to specify a consistent date column, truncation, comparison period, and comparison direction for metrics created on a data element.
Default metric timelines only apply to metrics in the data model they are defined in. If you use a metric in a document, such as a workbook or report, the default timeline is not inherited.
#### Add a default timeline for metrics
You can specify a default timeline configuration for all metrics created on a data element to use. When you add a default timeline, all new metrics and metrics without a timeline configured apply the default timeline. Existing metrics with a timeline already defined are not affected.
1. Select the data element in the data model that you want to configure a default timeline for.
2. In the editor panel, select the **Modeling** tab.
3. In the **Metrics** section of the **Modeling** tab, click
(**Edit metric...**).
5. Make any desired changes, then click **Save**.
6. Publish the data model to make the changes available downstream.
Columns and metrics that use the metric update to use the revised metric.
### Delete a metric in a data model
To delete a metric, do the following:
1. Open the data model for editing.
2. Select the table on which the metric is defined.
3. In the **Modeling** tab of the editor panel, in the **Metrics** section, locate the metric.
4. For the metric, click **More** (), then select **Delete**.
5. Publish the data model to make the changes available downstream.
Any columns or metrics that rely on the deleted metric display an error.
### Configure a default timeline for metrics
You can define a default configuration for metric timelines and comparisons in your data model. A default timeline configuration allows you to specify a consistent date column, truncation, comparison period, and comparison direction for metrics created on a data element.
Default metric timelines only apply to metrics in the data model they are defined in. If you use a metric in a document, such as a workbook or report, the default timeline is not inherited.
#### Add a default timeline for metrics
You can specify a default timeline configuration for all metrics created on a data element to use. When you add a default timeline, all new metrics and metrics without a timeline configured apply the default timeline. Existing metrics with a timeline already defined are not affected.
1. Select the data element in the data model that you want to configure a default timeline for.
2. In the editor panel, select the **Modeling** tab.
3. In the **Metrics** section of the **Modeling** tab, click  **Configure metrics** to open the **Configure metrics** popover.
4. Turn on the **Enable default timeline** toggle.
5. For **Date**, choose a date column from the table to use for the default timeline.
6. (Optional) For **Truncation**, choose the default date truncation, or choose to remove the date truncation and use the existing granularity of the date column.
7. (Optional) For **Comparison period**, choose the default comparison period, or choose **None**.
8. (Optional) For **Direction**, choose the default direction for the comparison trend, or choose **None**.
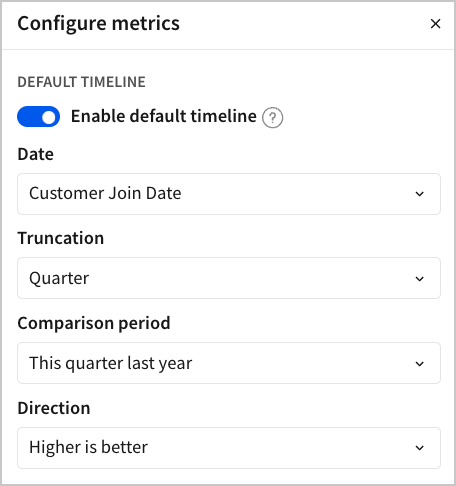
You can override the default timeline for a metric in the **Add a metric** or **Edit metric** modal by changing the timeline settings or turning off the **Timeline** toggle. If you want a metric with a manually-configured timeline to use the default timeline configuration, click **Reset to default** in the **Add a metric** or **Edit metric** modal.
#### Manage a default timeline for metrics
You can edit the default timeline configuration for metrics created on a data element, or turn it off entirely.
When you edit a default timeline for a data element, all metrics for that data element without manually-configured timelines update to reflect the new default timeline settings. If you turn off a default timeline for a data element, all metrics for that data element without manually-configured timelines update to no longer have timelines configured.
1. Select the data element in the data model that you want to configure a default timeline for.
2. In the editor panel, select the **Modeling** tab.
3. In the **Metrics** section of the **Modeling** tab, click **Configure metrics** to open the **Configure metrics** popover.
4. Configure the default metric timeline:
* To turn off the default timeline, turn off the **Enable default timeline** toggle.
* To modify the default timeline, change the selections under **Date**, **Truncation**, **Comparison period**, and/or **Direction**.
## Work with metrics in datasets (Deprecated)
[Datasets](/docs/datasets) are deprecated:
* Starting June 2, 2026, you will no longer be able to create datasets or edit existing datasets.
* Starting September 15, 2026, you will no longer be able to use datasets as a data source or view datasets in Sigma.
Migrate your datasets to data models and update any documents that use datasets as a data source to use a different source. See [Migrate a dataset to a data model](/docs/migrate-a-dataset-to-a-data-model).
### Create a metric in a dataset
Follow these steps to create a metric:
1. Open a dataset or database table.
2. In the header, click **Edit**.
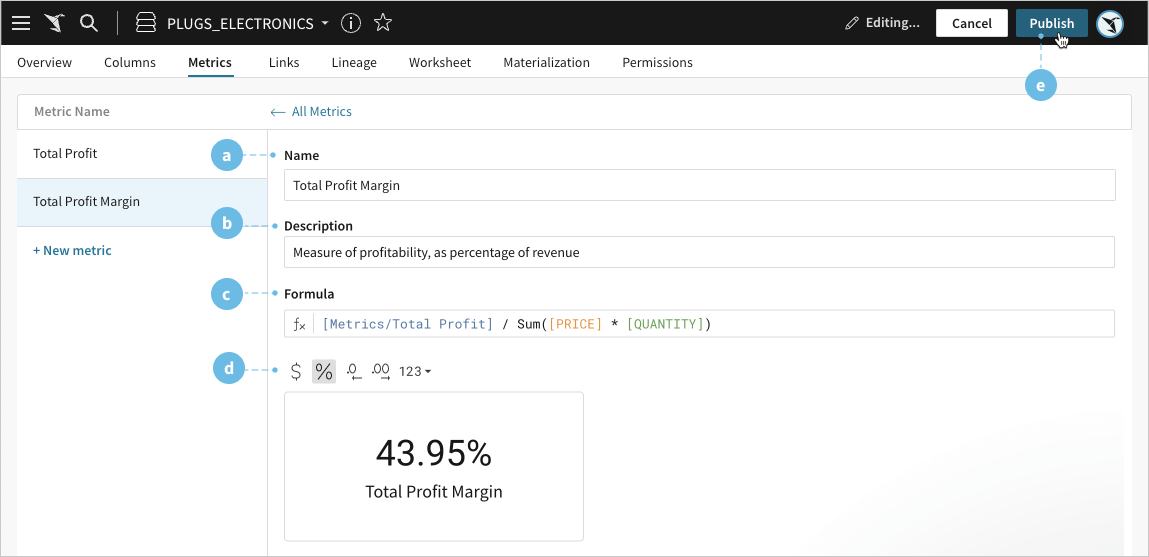
3. Select the **Metrics** tab, then click **Create Metric** to open the metric builder.
4. In the **Name** field, enter the name of the metric.
5. In the **Description** field, enter details about the metric.
This information displays when users apply metrics to a workbook element.
6. In the **Formula** field, define the metric logic.
You can use Sigma functions, and reference any column in the open dataset or database table.
You can also use an existing metric of the dataset; this is a very powerful practice to build reusable calculation components in your dataset.
7. Use the quick formatting tools and preview to customize the metric output.
For example, you can specify the formula result as a currency or a percentage, set the number of decimal places, or select options from the full format menu by clicking the number format menu ().
Metrics define aggregate calculations. If the metric builder preview returns a `null` value, your formula might be missing an aggregate function, such as `Sum()`, `Avg()`, `Count()`, and so on.
8. In the header, click **Publish** to save the metric.
### Edit a metric in a dataset
When you edit a metric, Sigma reflects your changes in workbook elements that link to the specific dataset or database table. All workbook references to the metric include name and description changes, and Sigma recalculates metric results based on formula updates.
To edit a metric, follow these steps:
1. Open the dataset or database table that contains the metric that you plan to edit.
2. Click **Edit**.
3. Select the **Metrics** tab.
4. Locate the metric in the list, and click its name to open the metric in the metric builder.
5. Edit the metric name, description, formula, and formatting as needed, then click **Publish** to update the metric.
### Delete a metric in a dataset
When you delete a metric, its calculation becomes invalid in workbook elements. Tables display error messages in columns that previously included metric output. Visualizations and pivot tables display an error message instead of the element.
1. Open the dataset or database table that contains the metric you plan to delete.
2. Click **Edit**.
3. Select the **Metrics** tab.
4. In the list of metrics, find the metric that you plan to delete.
5. For the metric, click **More** (), then select **Delete**.
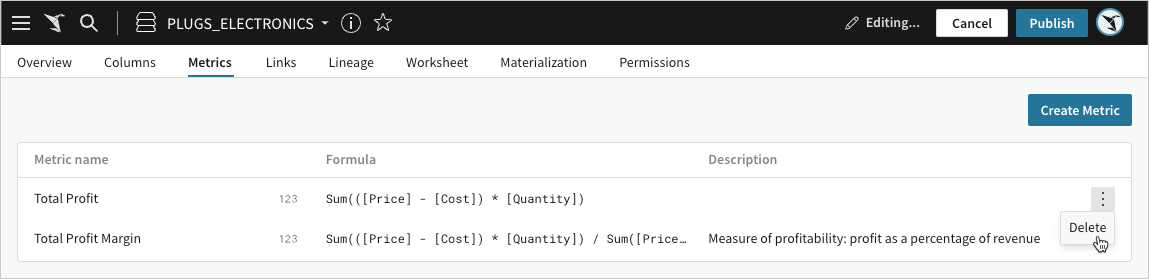
Alternatively, select the metric to open the metrics builder and locate the metric in the side panel. Next to the name of the metric, click **Delete metric** (
**Configure metrics** to open the **Configure metrics** popover.
4. Turn on the **Enable default timeline** toggle.
5. For **Date**, choose a date column from the table to use for the default timeline.
6. (Optional) For **Truncation**, choose the default date truncation, or choose to remove the date truncation and use the existing granularity of the date column.
7. (Optional) For **Comparison period**, choose the default comparison period, or choose **None**.
8. (Optional) For **Direction**, choose the default direction for the comparison trend, or choose **None**.

You can override the default timeline for a metric in the **Add a metric** or **Edit metric** modal by changing the timeline settings or turning off the **Timeline** toggle. If you want a metric with a manually-configured timeline to use the default timeline configuration, click **Reset to default** in the **Add a metric** or **Edit metric** modal.
#### Manage a default timeline for metrics
You can edit the default timeline configuration for metrics created on a data element, or turn it off entirely.
When you edit a default timeline for a data element, all metrics for that data element without manually-configured timelines update to reflect the new default timeline settings. If you turn off a default timeline for a data element, all metrics for that data element without manually-configured timelines update to no longer have timelines configured.
1. Select the data element in the data model that you want to configure a default timeline for.
2. In the editor panel, select the **Modeling** tab.
3. In the **Metrics** section of the **Modeling** tab, click **Configure metrics** to open the **Configure metrics** popover.
4. Configure the default metric timeline:
* To turn off the default timeline, turn off the **Enable default timeline** toggle.
* To modify the default timeline, change the selections under **Date**, **Truncation**, **Comparison period**, and/or **Direction**.
## Work with metrics in datasets (Deprecated)
[Datasets](/docs/datasets) are deprecated:
* Starting June 2, 2026, you will no longer be able to create datasets or edit existing datasets.
* Starting September 15, 2026, you will no longer be able to use datasets as a data source or view datasets in Sigma.
Migrate your datasets to data models and update any documents that use datasets as a data source to use a different source. See [Migrate a dataset to a data model](/docs/migrate-a-dataset-to-a-data-model).
### Create a metric in a dataset
Follow these steps to create a metric:
1. Open a dataset or database table.
2. In the header, click **Edit**.
3. Select the **Metrics** tab, then click **Create Metric** to open the metric builder.
4. In the **Name** field, enter the name of the metric.
5. In the **Description** field, enter details about the metric.
This information displays when users apply metrics to a workbook element.
6. In the **Formula** field, define the metric logic.
You can use Sigma functions, and reference any column in the open dataset or database table.
You can also use an existing metric of the dataset; this is a very powerful practice to build reusable calculation components in your dataset.
7. Use the quick formatting tools and preview to customize the metric output.
For example, you can specify the formula result as a currency or a percentage, set the number of decimal places, or select options from the full format menu by clicking the number format menu ().
Metrics define aggregate calculations. If the metric builder preview returns a `null` value, your formula might be missing an aggregate function, such as `Sum()`, `Avg()`, `Count()`, and so on.
8. In the header, click **Publish** to save the metric.

### Edit a metric in a dataset
When you edit a metric, Sigma reflects your changes in workbook elements that link to the specific dataset or database table. All workbook references to the metric include name and description changes, and Sigma recalculates metric results based on formula updates.
To edit a metric, follow these steps:
1. Open the dataset or database table that contains the metric that you plan to edit.
2. Click **Edit**.
3. Select the **Metrics** tab.
4. Locate the metric in the list, and click its name to open the metric in the metric builder.
5. Edit the metric name, description, formula, and formatting as needed, then click **Publish** to update the metric.
### Delete a metric in a dataset
When you delete a metric, its calculation becomes invalid in workbook elements. Tables display error messages in columns that previously included metric output. Visualizations and pivot tables display an error message instead of the element.
1. Open the dataset or database table that contains the metric you plan to delete.
2. Click **Edit**.
3. Select the **Metrics** tab.
4. In the list of metrics, find the metric that you plan to delete.
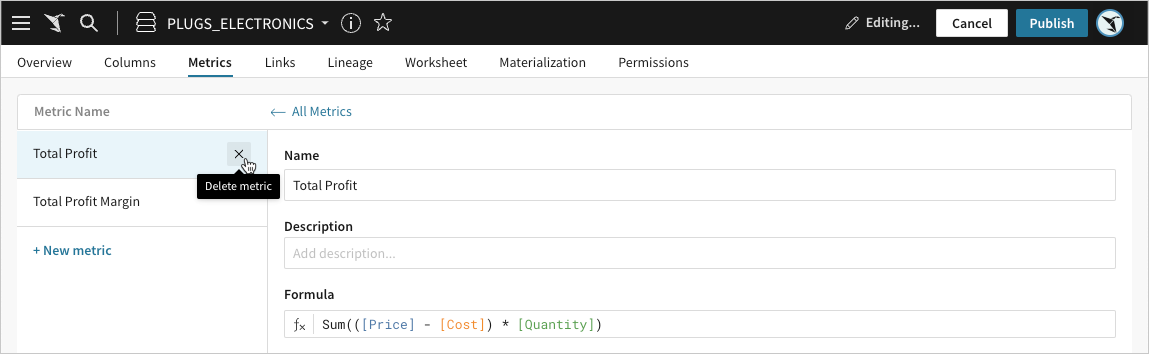
5. For the metric, click **More** (), then select **Delete**.

Alternatively, select the metric to open the metrics builder and locate the metric in the side panel. Next to the name of the metric, click **Delete metric** ( ).
6. 
## Related resources
* [Use metrics in a workbook](/docs/use-metrics-in-a-workbook)
).
6. 
## Related resources
* [Use metrics in a workbook](/docs/use-metrics-in-a-workbook)