> For clean Markdown of any page, append .md to the page URL.
> For a complete documentation index, see https://help.sigmacomputing.com/llms.txt.
> For AI client integration (Claude Code, Cursor, etc.), connect to the MCP server at https://help.sigmacomputing.com/_mcp/server.
# Create a data element
[Workbooks](/docs/workbooks-overview) support many [element types](/docs/intro-to-element-types). Data elements are elements built directly from a data source and include [tables](/docs/create-and-manage-tables), [pivot tables,](/docs/working-with-pivot-tables) and [charts](/docs/intro-to-visualizations).
Although each type of data element displays data in a different way, the underlying data is always tabular and column-based. To understand the structure of visualized or pivoted data, view the underlying data for the data element. See [View underlying data](/docs/view-underlying-data).
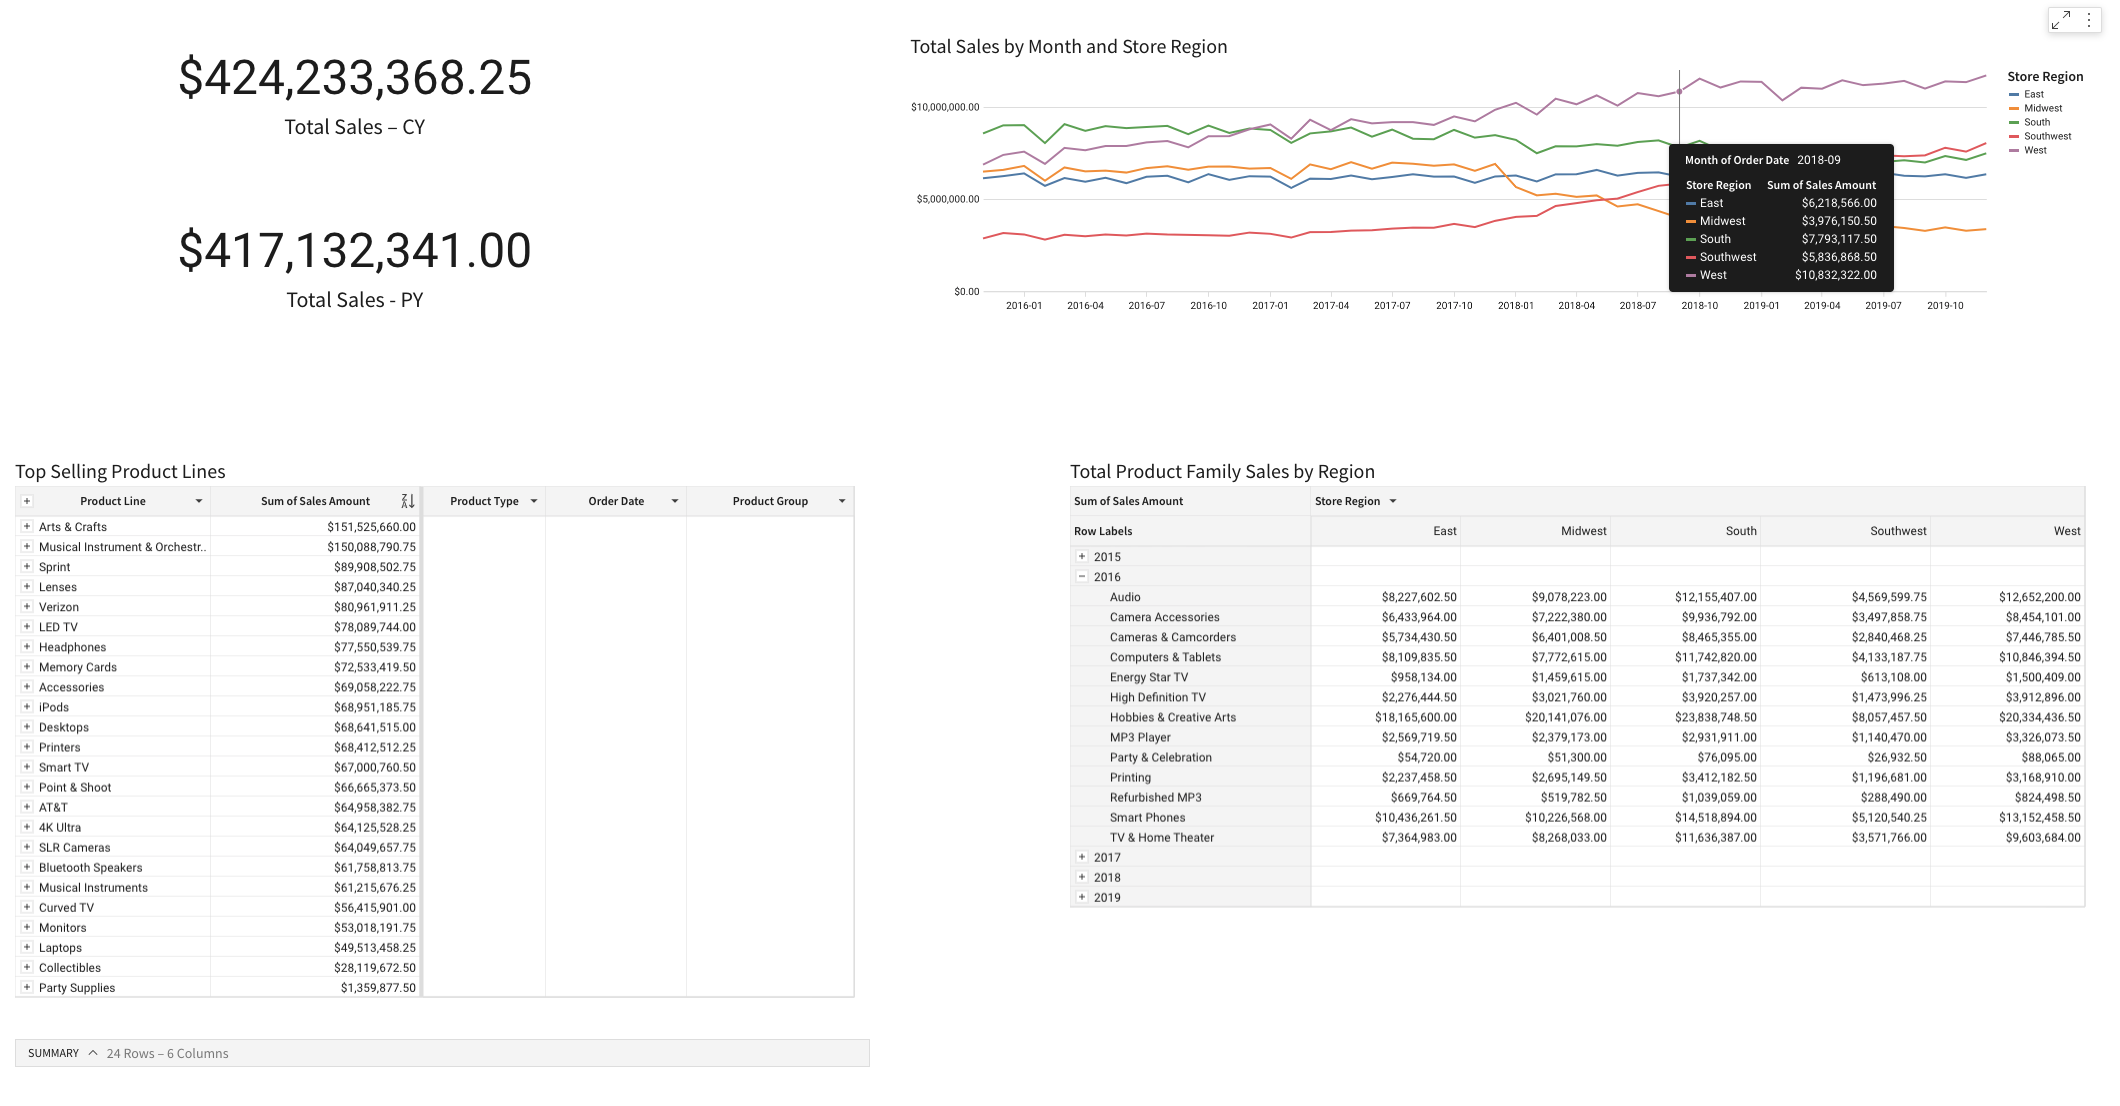
## Data sources for data elements
When you create a workbook, you can add elements from a variety of data sources. You can add new sources at any time, and you are not restricted to a single source per workbook or workbook page.
Available data sources include tables from connected cloud data warehouses (CDW), Sigma data models or datasets, CSV-formatted files that you upload, SQL commands, other workbook data elements, and more.
You can create a data element from several different sources:
* A new source.
* A source already in use in the workbook.
* An existing data element. To create an element from another element, see [Create a data element from an existing element on the canvas](#create-a-data-element-from-an-existing-element-on-the-canvas).
### Effects of upstream changes
Changes made to a data source might affect child elements that depend on that data source. For example, if a bar chart element depends on a table element as a data source, deleting a column from the table element makes the column inaccessible to the bar chart element. Hiding the column makes the column unavailable by default, accessible to the bar chart only as a source column.
Consider reusability of a data source when building a workbook and creating data elements:
* Convert data elements to data models to reuse them across workbooks.
* Create calculated columns and filters in source tables.
* Review element lineage when troubleshooting unexpected data changes.
## Requirements
* To create a data element, you must have **Can edit** or **Can explore** [access](/docs/folder-and-document-permissions) to an individual workbook.
* The workbook must be in either **Edit** mode or **Explore** mode. See [Workbook modes overview](/docs/workbook-modes-overview).
* To upload CSVs or write custom SQL, you must be assigned an account type with the **Upload CSV** or **Write SQL** permission enabled. See [Account types](/docs/account-type-and-license-overview).
## Add a data element to a workbook page
To add a data element to your workbook page, do the following:
1. Open a workbook for customizing or editing.
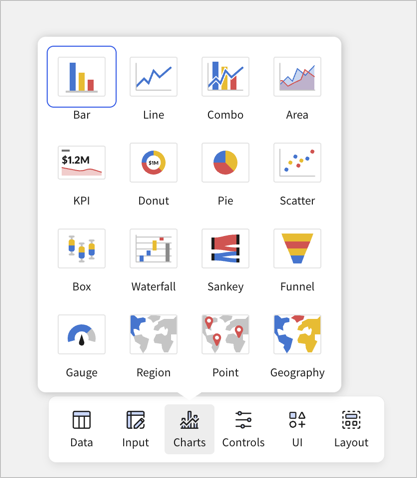
2. In the **Add element** bar, choose what to add. To add a table or pivot table, select **Data**, then choose the relevant option. To add a chart, select **Charts**, then choose the chart that you want to add.
3. Select a data source. You can add a data source immediately, or preview it and select specific columns to add:
* To use a data model, database or catalog table, dataset, or other workbook element as a data source, perform a search, browse the **Elements** from the current workbook, or select a table, data model, or dataset from **Tables and Datasets**.
Hover over an available data source and select **Preview** to open the data source columns and values. Sources already in use in the workbook or in other workbooks that you have access to appear with different icons. You can hover over the lineage icon ( ) to identify sources in use by the current workbook.
* If you preview a data source, you can select or deselect different columns in the data source and then select **Add** to add the data source.
* To upload a CSV-formatted file, select **CSV**.
* To write custom SQL to retrieve data from your data platform, select **SQL**. See [Write custom SQL](/docs/write-custom-sql).
* To combine data sources, select **Join** or **Union**. See [Join data in workbooks](/docs/create-and-edit-joins-in-data-models-and-workbooks).
* To transpose existing data sources, select **Transpose**. See [Transpose a table](/docs/transpose-a-table).
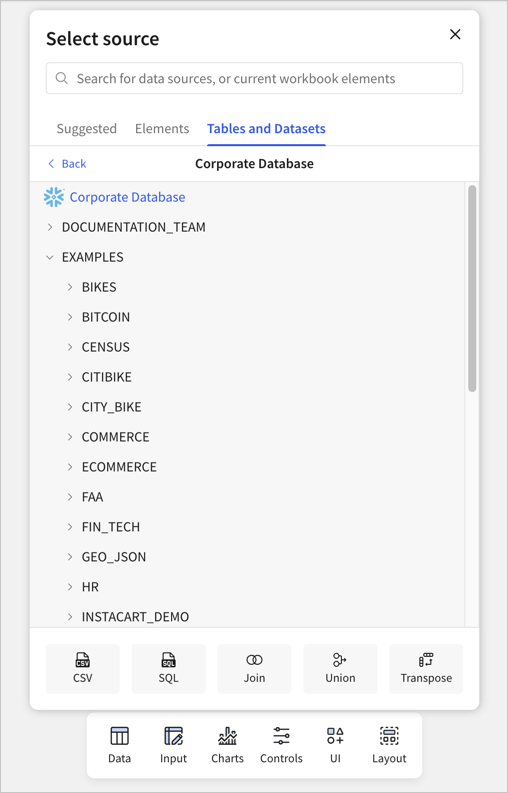
After you select the data source for the element, the new element appears on the page with the editor panel open for the element.
## Create a data element from an existing element on the canvas
You can create a child data element from a table, pivot table, or input table on a workbook page. For example, create a chart from a table element.
1. Hover over the element that you want to use as a data source.
2. Select
) to identify sources in use by the current workbook.
* If you preview a data source, you can select or deselect different columns in the data source and then select **Add** to add the data source.
* To upload a CSV-formatted file, select **CSV**.
* To write custom SQL to retrieve data from your data platform, select **SQL**. See [Write custom SQL](/docs/write-custom-sql).
* To combine data sources, select **Join** or **Union**. See [Join data in workbooks](/docs/create-and-edit-joins-in-data-models-and-workbooks).
* To transpose existing data sources, select **Transpose**. See [Transpose a table](/docs/transpose-a-table).

After you select the data source for the element, the new element appears on the page with the editor panel open for the element.
## Create a data element from an existing element on the canvas
You can create a child data element from a table, pivot table, or input table on a workbook page. For example, create a chart from a table element.
1. Hover over the element that you want to use as a data source.
2. Select  **Create child element** to create a child element based on the selected element.
3. Select an element type: **Chart**, **Table**, **Pivot table**, or **Linked input table**.
The new element appears on the page with the editor panel open for the element.
## Identify and edit an element's data source
To identify and make changes to the data source of a data element, select the element and review the **Properties** tab of the editor panel.
1. Open the workbook for customizing or editing.
If the editor panel is not visible, click **Show panels** (
**Create child element** to create a child element based on the selected element.
3. Select an element type: **Chart**, **Table**, **Pivot table**, or **Linked input table**.
The new element appears on the page with the editor panel open for the element.
## Identify and edit an element's data source
To identify and make changes to the data source of a data element, select the element and review the **Properties** tab of the editor panel.
1. Open the workbook for customizing or editing.
If the editor panel is not visible, click **Show panels** ( ).
2. Select an element on the workbook canvas, then select the **Properties** tab of the editor panel.
3. The data source is shown under **Data source**.
To view, change, or transform a data source for a selected element, select the down arrow (
).
2. Select an element on the workbook canvas, then select the **Properties** tab of the editor panel.
3. The data source is shown under **Data source**.
To view, change, or transform a data source for a selected element, select the down arrow ( ) next to the data source name. See [Change the data source for a workbook, data model, or element](/docs/change-the-data-source-for-a-workbook-data-model-or-element).
### Change the grouping level of a data source
When a grouped table is used as the data source for a data element, all source columns of the table are used as the data source by default. To change which columns are available to your table, such as to use only the columns in a specific grouping level, change the granularity of the data source:
1. Select the table, then select the **Properties** tab of the editor panel.
2. For **Data source**, review the source table and the **Source grouping** option.
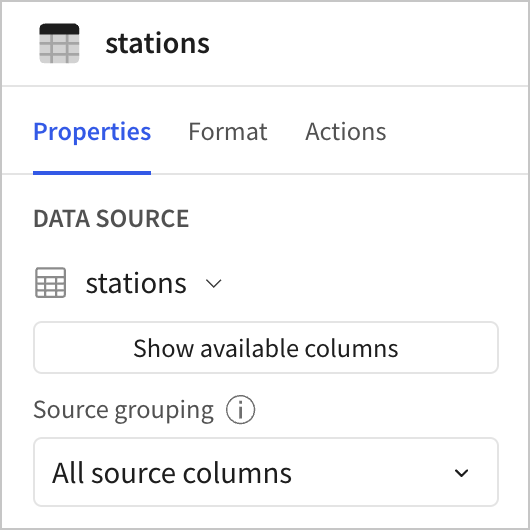
3. Open the column name to review the granularity options available and choose the columns that you want to include. Any lower-level grouping options include the columns from higher-level grouping options. If you want to view all columns, choose **All source columns**.
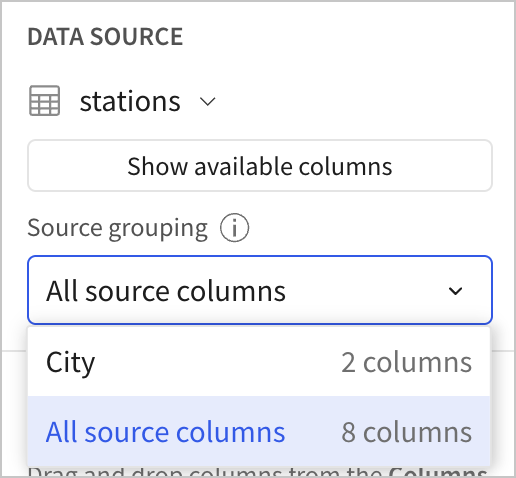
The element updates to reflect the available source columns.
## Related resources
* [Create and manage tables](/docs/create-and-manage-tables)
* [Working with pivot tables](/docs/working-with-pivot-tables)
* [Intro to charts](/docs/intro-to-visualizations)
* [Send or schedule workbook exports](/docs/send-or-schedule-workbook-exports)
) next to the data source name. See [Change the data source for a workbook, data model, or element](/docs/change-the-data-source-for-a-workbook-data-model-or-element).
### Change the grouping level of a data source
When a grouped table is used as the data source for a data element, all source columns of the table are used as the data source by default. To change which columns are available to your table, such as to use only the columns in a specific grouping level, change the granularity of the data source:
1. Select the table, then select the **Properties** tab of the editor panel.
2. For **Data source**, review the source table and the **Source grouping** option.

3. Open the column name to review the granularity options available and choose the columns that you want to include. Any lower-level grouping options include the columns from higher-level grouping options. If you want to view all columns, choose **All source columns**.

The element updates to reflect the available source columns.
## Related resources
* [Create and manage tables](/docs/create-and-manage-tables)
* [Working with pivot tables](/docs/working-with-pivot-tables)
* [Intro to charts](/docs/intro-to-visualizations)
* [Send or schedule workbook exports](/docs/send-or-schedule-workbook-exports)