Enter a hex code or select a color for the gauge fill (the area that extends from the minimum value to the measurable value).
See Conditional Formatting for information about adding formatting rules.


 **Element properties** panel:
* **Chart**: chart type displayed in the workbook
* **Value**: source column that defines the measurable value
* **Minimum**: source column that defines the minimum gauge value
* **Maximum**: source column that defines the maximum gauge value
In a gauge chart, a single value is measured on a radial scale. The minimum and maximum values determine the range of the gauge and provide reference points for assessing the measurable value.
### Select the chart type
After you [add a new chart](/docs/create-a-data-element) to a workbook, select the chart type:
* In the **Chart** property, click the dropdown field and select **Gauge** from the list. 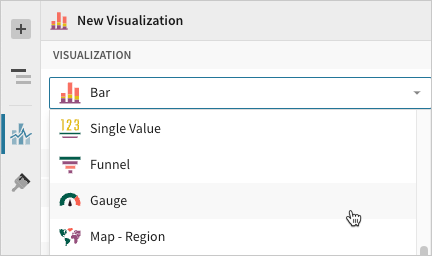
You can also use this dropdown field to convert an existing chart to a different type. Sigma retains all property and format configurations shared by the initial and new type. Unshared properties and formatting are not saved or restored if you further convert the chart.
### Define the measurable value
Configure a source column to define the measurable value.
1. In the **Value** property, click
**Element properties** panel:
* **Chart**: chart type displayed in the workbook
* **Value**: source column that defines the measurable value
* **Minimum**: source column that defines the minimum gauge value
* **Maximum**: source column that defines the maximum gauge value
In a gauge chart, a single value is measured on a radial scale. The minimum and maximum values determine the range of the gauge and provide reference points for assessing the measurable value.
### Select the chart type
After you [add a new chart](/docs/create-a-data-element) to a workbook, select the chart type:
* In the **Chart** property, click the dropdown field and select **Gauge** from the list. 
You can also use this dropdown field to convert an existing chart to a different type. Sigma retains all property and format configurations shared by the initial and new type. Unshared properties and formatting are not saved or restored if you further convert the chart.
### Define the measurable value
Configure a source column to define the measurable value.
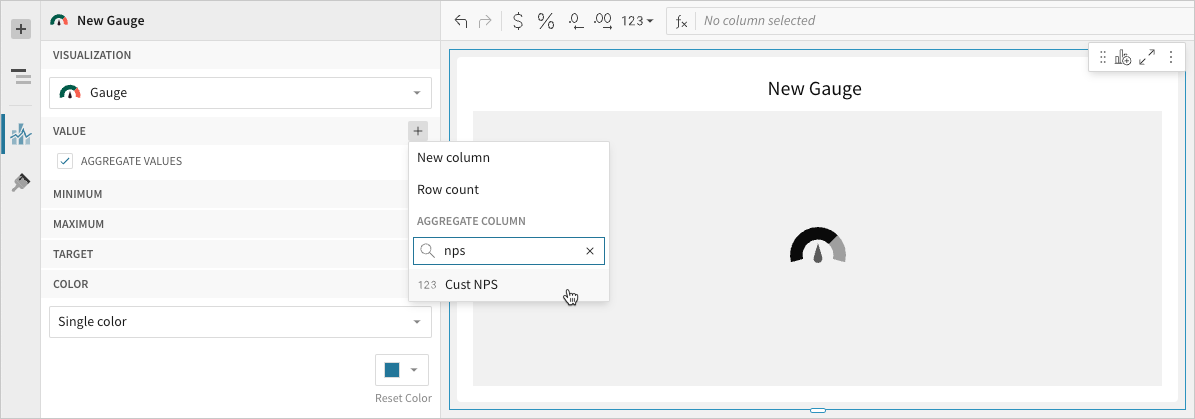
1. In the **Value** property, click  **Add calculation** and select an option from the menu:
* To aggregate the values of an existing column, search or scroll the **Aggregate column** list and select the preferred column name.
* To apply a custom formula or constant value, select **New column** and enter the formula or value in the toolbar.
* To count the number of rows in the data source, select **Row count**.
You can also select or replace an existing column by dragging and dropping a column name from the **Columns** list to the **Value** property.
2. \[optional] Control how the data is calculated and displayed in the chart:
1. Hover over the source column name, then click the caret (
**Add calculation** and select an option from the menu:
* To aggregate the values of an existing column, search or scroll the **Aggregate column** list and select the preferred column name.
* To apply a custom formula or constant value, select **New column** and enter the formula or value in the toolbar.
* To count the number of rows in the data source, select **Row count**.
You can also select or replace an existing column by dragging and dropping a column name from the **Columns** list to the **Value** property.

2. \[optional] Control how the data is calculated and displayed in the chart:
1. Hover over the source column name, then click the caret ( ) to open the column menu.
2. Hover over any of the following items, then select the preferred option:
* **Set aggregate** - Calculate the value based on the selected aggregation method.
* **Transform** - Convert the column to the selected [data value type](/docs/data-types-and-formats).
* **Format** - Display the data label in the selected format.
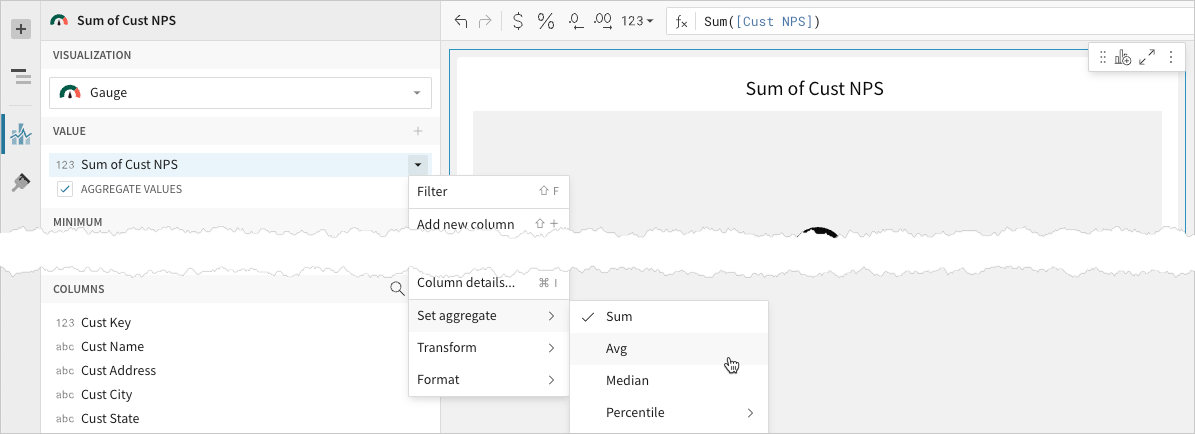
You can also use the toolbar to change the aggregation method (using the formula) and data label format.
### Define the gauge range
Configure a source column to define the minimum and maximum gauge values.
1. In the **Minimum** property, click **Add calculation** and select an option from the menu:
* To aggregate the values of an existing column, search or scroll the **Aggregate column** list and select the preferred column name.
* To apply a custom formula or constant value, select **New column** and enter the formula or value in the toolbar.
* To count the number of rows in the data source, select **Row count**.
You can also select or replace an existing column by dragging and dropping a column name from the **Columns** list to the **Minimum** property.
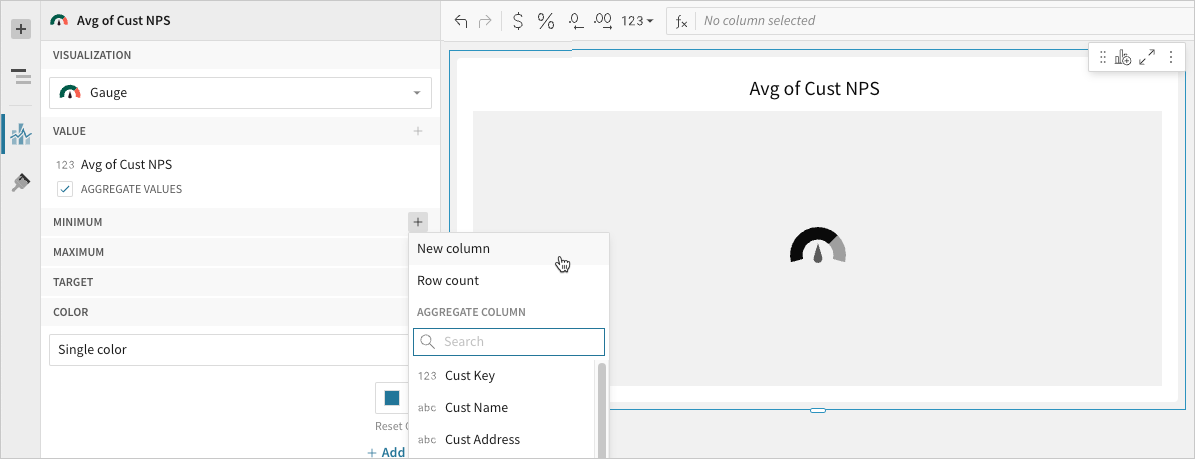
If you don't configure a value in the **Minimum** property, the value defaults to zero.
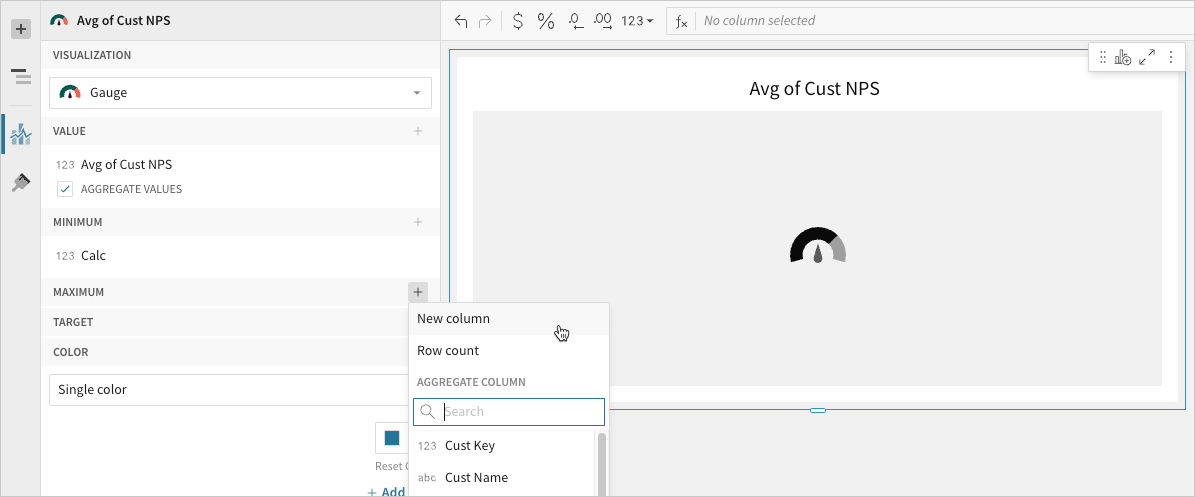
2. In the **Maximum** property, click **Add calculation** and select an option from the menu:
* To aggregate the values of an existing column, search or scroll the **Aggregate column** list and select the preferred column name.
* To apply a custom formula or constant value, select **New column** and enter the formula or value in the toolbar.
* To count the number of rows in the data source, select **Row count**.
You can also select or replace an existing column by dragging and dropping a column name from the Columns list to the Maximum property.
3. \[optional] Sigma auto-generates source column names and chart titles to reflect the visualized data, but you can customize these fields as needed:
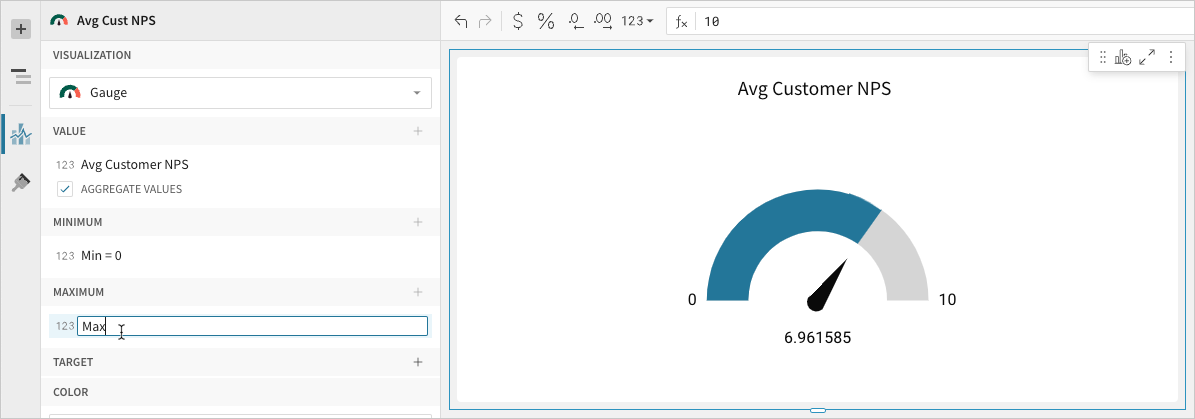
* To rename a source column, double-click its name in the **Value**, **Minimum**, or **Maximum** property, then enter a new name. Changes to the **Value** property are reflected in the default chart title.
* To edit the chart title, double-click the title in the chart, then enter a new title.
Sigma auto-generates the default chart title only. Once the title is customized, it no longer reflects changes to the **Value** property.
## Advanced gauge chart properties and formatting
Sigma features various properties and format options that give you the flexibility to build detailed gauge charts.
The following sections introduce configurations that can enhance your charts and help you deliver specific insights with meaningful and actionable information.
### Configure target value
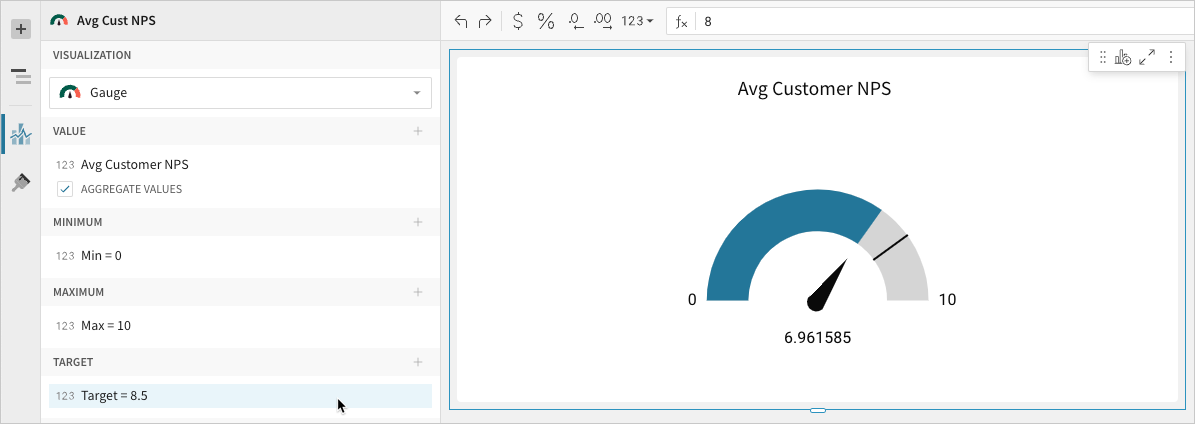
Configure a target value in the **Element properties** > **Target** property to mark a goal or benchmark on the gauge. The **Target** property can be configured in the same way as the **Value**, **Minimum**, and **Maximum** properties.
### Configure chart colors
Configure chart colors in the
) to open the column menu.
2. Hover over any of the following items, then select the preferred option:
* **Set aggregate** - Calculate the value based on the selected aggregation method.
* **Transform** - Convert the column to the selected [data value type](/docs/data-types-and-formats).
* **Format** - Display the data label in the selected format.

You can also use the toolbar to change the aggregation method (using the formula) and data label format.
### Define the gauge range
Configure a source column to define the minimum and maximum gauge values.
1. In the **Minimum** property, click **Add calculation** and select an option from the menu:
* To aggregate the values of an existing column, search or scroll the **Aggregate column** list and select the preferred column name.
* To apply a custom formula or constant value, select **New column** and enter the formula or value in the toolbar.
* To count the number of rows in the data source, select **Row count**.
You can also select or replace an existing column by dragging and dropping a column name from the **Columns** list to the **Minimum** property.

If you don't configure a value in the **Minimum** property, the value defaults to zero.
2. In the **Maximum** property, click **Add calculation** and select an option from the menu:
* To aggregate the values of an existing column, search or scroll the **Aggregate column** list and select the preferred column name.
* To apply a custom formula or constant value, select **New column** and enter the formula or value in the toolbar.
* To count the number of rows in the data source, select **Row count**.
You can also select or replace an existing column by dragging and dropping a column name from the Columns list to the Maximum property.

3. \[optional] Sigma auto-generates source column names and chart titles to reflect the visualized data, but you can customize these fields as needed:
* To rename a source column, double-click its name in the **Value**, **Minimum**, or **Maximum** property, then enter a new name. Changes to the **Value** property are reflected in the default chart title.
* To edit the chart title, double-click the title in the chart, then enter a new title.
Sigma auto-generates the default chart title only. Once the title is customized, it no longer reflects changes to the **Value** property.

## Advanced gauge chart properties and formatting
Sigma features various properties and format options that give you the flexibility to build detailed gauge charts.
The following sections introduce configurations that can enhance your charts and help you deliver specific insights with meaningful and actionable information.
### Configure target value
Configure a target value in the **Element properties** > **Target** property to mark a goal or benchmark on the gauge. The **Target** property can be configured in the same way as the **Value**, **Minimum**, and **Maximum** properties.

### Configure chart colors
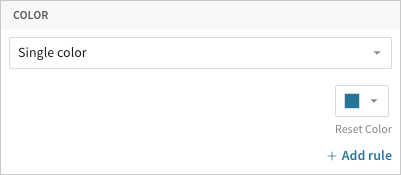
Configure chart colors in the  **Element properties** > **Color** property.
**Element properties** > **Color** property.

| Single color |
Enter a hex code or select a color for the gauge fill (the area that extends from the minimum value to the measurable value). See Conditional Formatting for information about adding formatting rules. |
|
| By scale | Select a color scale to apply to the gauge. |
|
 **Element properties** > **Color** property, you can configure formatting rules ( **+Add rule**) that determine the gauge fill or gauge scale color according to value- or percentage-based conditions.
By default, conditional formatting applies to the gauge fill color (representing the measurable value), but you can apply rules to the gauge scale by selecting the **Show color on gauge** checkbox. This option hides the gauge fill and conditionally formats segments of the gauge based on values or percentages along the radial scale.
Example:
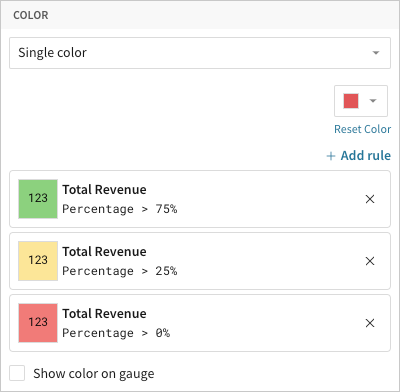
**Element properties** > **Color** property, you can configure formatting rules ( **+Add rule**) that determine the gauge fill or gauge scale color according to value- or percentage-based conditions.
By default, conditional formatting applies to the gauge fill color (representing the measurable value), but you can apply rules to the gauge scale by selecting the **Show color on gauge** checkbox. This option hides the gauge fill and conditionally formats segments of the gauge based on values or percentages along the radial scale.
Example:

|
Gauge fill
(checkbox cleared) |
Gauge
(checkbox selected) |

|

|
| Condition not met | Condition met |

|

|
| Condition not met | Condition met |

|

|
 **Element format** > **Gauge marks** section.
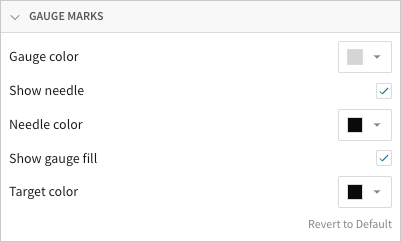
**Element format** > **Gauge marks** section.

| Gauge color |
Enter a hex color code or select a standard color for the unfilled area of the gauge (extending from the end of the gauge fill to the maximum value). Conditional formatting rules take precedence over the Gauge color selection. |

|
| Show needle |
Show or hide the needle that points to the measurable value in the gauge. |

|
| Needle color |
Enter a hex color code or select a standard color for the gauge needle. |

|
| Show gauge fill |
Show or hide the gauge fill color. This field is unavailable when conditional formatting rules exist and the Show color on gauge checkbox is selected (because the selection already hides the gauge fill). |

|
| Target color |
Enter a hex color code or select a standard color for the target mark. This field is unavailable if a target value is not configured in the Target property. |

|